December 2021 Monthly Report

In this blog post we discuss our December 2021 report and provide more information on how to interpret the results. The PDF report can be found at the end.
Key findings:
- Carfentanil was found in four samples, all expected opioid-down
- 85% of expected opioid-down samples contained fentanyl
- The median fentanyl concentration found was 8.0%, with a maximum of over 80%
- Benzodiazepines and/or etizolam were found in 52.0% of expected opioid-down samples
- The maximum concentration of etizolam found was >25%, in an expected opioid-down sample
- Xylazine was detected in 6 samples: 3 expected opioid-down samples and 3 unknown samples, with a maximum concentration of 12.3%
Insight for the December 2021 Monthly Report
December is a dichotomy of dark days that do not deviate far from dawn or dusk due to depressed solar declination, dreamlike displays of dazzling lights dancing off drifts of snow, unending dreary and dismal drizzle dampening demeanors, and delightful decorations to denote the denouement of a year. Despite these diverse descriptors and the differing dispositions that December designs, there was at least one definite thread that drew us all together: drug checking (don’t worry, I’m done with this draining dialogue). Service was busy, the latent heat from the mass spec and Raman kept us warm(er), and kilograms of pixie stick sugar kept that sickeningly sweet holiday spirit alive.
In our November blog, we introduced the roll out of our pop-up drug checking services at various sites across Vancouver Island, facilitated by the governments’ Urgent Public Health Needs Sites (UPHNS) sanctioning. Continuing the expansion of our services into December, we disembarked from Victoria and dashed up to Duncan for a day of distributed drug checking at the Cowichan Overdose Prevention Site, operated by Lookout Housing and Health Society. The exuberant uptake in service by the folks in the Cowichan Valley reinforced the imperative demand for and value of accessible drug checking services. We are grateful for the warm welcome into Duncan, for the opportunity to collaborate with new partners, and we look forward to broadening our services within the Cowichan Valley to better meet the needs of the community.
The data presented in this December discussion dance between details specific to distinct service regions (i.e. Duncan and Victoria) in addition to aggregate results from our project overall.
Drug types
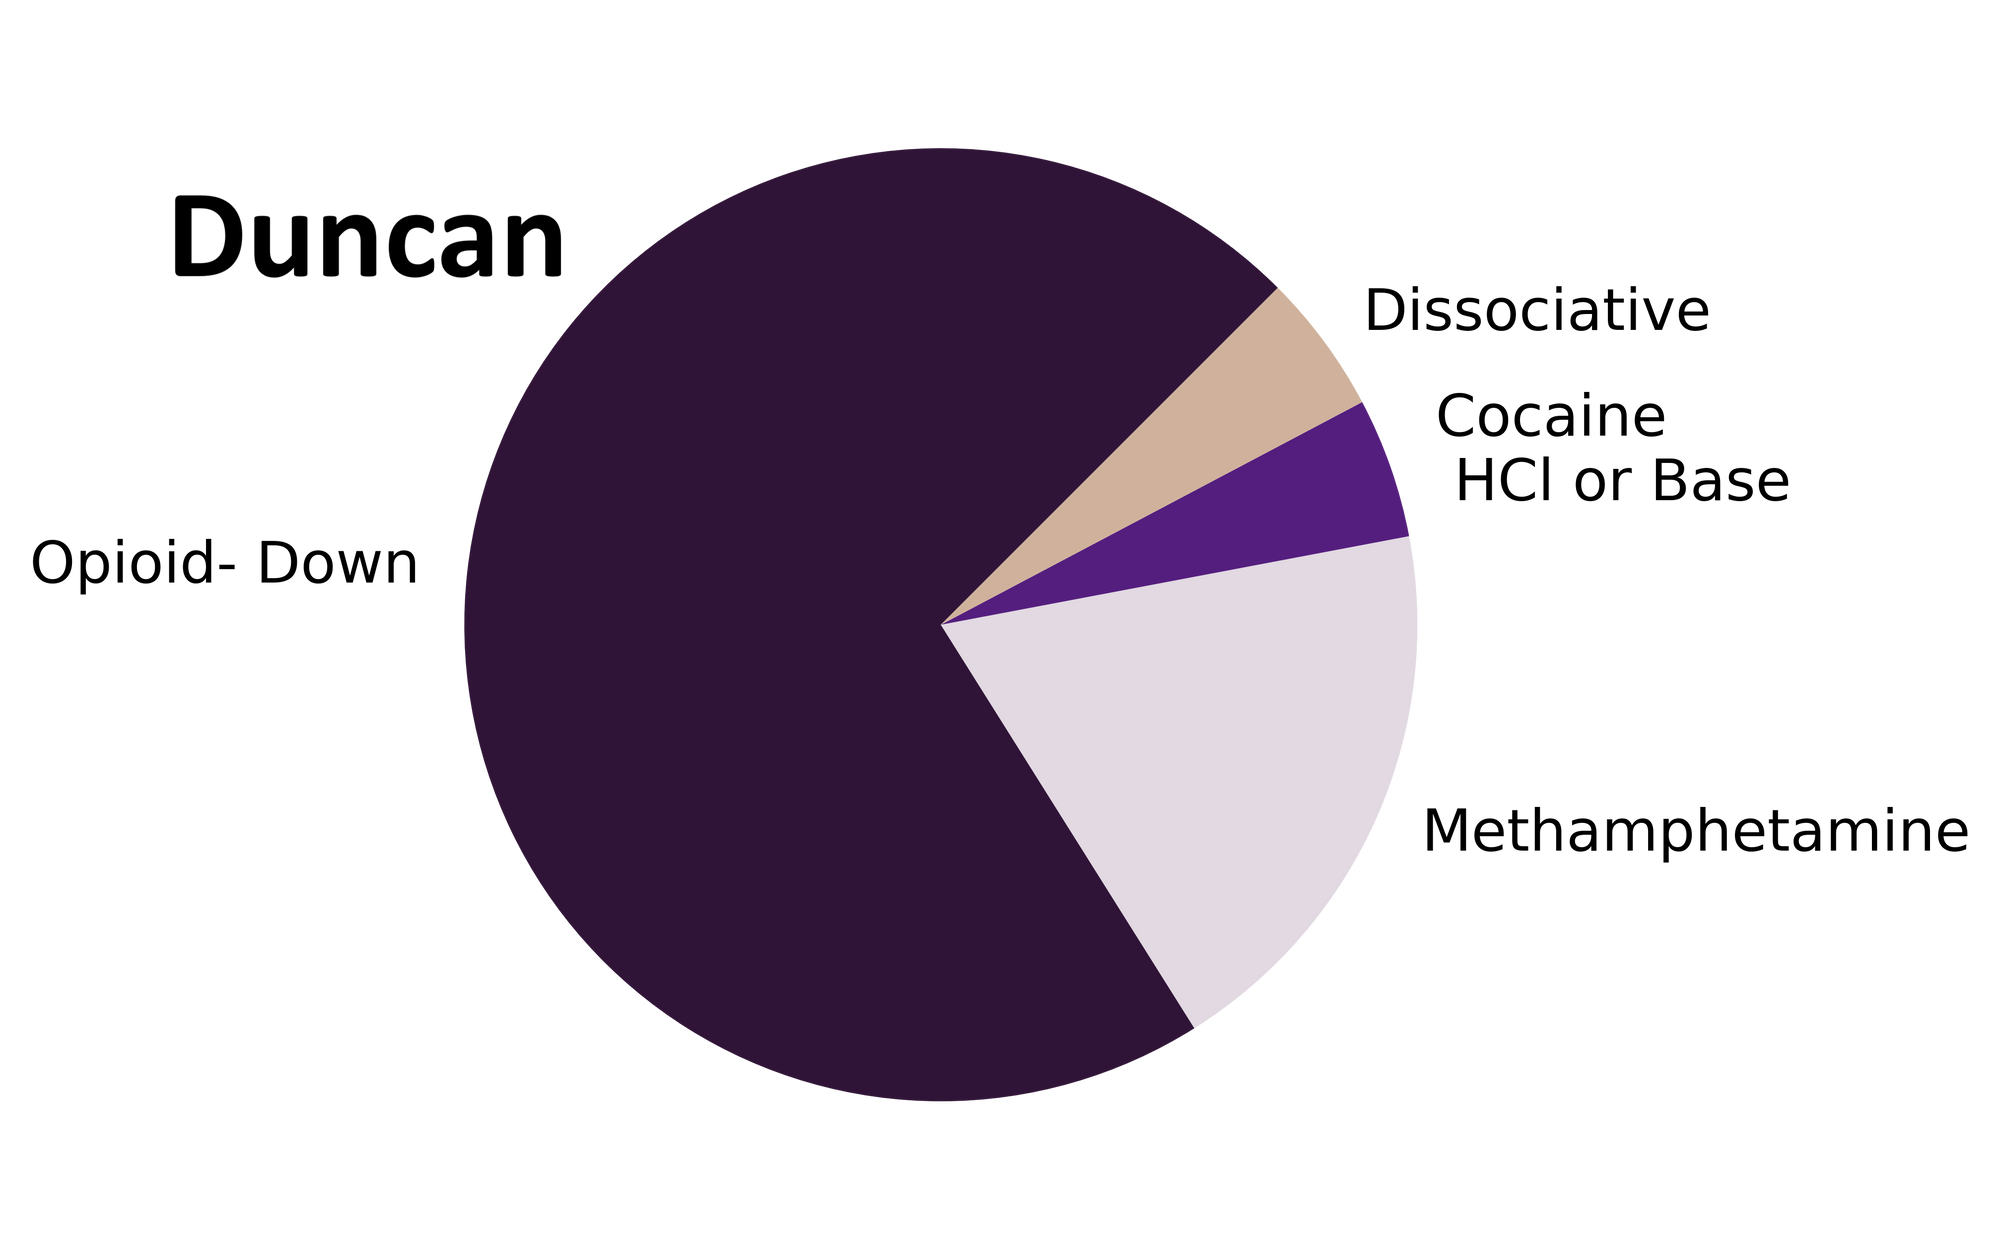
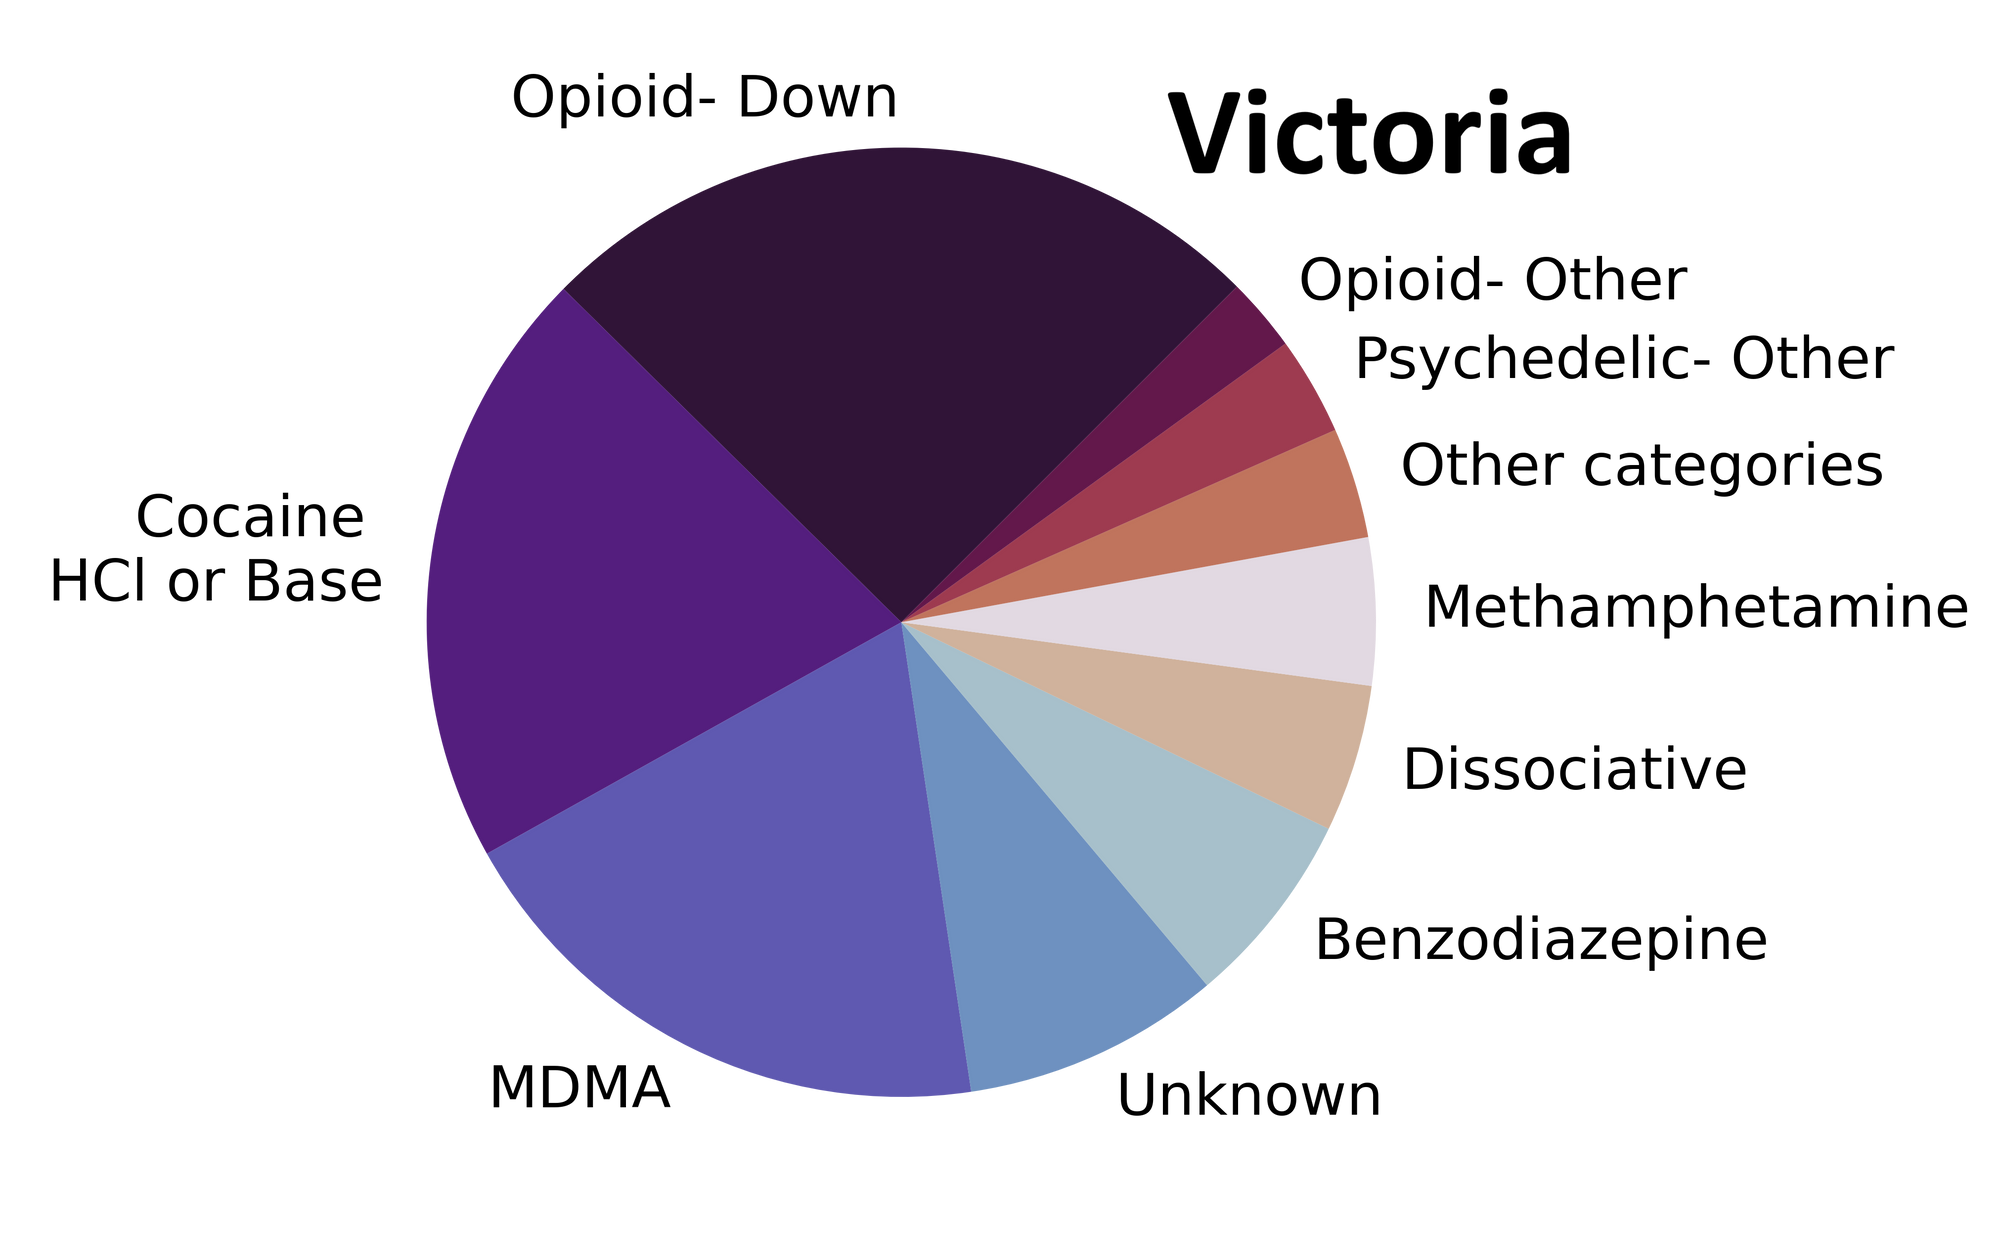
In December, we checked a variety of substances ranging from dissociatives to down to diphenhydramine. Fig. 1 shows the prevalence of each expected drug category checked at each service location. If the holidays left you sick of pies, these data are also tabulated below.

Expecting the unexpected?
For a majority of samples checked, we confirm that the expected drug was indeed the only active and that no additional active compounds were present. The bar charts below highlight a few classes of drugs, differentiating samples when only the expected active was found from situations when other unexpected components were detected.
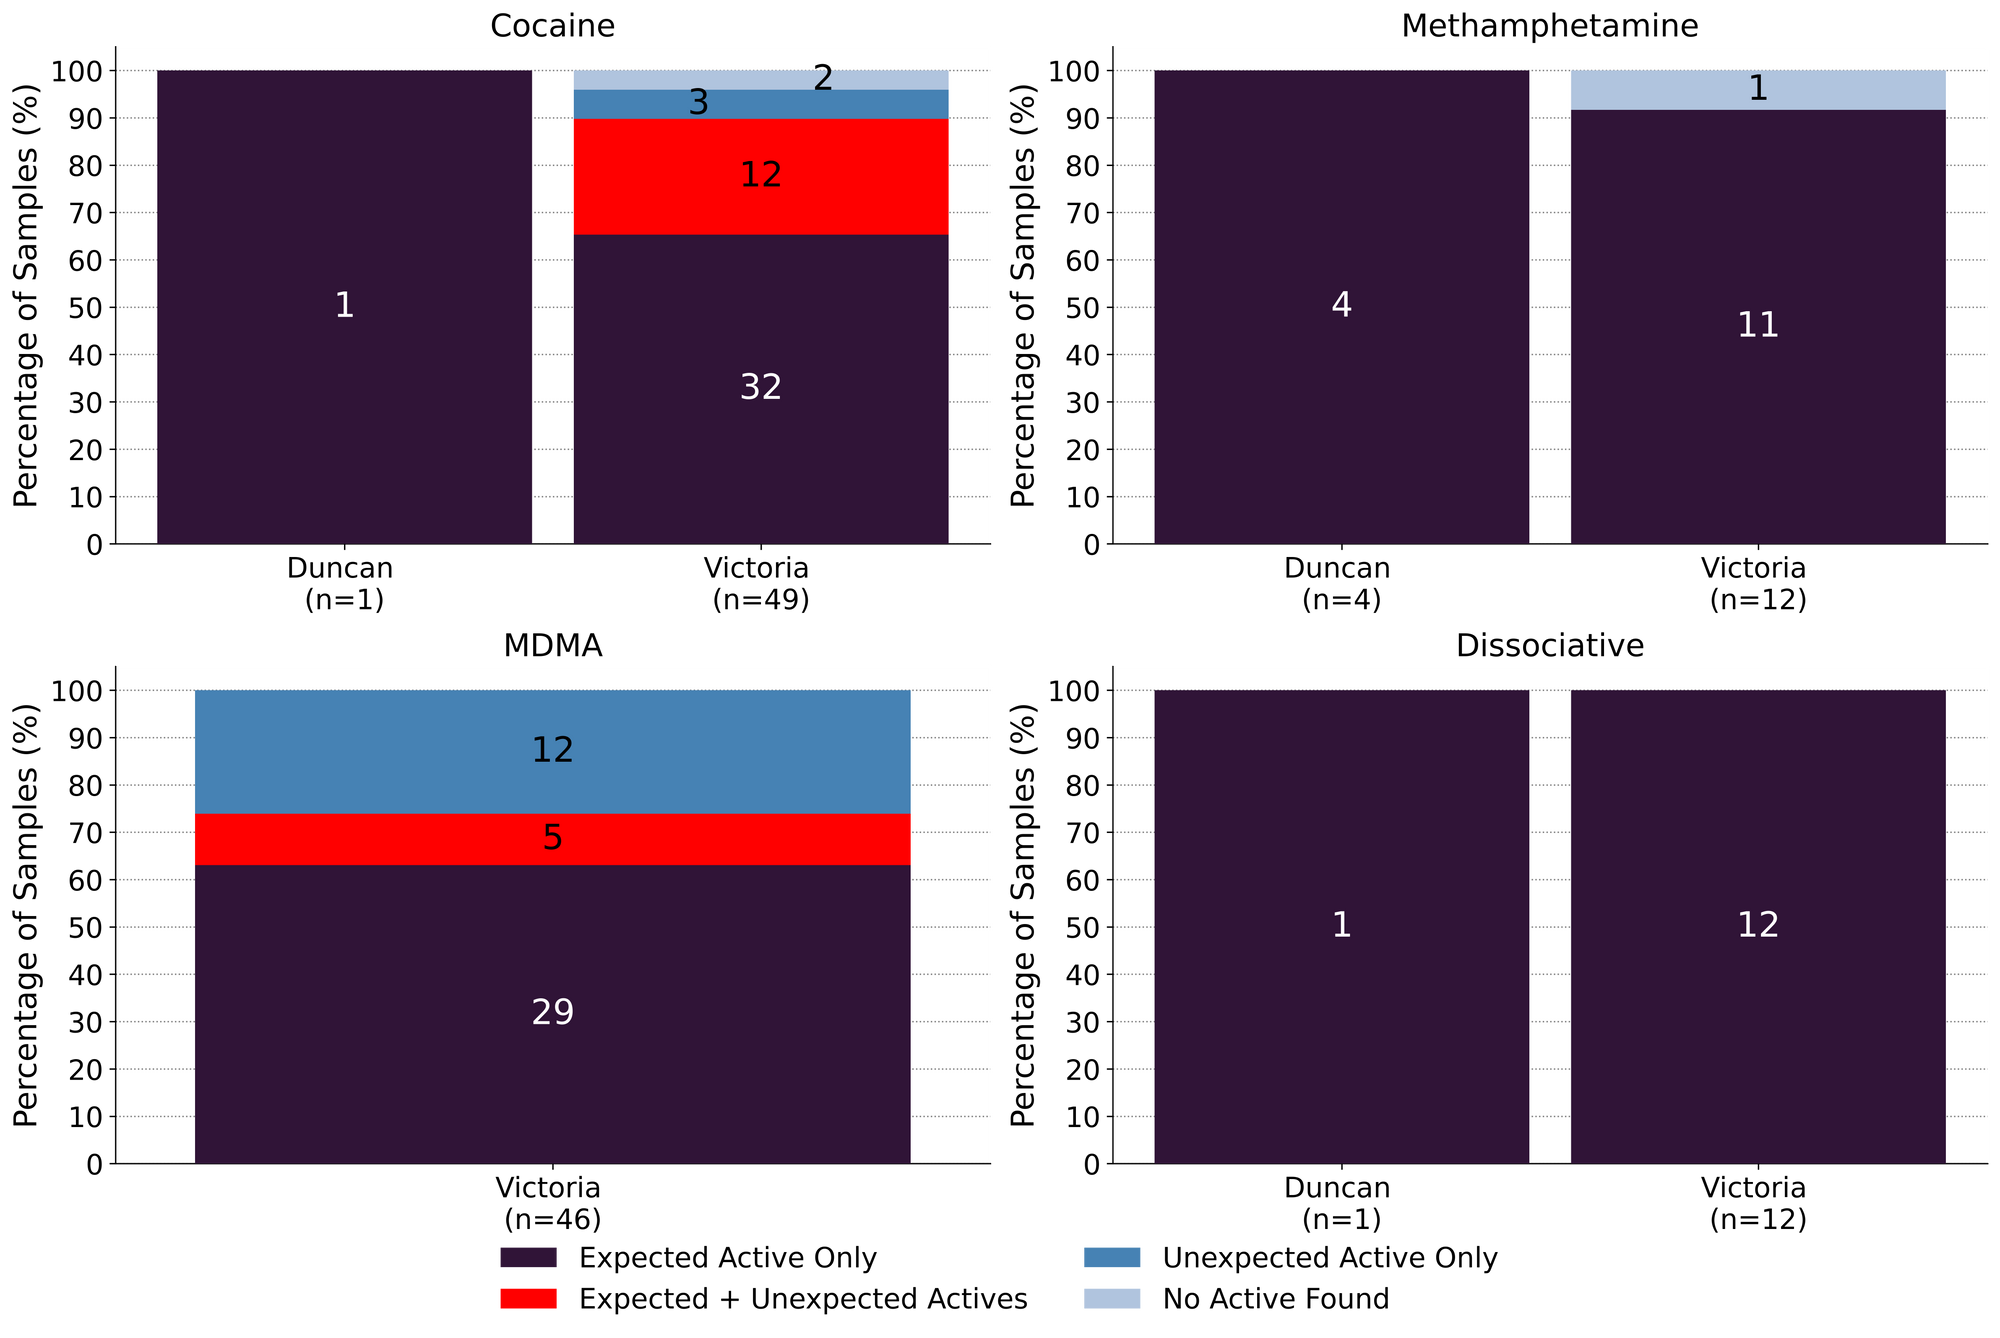
December marked a return to service as we have grown to know it: “meth is meth.” All 15 expected methamphetamine samples checked this month were found to be meth as a single ingredient, no cuts or adulterants detected.
Similarly, ketamine was found as the only active in all 13 ketamine samples checked. Anecdotal reports from the community suggest that wobbly walks around your neighbourhood, garnished with ketamine, pair well with twinkling holiday lights. If anybody is interested in facilitating research on “Scintillating Pleasures: A Vox Populi Study on Altered States of Consciousness and the Perception of LED Light Displays”, please send us your proposals.
50 expected cocaine samples were checked in December across all locations. 66% (33/50) were found to only contain cocaine (or cocaine base) as a single ingredient. 12 samples contained an active component in addition to cocaine: levamisole (an antihelminthic drug used to treat parasitic worm infections, commonly seen as a cut in cocaine) was found in eight samples, phenacetin (an acetaminophen (Tylenol)-like drug) was identified in four samples (one sample contained both levamisole and phenacetin), and methamphetamine was found alongside cocaine in a single sample. Three expected cocaine samples contained no cocaine and rather were found to be methamphetamine, MDMA, and ketamine.
63% (29/46) of the expected MDMA samples checked were found to be MDMA as a single ingredient. Four samples contained both MDMA and MDA, and one sample contained MDMA and fentanyl. 11 expected MDMA samples instead contained MDA as a single ingredient, and one expected MDMA sample was found to just be fentanyl (see the Spotlight Samples below).
Spotlight Samples
Two expected MDMA samples checked in December were found to contain fentanyl. In one sample, the concentration of fentanyl was quantified at 0.1%, with MDMA making up the remaining substance. This sample tested positive for fentanyl via multiple immunoassay test strips as well. Considering the MDMA was brought in alongside a handful of other samples that all travelled together, including a high concentration down sample, we suspect cross-contamination was the culprit for the fentanyl hit.
The other sample was found to be fentanyl as a single ingredient with no trace of MDMA. In the 565 expected MDMA samples we have checked since the beginning of the project, this type of misrepresentation has only been seen twice before (see the April 2021 and July 2021 blog posts).
Misrepresentations could occur for any number of reasons and despite samples like this representing a wee tiny fraction of the substances that we check (i.e. 0.4% of expected MDMA samples), the possibility of negative impacts should not be ignored. These samples reinforce the role that drug checking has as a service for all people who use drugs and emphasize the value of carrying naloxone for the unlikely unexpected occurrence.
Unfortunately, samples like this are also often cherry picked to fuel anti-drug rhetoric that does nothing but perpetuate stigma and harm towards people who use drugs (admittedly, we are also choosing to spotlight these results for discussion, though hopefully we can do so with a more compassionate lens). In the “eyes” of the spectrometer, samples like these are just a pile of molecules vibrating their way through existence like the rest of us; on their own they are neither harmful nor dangerous. The harms of drug use come from the lack of a safe supply making the unregulated market the only source for many substances of choice, from the severe stigmatization of drug use on structural, social, and personal levels that has created deeply entrenched barriers for open use and access to support, and from limited or inaccessible information about safer drug use and harm reduction services.
Acknowledging the above, and the complex relationships that exist with drug use, we also want to highlight the utility that drugs provide in the vast array of scenarios and conditions for which they are used. We hope the information we share helps dispel fear through understanding and supports people in maximizing pleasure in a system so often founded on eradicating it. So maybe reporting on samples like these is more than just our due diligence to highlight our findings in a manner that does not foster further harms; maybe it is also a reminder that drug reform is still in its infancy and, until the day when you can run to the store to pick up some MDMA for grandma so she can party like it’s 2027, that we are here for you: to assist with whatever reasons you have to access drug checking, to help answer questions about the chemistry in your life, and to chat harm reduction while we toss back pixie sticks.
Benzodiazepines (n=16)
16 samples were brought to our service sites that were expected to be a benzodiazepine as a single ingredient; primarily in the form of pressed tablets. Three samples were found to only contain the expected active, with no other actives detected: an expected clonazepam pressed tablet was just clonazepam, an expected lorazepam tab was indeed lorazepam, and some sparkly powder purchased as nitrazolam was simply nitrazolam. Easy breezy.
Slightly less easy and slightly less breezy (...or maybe more breezy? What is the correlation between breeze and nuance?): 12 expected benzo samples did not contain the expected active and were found to contain a different drug. One expected diazepam (Valium) tablet and eight expected alprazolam (Xanax) tablets were found to only contain etizolam. The remaining three expected benzo samples were found to contain no benzos at all and instead contained sertraline (2 samples; a.k.a. Zoloft, a SSRI antidepressant) and trazodone (1 sample; a SARI antidepressant and sleep aid). One expected benzo sample contained no active ingredients at all and appeared to just be sucrose (a sugar pill).
Despite “unexpected actives” showing up, these results were not unexpected to a majority of the service users who brought in these samples. In many cases, the “expected active” is based on the visual appearance of the tablet (e.g. a white bar with “X|A N A|X” stamped on it), even though service users regularly suspect otherwise based on their invaluable experiential knowledge of the drugs they use and the markets from which they come. Hopefully our services can help folks add a name (and correspondingly appropriate dosage) to their experiences.
Opioid-Down (n=75)
In this section we present results specific to the opioid-down supply, therefore they may differ from the highlighted findings above that are inclusive of all expected drug categories.
- 85% of expected opioid-down samples, across all sites, contained fentanyl (64/75)
- Of the remaining 11 samples, 5 contained heroin as the primary active, 1 sample contained no opioid and was found to be N-ethylpentylone, and 5 samples contained no active compounds
- Four samples contained carfentanil in the month of December
- 52% of expected opioid-down samples contained a benzo and/or etizolam (39/75)
- Xylazine was detected in 3 opioid-down samples, with a maximum concentration of 12.3%
- Isotonitazene was detected in one opioid-down samples, with a concentration of 8.0%
This December, 68% of all opioid-down samples checked contained an additional active to the expected fentanyl and/or heroin. When compared to November’s findings, when 90% of all opioid-down samples checked contained an adulterant, these results may appear encouraging. However, when compared to the past year of data (Fig. 3), we can see that 68% of opioid-down samples being adulterated is par for the course in a consistently inconsistent down supply.
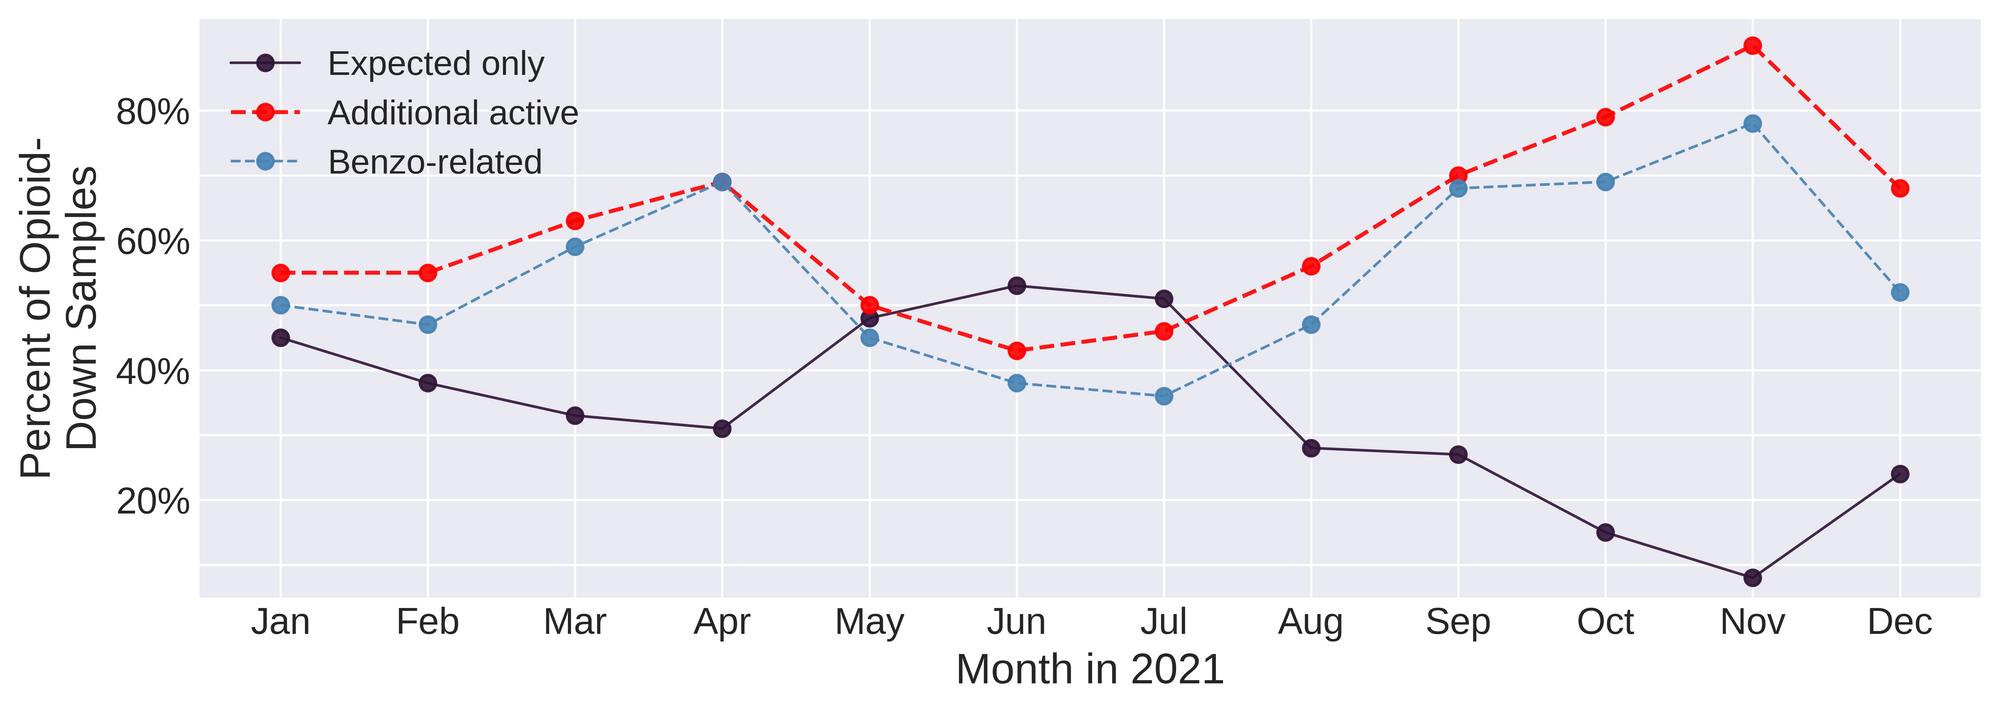
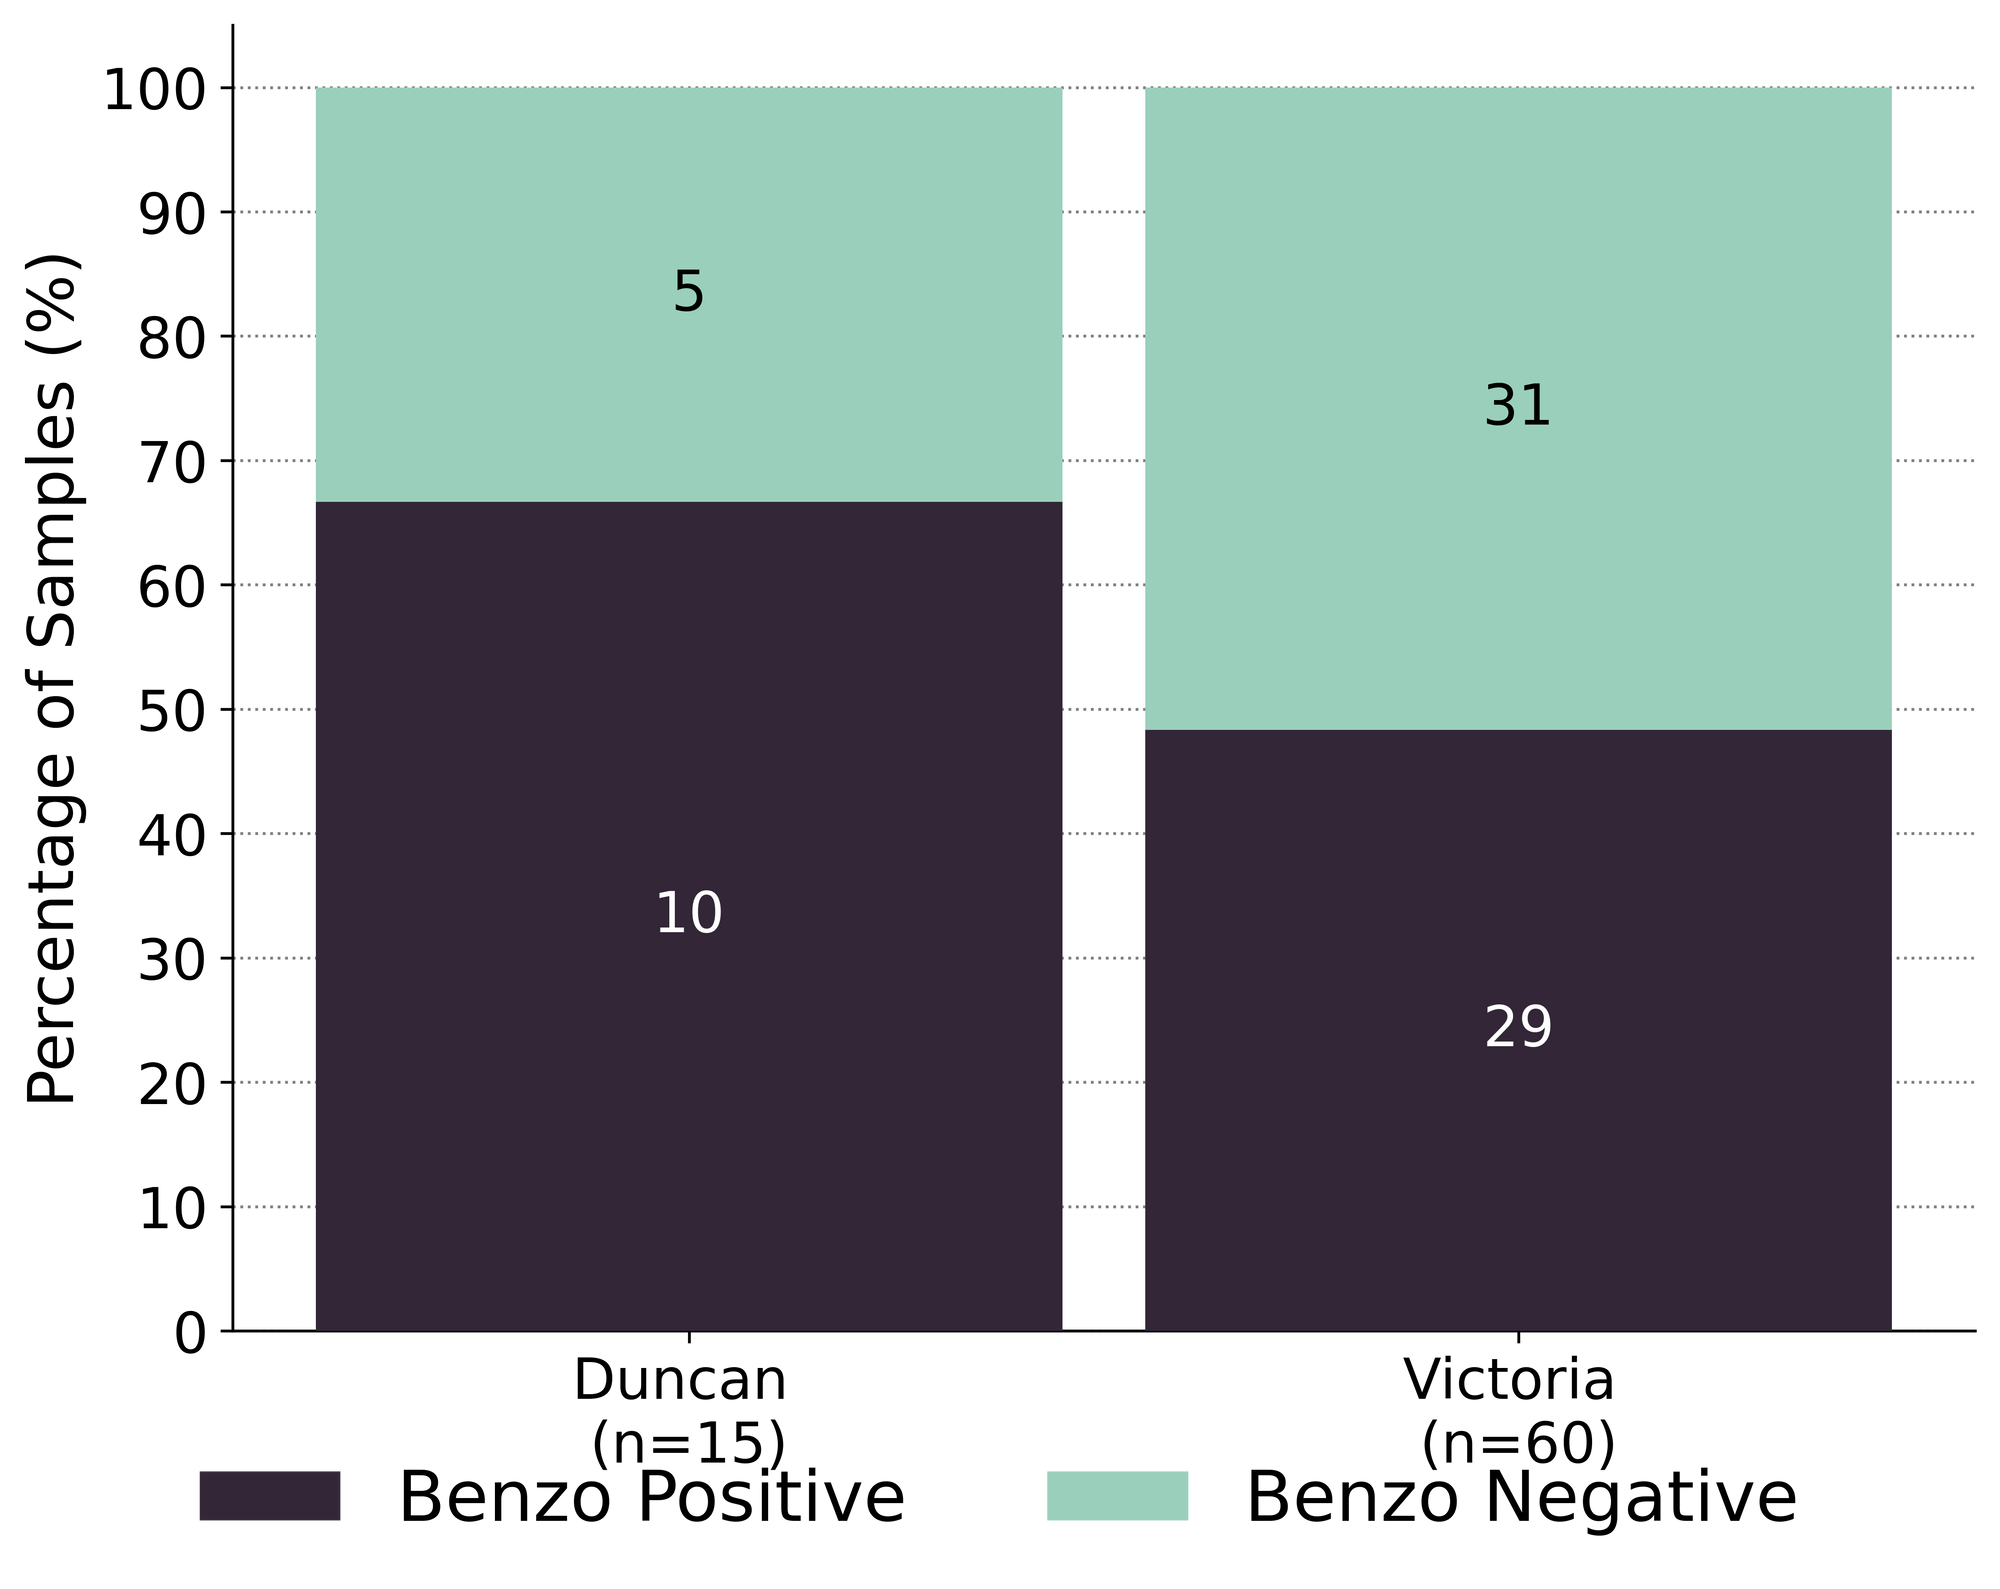
Benzo-related drugs remain the primary contributor to the additional actives found in expected opioid-down samples with 52% (39/75) of the total expected opioid-down samples checked containing a benzo-related drug. Fig. 4 illustrates the high percentage of benzo-specific adulterants found in opioid-down samples checked at the different service locations in December. “Benzo-dope” maintains its spot at the top as the dominant class within the opioid market right now. For more discussion on benzos and down, check out our blog post from earlier this month.
While we are grateful to be able to offer extended drug checking services across Vancouver Island as part of the UPHNS regulations, drug checking as a service on its own is severely insufficient to address the complications of a toxic drug supply. It is long past time we listen to people who use drugs who have been pointing to the remedies to this unregulated supply for years, with calls for safer supply and decriminalization as effective interventions in the unregulated market.
Quantification for Expected Opioid-Down [1]
In December, we quantified fentanyl for 63 of the opioid down samples containing fentanyl and found the median concentration to be 10.3%, with the average strength of fentanyl we normally see being around 10% as well. Though the median is a useful indicator, it doesn’t capture the volatility of fentanyl concentrations present in the opioid supply, as any one sample might be the lowest strength (0.1%) or the strongest (>80% ), nor does it reflect the variability in regional markets (see Fig. 5 below). Similarly, the concentration of etizolam was across the board in expected opioid down samples, ranging from 0.2% to >25%[2], with a median of 5.7%.
Not all opioid down samples brought to our service can be quantified. This is primarily due to too limited sample collected for our instruments to report a reliable mass percentage. Nevertheless, qualitative detection is still possible. ↩︎
For samples that contain more than 25% etizolam by weight, our mass spectrometer is presently unable to reproducibly assign a concentration due to the upper limits of the calibration methods currently adopted. ↩︎

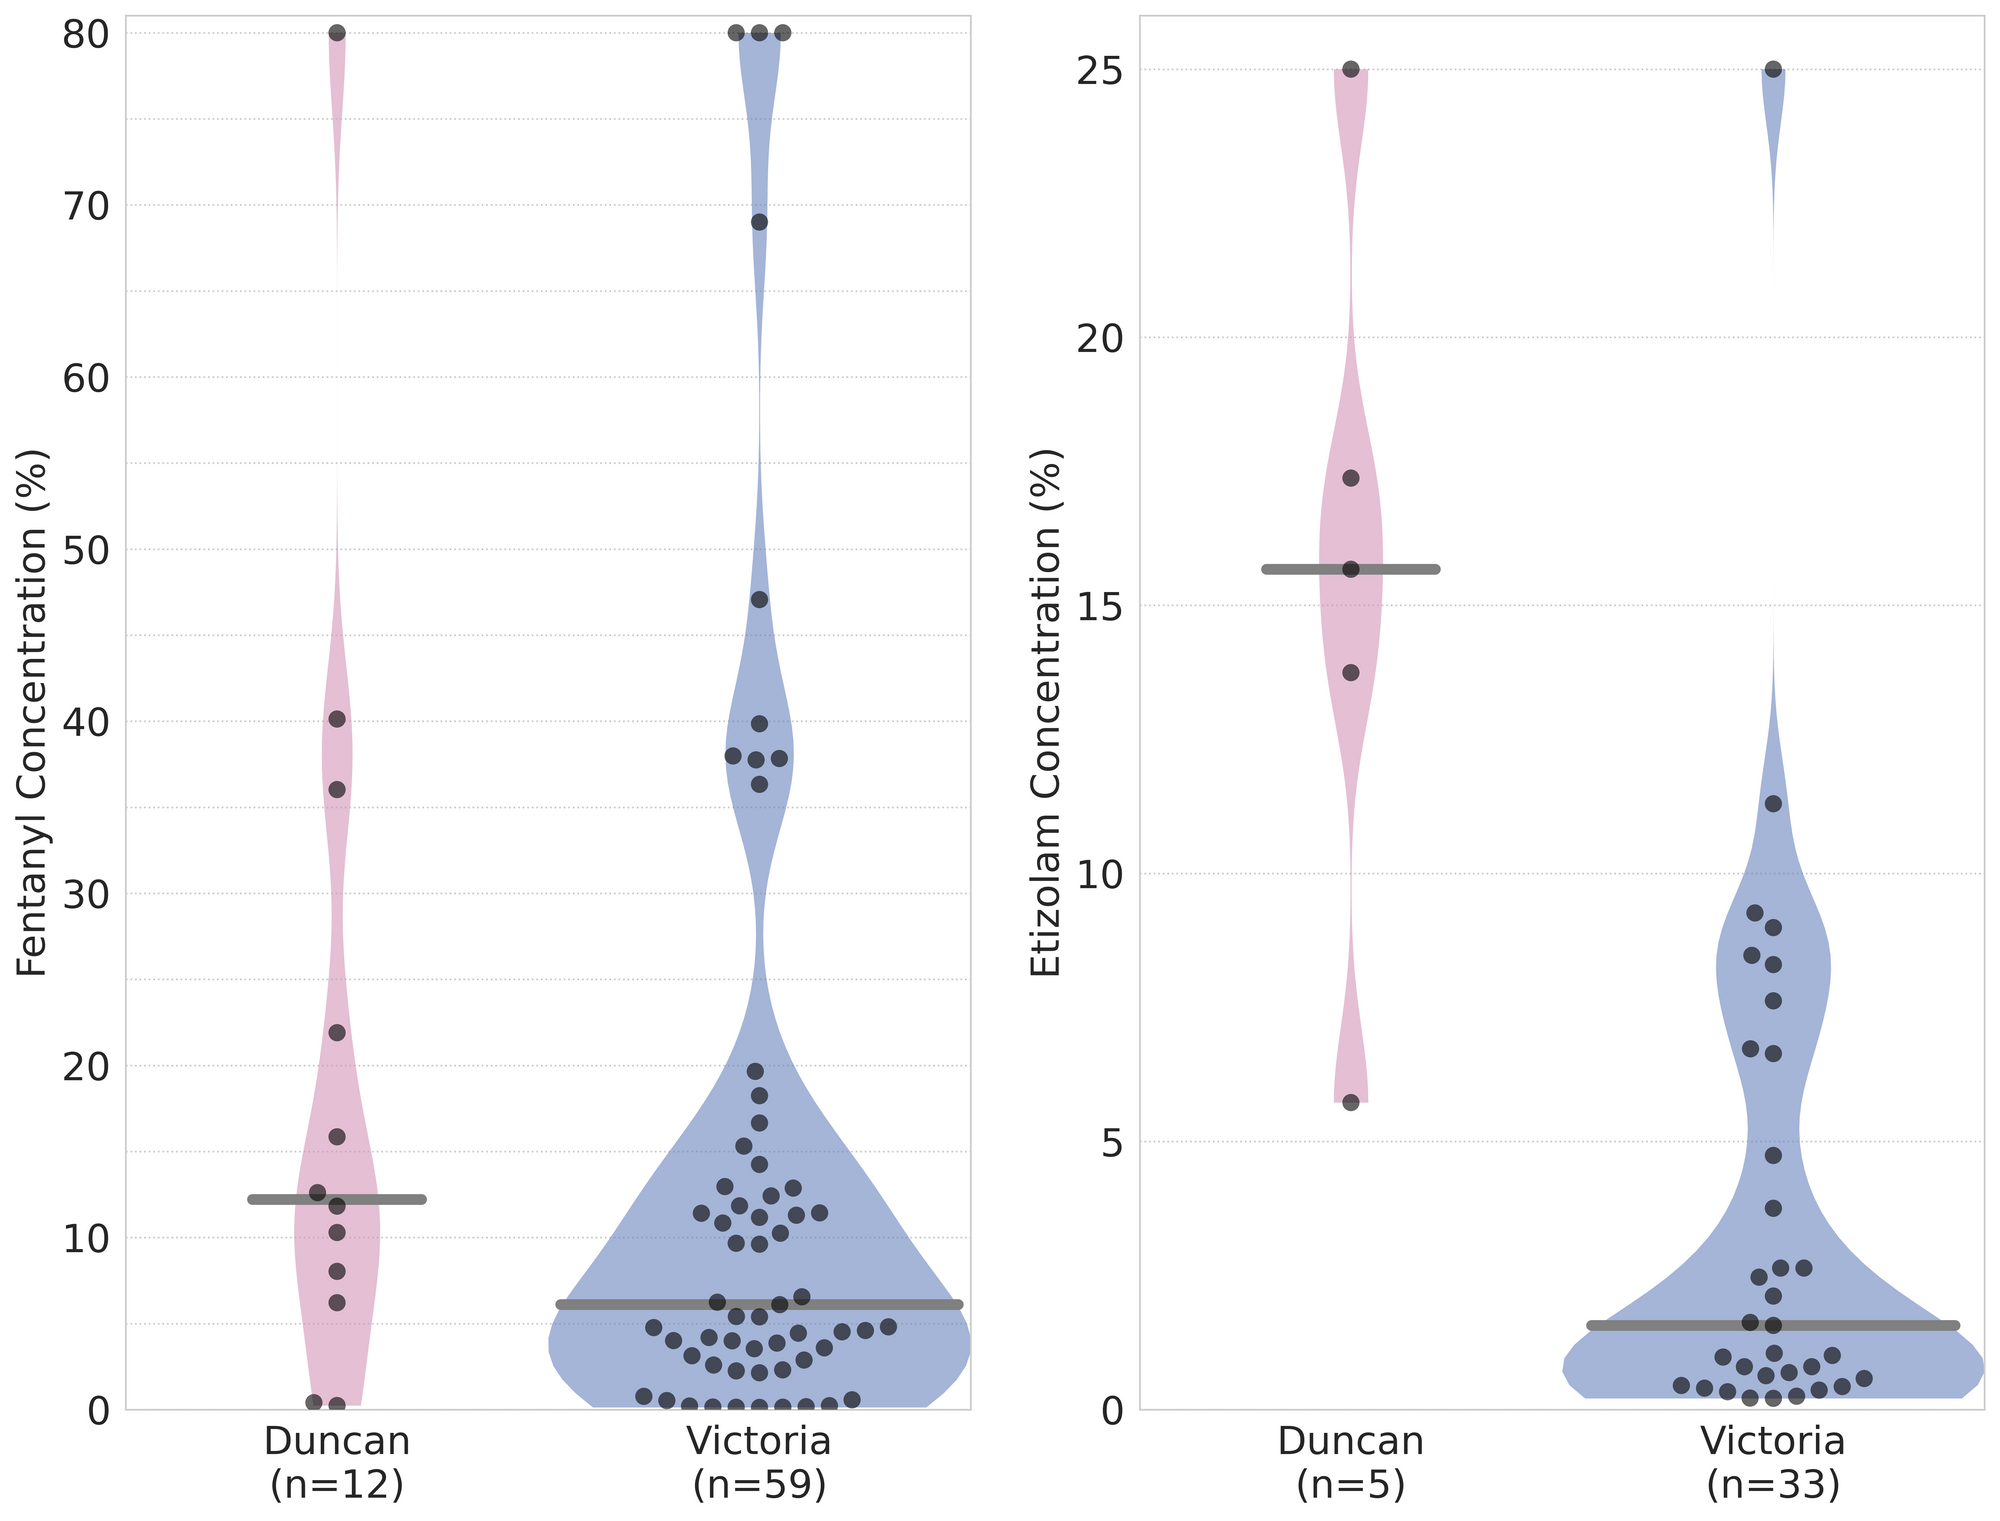
The fentanyl and etizolam concentrations that we quantified in down samples checked in December, by service location, are presented in Fig. 5. Black dots are individual opioid-down samples checked in each location, Horizontal grey bars show the median concentrations of fentanyl and etizolam quantified by location, the width of the shaded regions mirrors the number of samples at a given concentration. The November blog has some guiding examples on how to interpret these violin plots, but as a TL;DR, we can see that:
- Samples checked in both Victoria and Duncan had fentanyl concentrations ranging from 0.1% to >80%
- The median fentanyl concentration quantified in opioid-down samples collected in Duncan was 12%, compared to 6% for samples collected in Victoria
- The median etizolam concentration quantified in opioid-down samples collected in Duncan was 16%, compared to 2% for samples collected in Victoria
- Fewer total samples were checked in Duncan than in Victoria (due to one day of service in Duncan vs. a month in Victoria) which affects the comparative power of these statistics
Visualizing these volatile markets remains a challenge; if you think that non-standard uses for the violin should be left with Paganini or Ligeti and not with graphical data, or if there are data that you would like to see, let us know!
Want to be notified when we release these reports? Join our mailing list to receive updates about when our reports are out. You can subscribe and unsubscribe yourself from this list at any time.
Check back next month for the January report!
As always, send us feedback at substance@uvic.ca for how we can continue to offer our drug checking results in a useful way.