November 2021 Monthly Report

In this blog post we discuss our November 2021 report and provide more information on how to interpret the results. The PDF report can be found at the end.
Key findings:
- Carfentanil was found in three samples, all expected opioid-down
- 96% of expected opioid-down samples contained fentanyl
- Median fentanyl concentration found was 8.4%, with a maximum of 35.2%
- Benzodiazepines and/or etizolam found in 77.8% of expected opioid-down samples
- The maximum concentration of etizolam found was >25%, in an expected opioid-down sample
- Xylazine was detected in 13 opioid-down samples, with a maximum concentration of 12.5%
- Isotonitazene was detected in eight opioid-down samples, with a maximum concentration of 6.5%
Insight for the November 2021 Monthly Report
If you were reading a previous monthly report right now, this is the location within the blog where we would state something like “259 samples were checked in November, a 166% increase from November 2020,” but considering it is roughly same story each month, that service has continued to be busy, let us skip that little statistic and share some other news:
Amidst the ongoing overdose crisis in British Columbia, the Province of BC enacted enabling legislation to authorize both substance collection and drug checking sites under the authority of Health Canada’s Urgent Public Needs Sites (UPHNS) regulation. The UPHNS process allows provinces to facilitate the establishment of overdose prevention and drug checking services without the cumbersome process of section 56(1) exemptions. With UPHNS regulations in our pocket and a highway only marginally inundated by post atmospheric river flooding and sinkholes, the Vancouver Island Drug Checking Project took a trip up island in November to facilitate a scale-up of services across the Island Health Authority region in response to increased demand for such services.
The trip covered three critical regions on the Island: Port Alberni, Campbell River and the Comox Valley. At each location, we set up for a day of pop-up drug checking at OPS sites and Community Services centers and were overjoyed with the incredible uptake in service by the folks in those communities. We were ecstatic to establish new relationships, strengthen existing partnerships, collaborate with regional partners, and showcase our drug checking technologies to explore and inform the implementation of a regional drug checking program. We are grateful to Island Health for providing the site exemptions and being so enthusiastically supportive about this enabling process of distributed drug checking.
The data presented in this blog post are a smörgåsbord of results specific to individual service regions (i.e. Port Alberni, Campbell River, Comox Valley, Victoria) in addition to aggregate results for Vancouver Island overall.
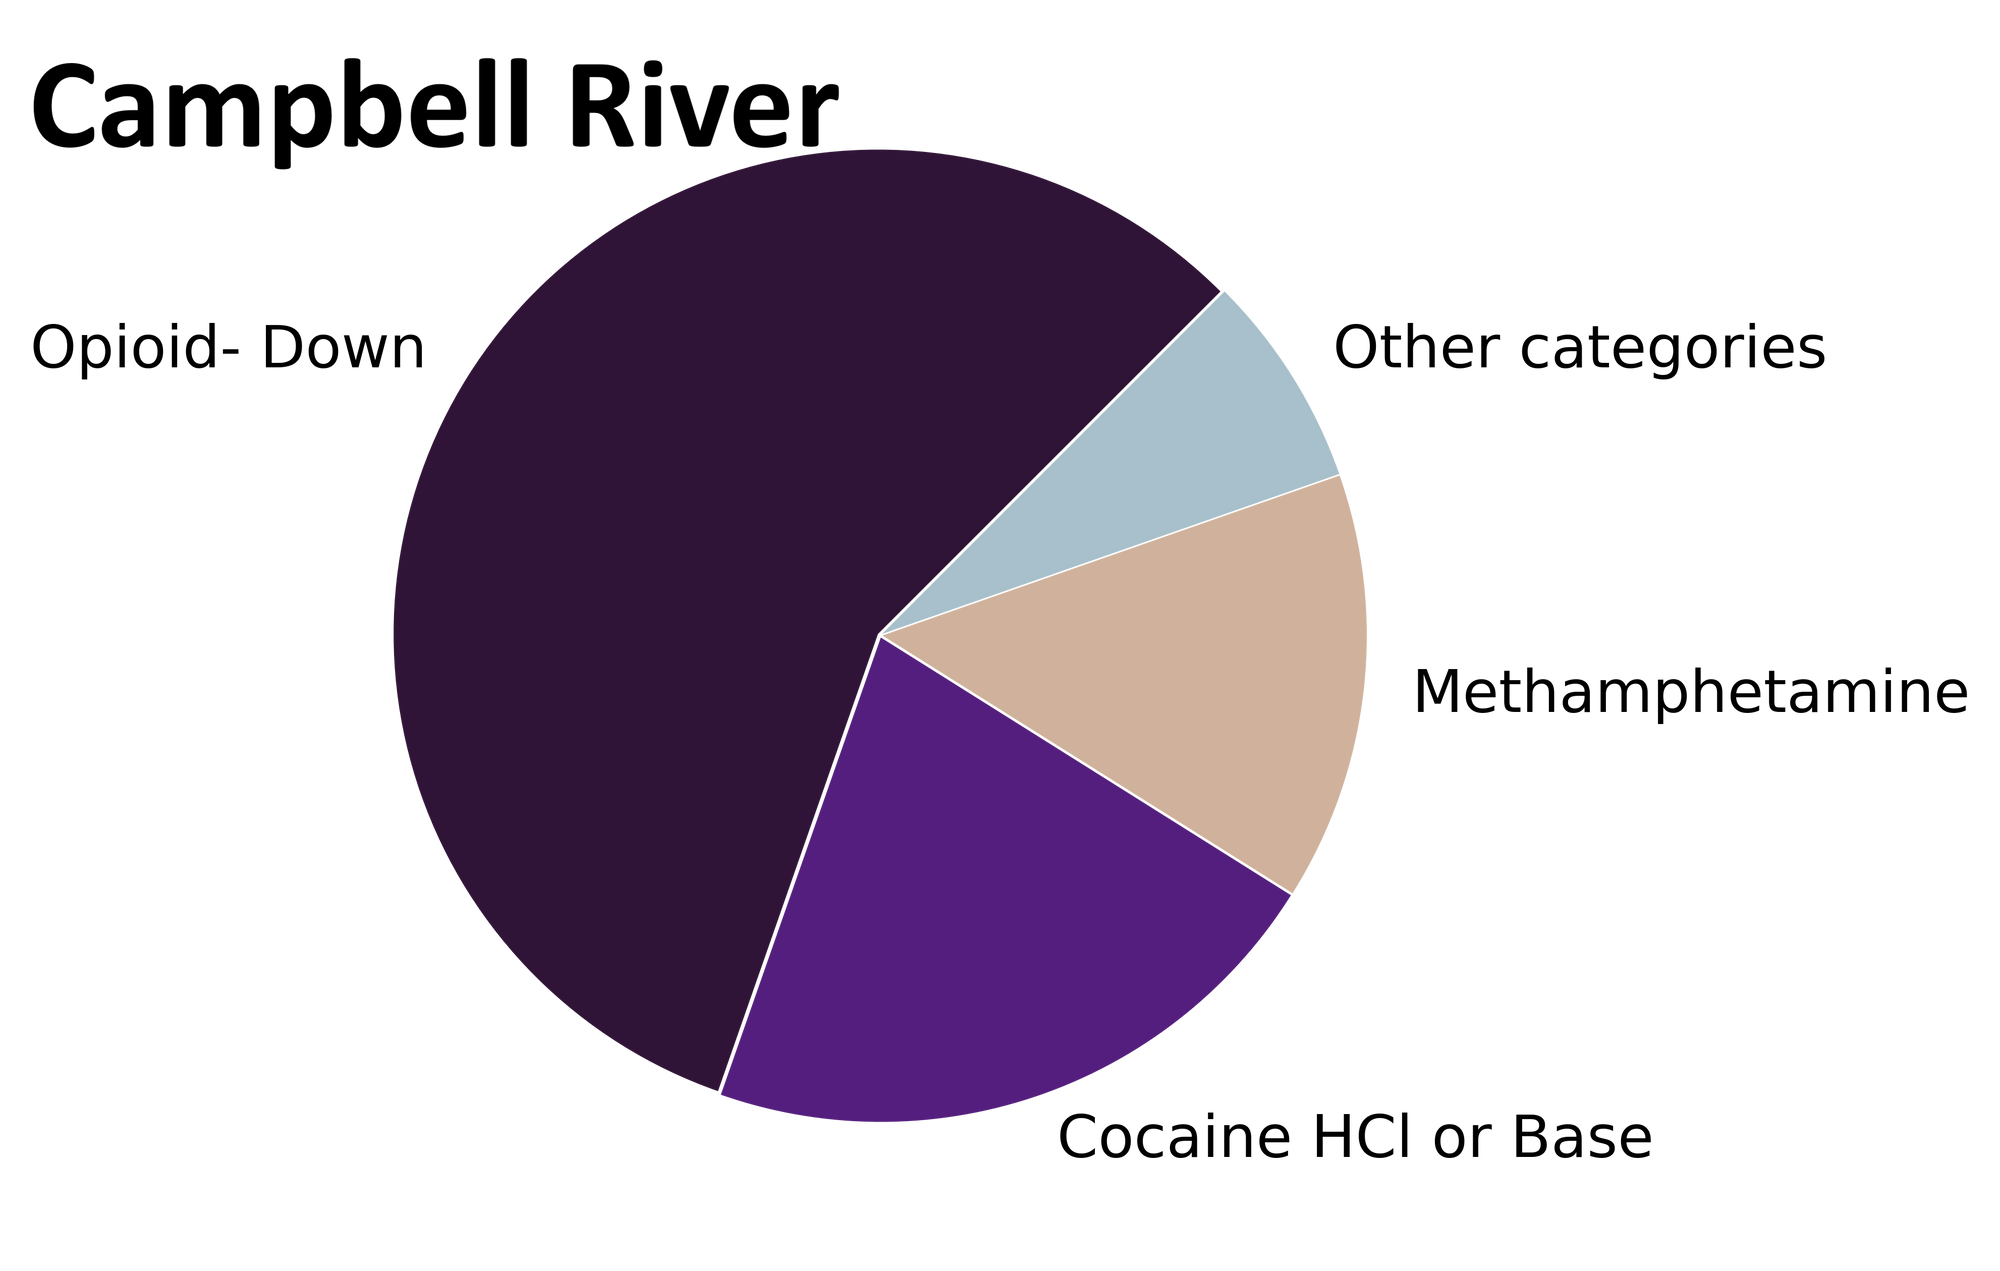
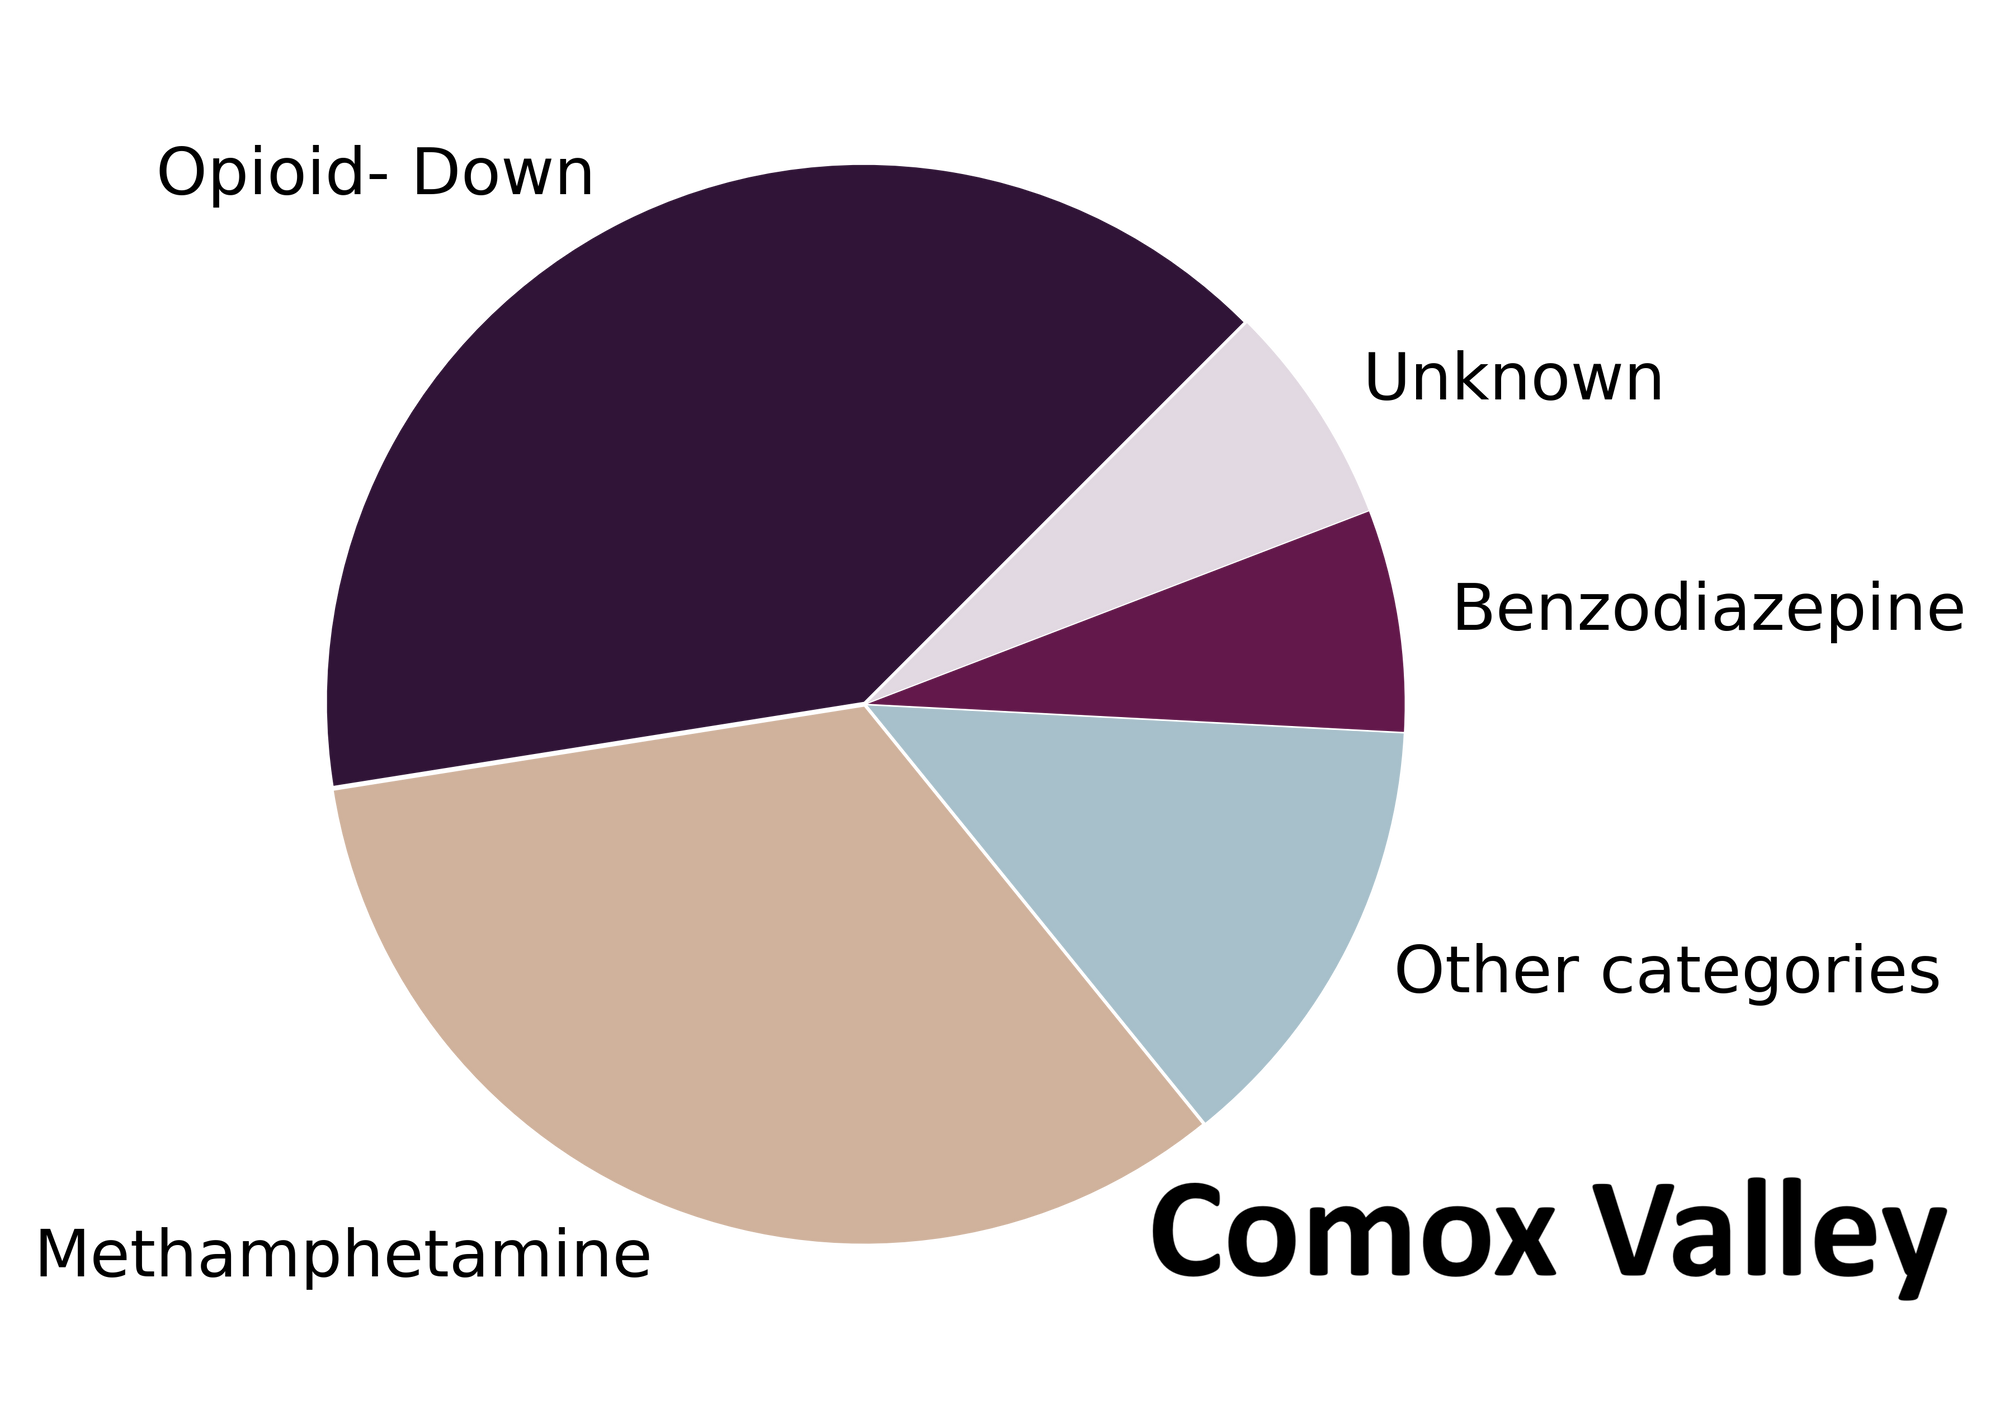
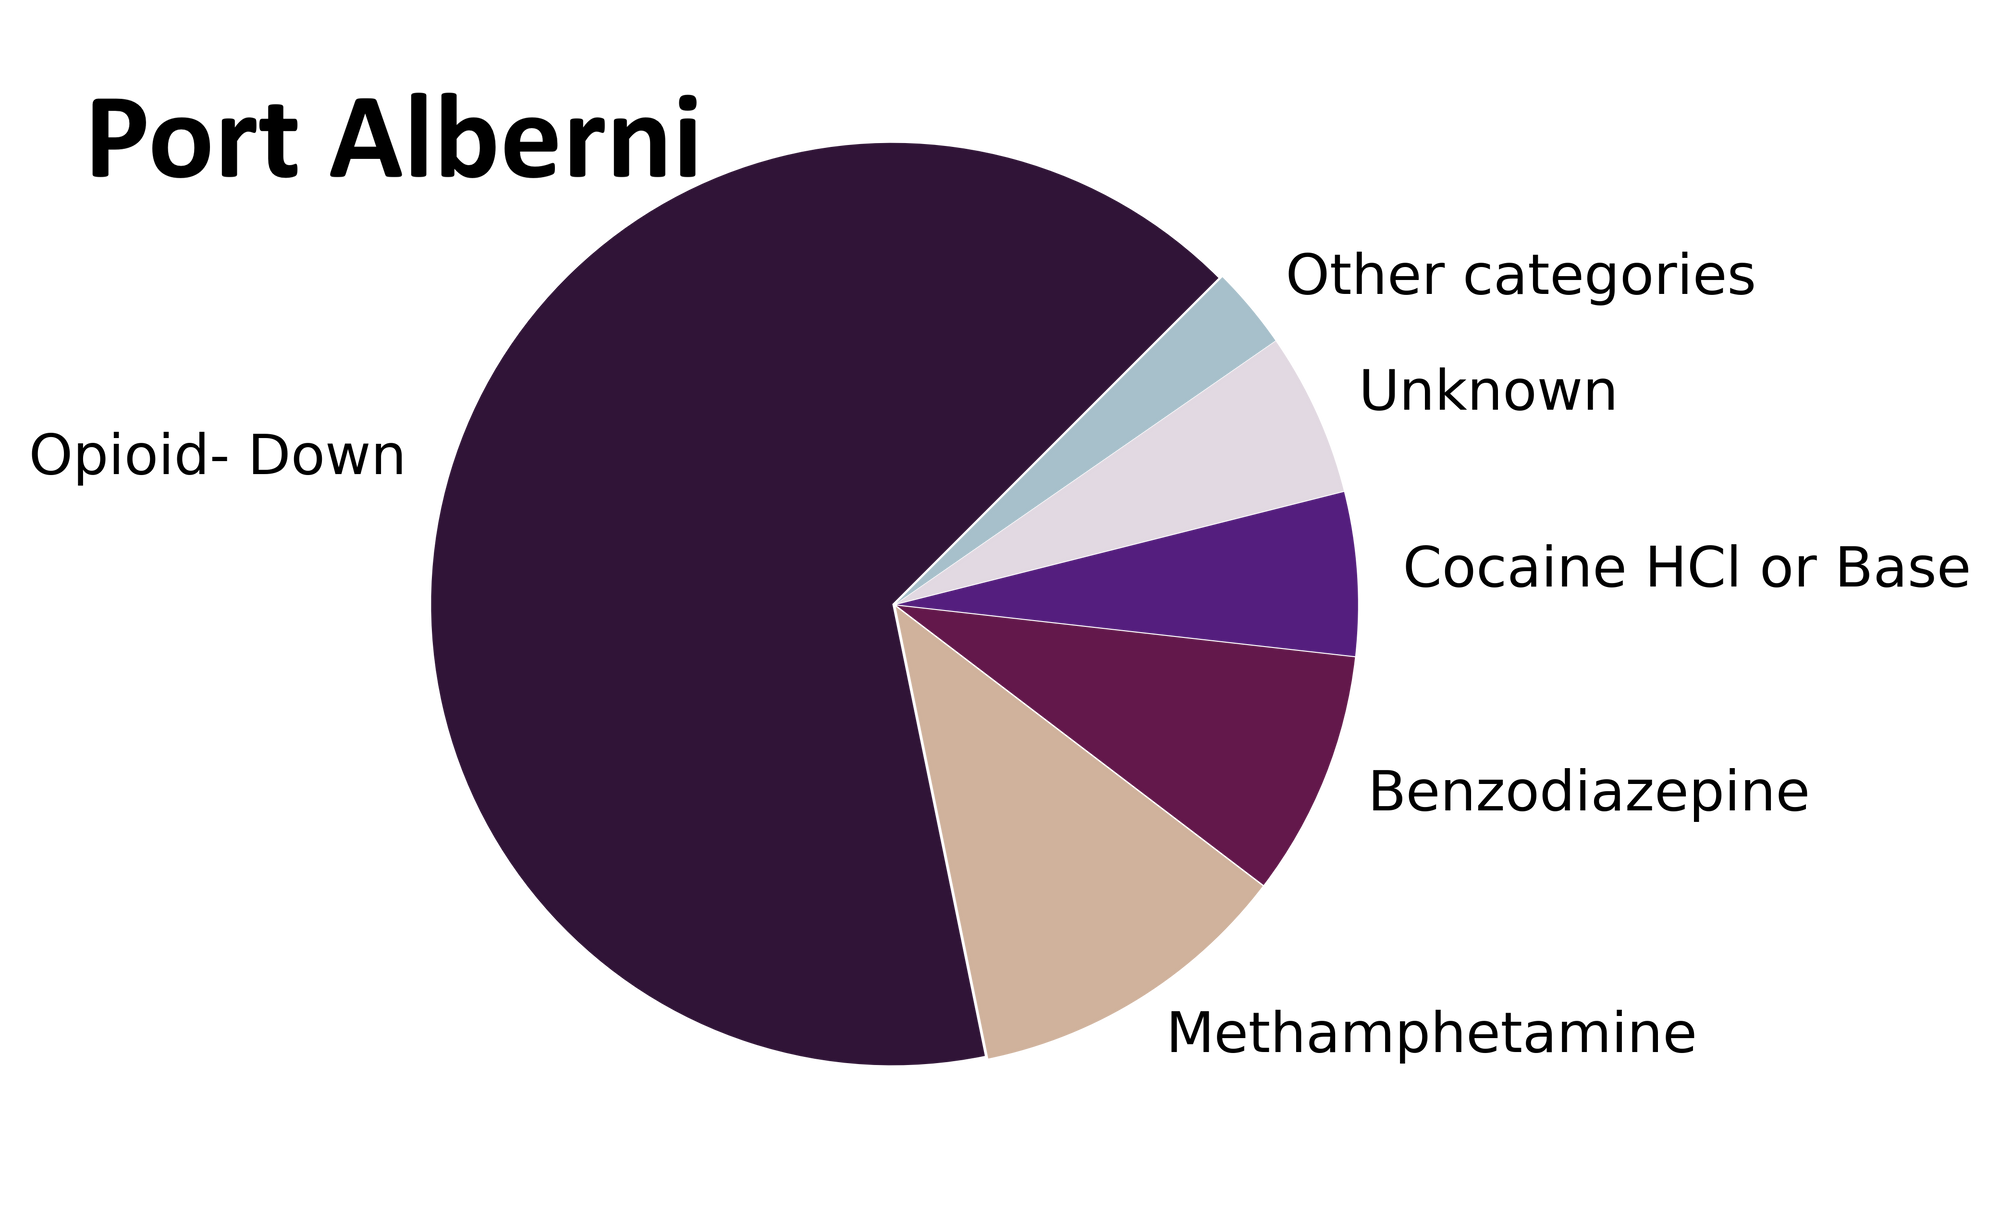
Drug types
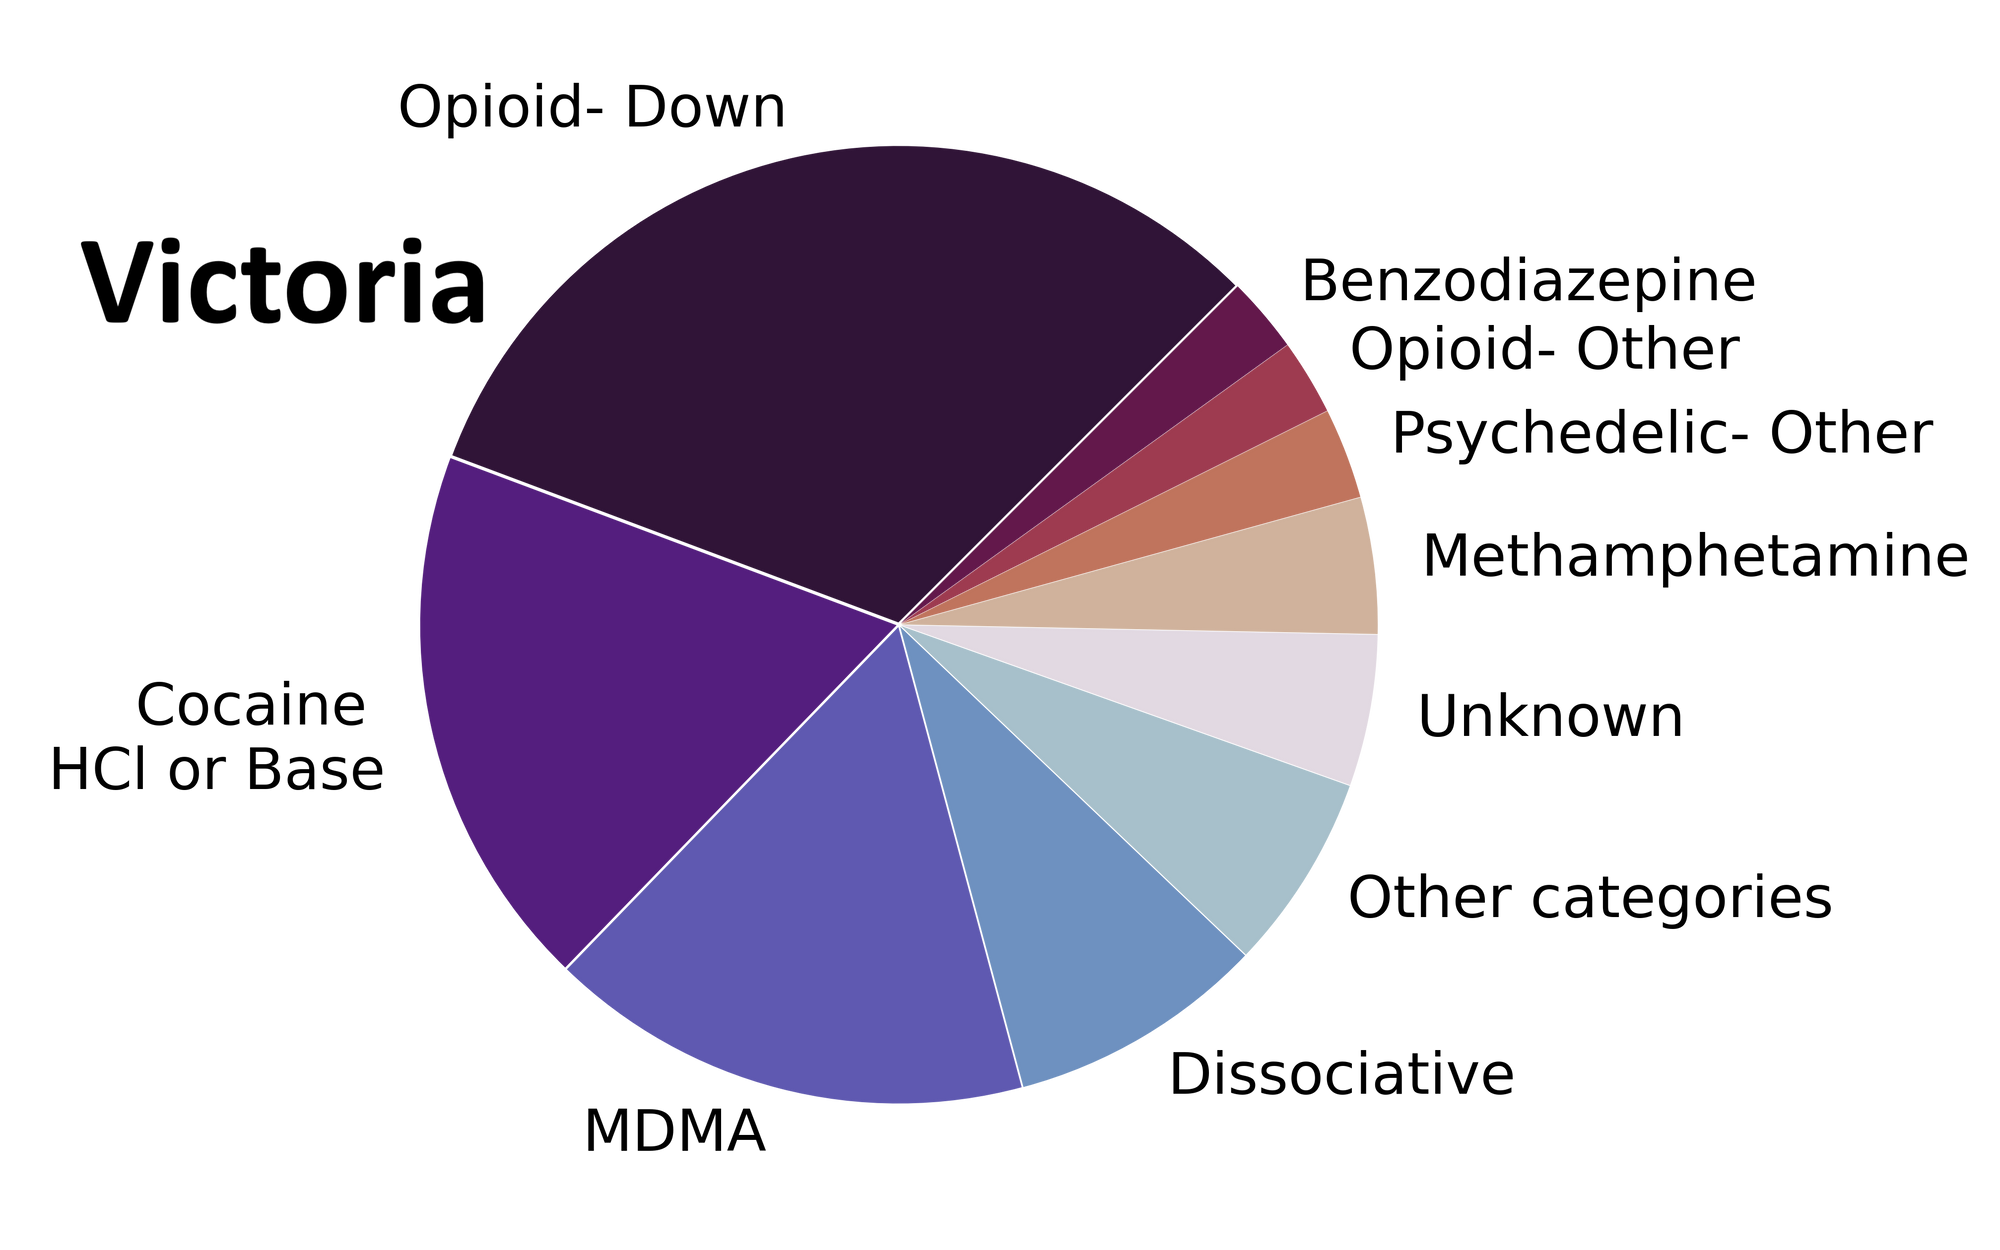
In November, we checked a variety of substances ranging from bodacious benzo-dope, to animative amphetamines, to detethering dissociatives. Fig. 1 shows the prevalence of each expected drug category checked at each service location. For the bureaucrats whose substance of choice is tabular data, these same results are tabulated below.

Noxious narcotics in November? Not quite.
For most samples, we confirm that the expected drug was indeed the only expected active and that no additional cutting agents were present. The bar charts below highlight a few classes of drugs, differentiating samples when only the expected active was found from situations when other unexpected components were detected.
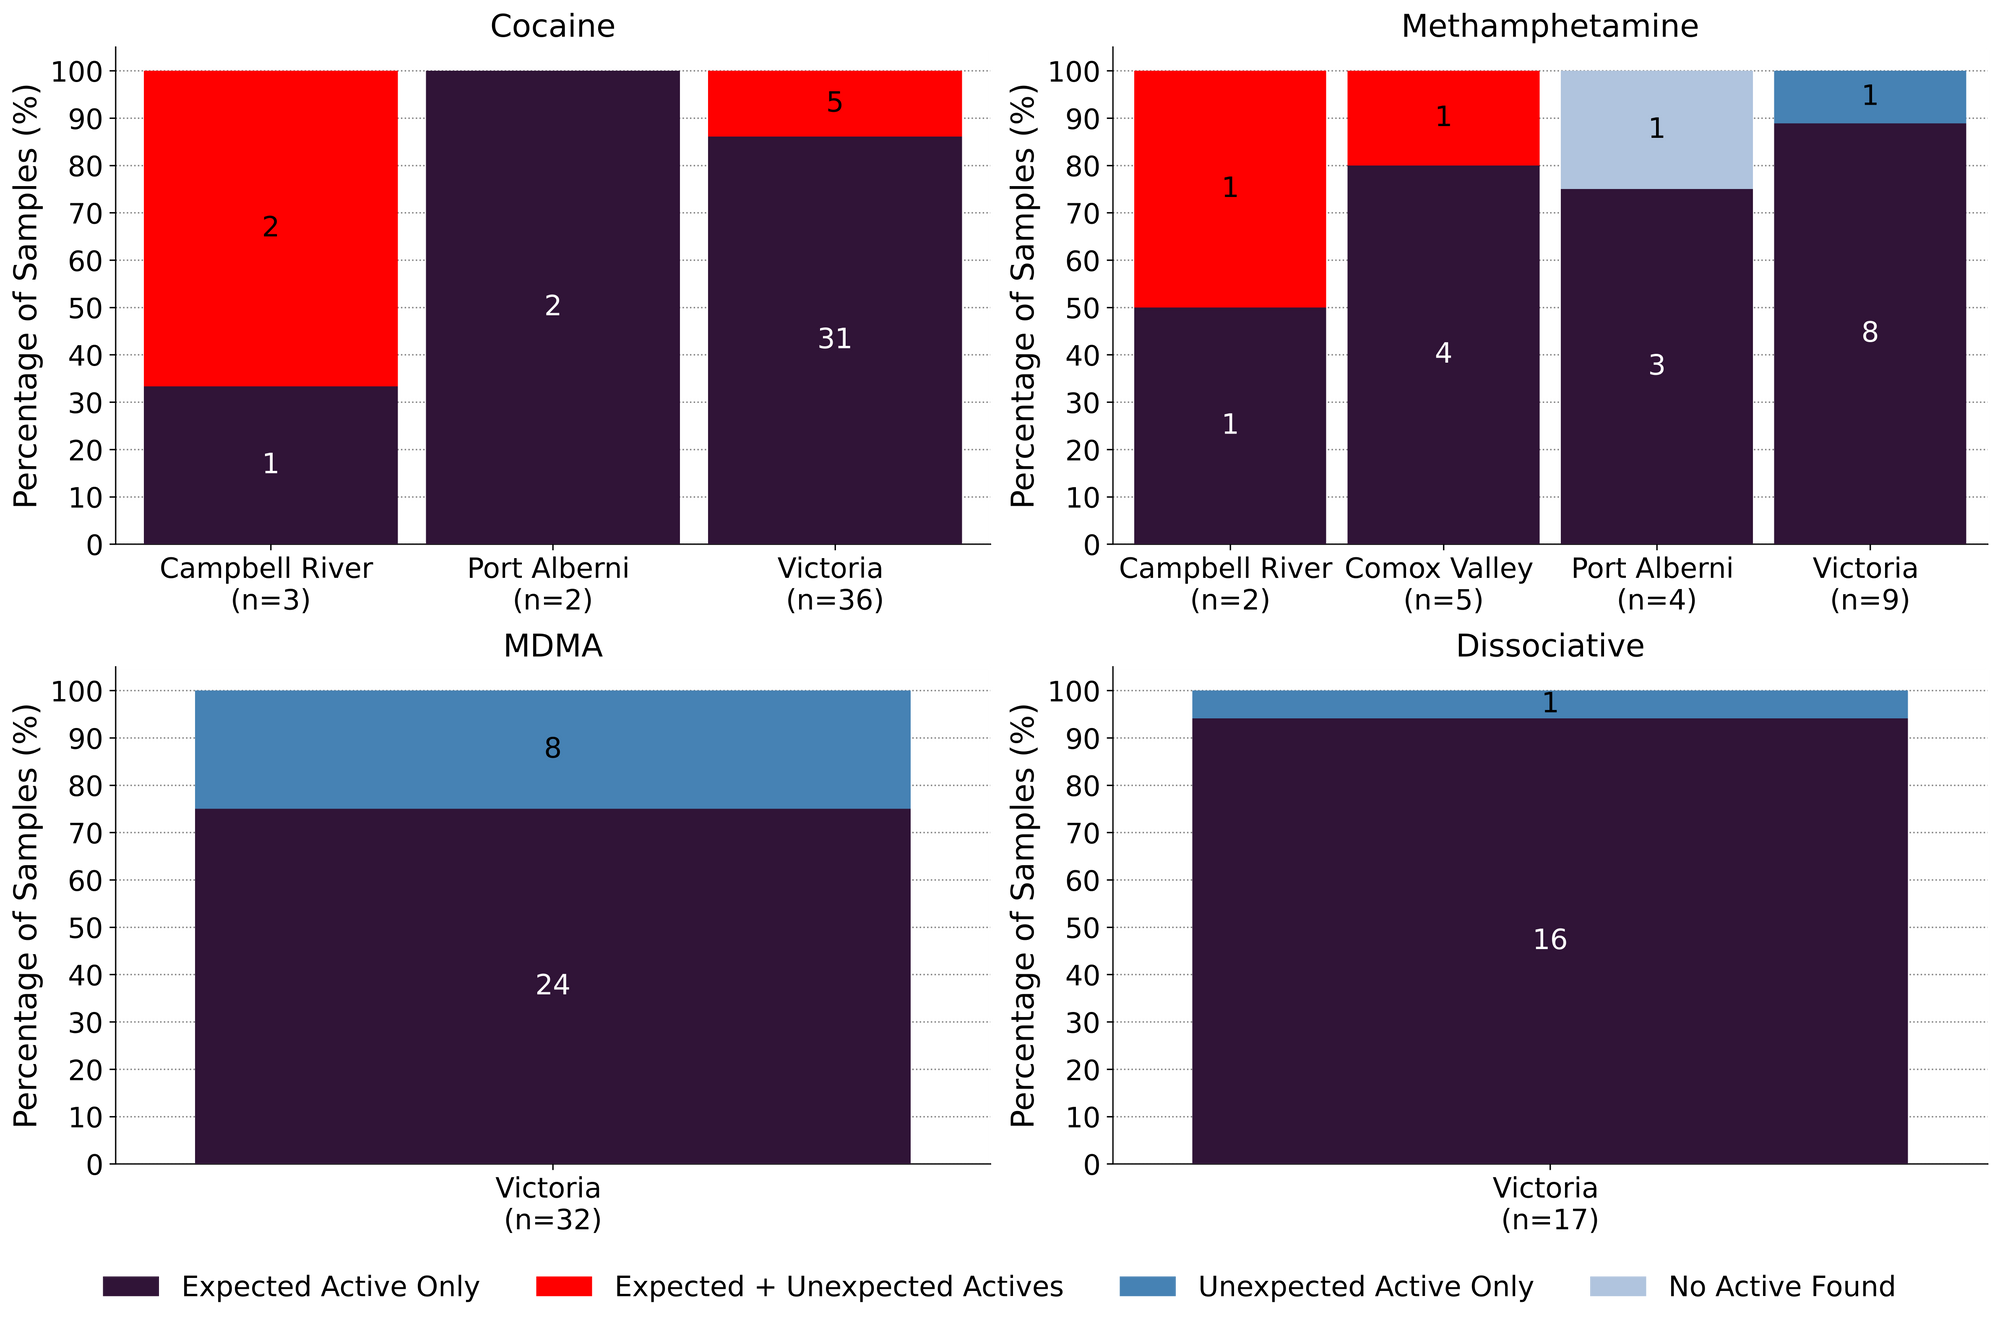
41 expected cocaine samples were checked in November across all locations. 83% were found to only contain cocaine (or cocaine base) as a single ingredient. The remaining seven samples contained the following buffs: levamisole (three samples; an antihelminthic drug commonly seen as a cut in cocaine) and phenacetin (five sample; an acetaminophen-like drug, also a commonly seen cut in cocaine).
If only it were so easy to keep saying “meth is meth!”, but November’s results require a little more conversation. Of the 20 meth samples checked in November, 80% (16 samples) were meth as a single ingredient, no cuts or adulterants detected. In the remaining four samples, we found: one sample with no active drugs detected, one sample containing diphenhydramine (Benadryl) as a single ingredient, one sample containing methamphetamine and trace fentanyl, and one sample containing meth and trace fentanyl, trace etizolam, and trace xylazine. For the latter two samples, we believe the detection of fentanyl, etizolam, and xylazine was the result of baggy cross-contamination and mixed substance storage.
75% (24/32) of the expected MDA/MDMA samples checked were found to be MDA/MDMA as a single ingredient. The remaining eight samples were mistaken MDsomething doppelgangers: 7 expected MDMA samples were found to contain just MDA, and one expected MDA sample was found to be MDMA. All MDA/MDMA samples were collected in Victoria.
Spotlight Sample 1
Posessed by the friendly spirit of Alexander Shulgin, and in a mood for "doing science", you pop a pill of what you think is 2C-B, only to find the visuals are less psychedelic than expected and the feels are little more warm and fuzzy. Novel notes in November; an expected 2C-B sample was instead found to be MDMA as a single ingredient. Dr. Shulgin would likely still approve of your purely scientific studies.
Ketamine was found as the only active in 93% (13/14) ketamine samples checked. The remaining one sample was found to be a mixture of acetaminophen and N-ethylpentalone (“bath salts”, a substituted cathinone with stimulating and entactogenic effects).
Benzodiazepines (n=9)
Nine samples were brought to our service sites that were expected to be a benzodiazepine as a single ingredient; primarily in the form of pressed tablets. Five expected alprazolam (Xanax) tablets were found to contain no alprazolam but other unexpected components: three were found to be etizolam, one sample was only identified as benzo-postive via the benzodiazepine immunoassay strip test, and one sample did not contain any identifiable actives. An expected clonazepam sample in Victoria was found to be clonazepam as a single active ingredient and two white powder samples (with a benzo identity unknown to the service user) were found to be etizolam. The remaining sample did not contain any identifiable actives (see Spotlight Sample 2 below).
Spotlight Sample 2
Starting “slow and low” is the way to go when sampling a new score, especially when the substance is a non-descript mason jar full of clear liquid expected to be etizolam. Many hours pass by and still no effect? Same story a few doses later? Maybe worth asking the folks at Substance what’s up. Turns out the service user was flying slow and low to better hydration; just water found in this sample.
Opioid-Down (n=99)
In this section we present statistics specific to the opioid-down supply, therefore they may differ from the highlighted findings above that are inclusive of all expected drug categories.
- 96% of expected opioid-down samples, across all sites, contained fentanyl (95/99)
- Three samples contained carfentanil in the month of November; two found in Victoria, and one in Port Alberni
- 78% of samples contained a benzo and/or etizolam (77/99)
- Xylazine was detected in 13 samples, with a maximum concentration of 12.5%
- Isotonitazene was detected in eight opioid-down samples, with a maximum concentration of 6.5%
This November, 90% of all opioid-down samples checked contained an additional active to the expected fentanyl and/or heroin, with benzo-related drugs being the major contributor. Other contributors included other fentanyl analogues (most notably fluorofentanyl; 21 samples), xylazine (a sedative used in veterinary medicine), and isotonitazene (a synthetic opioid).
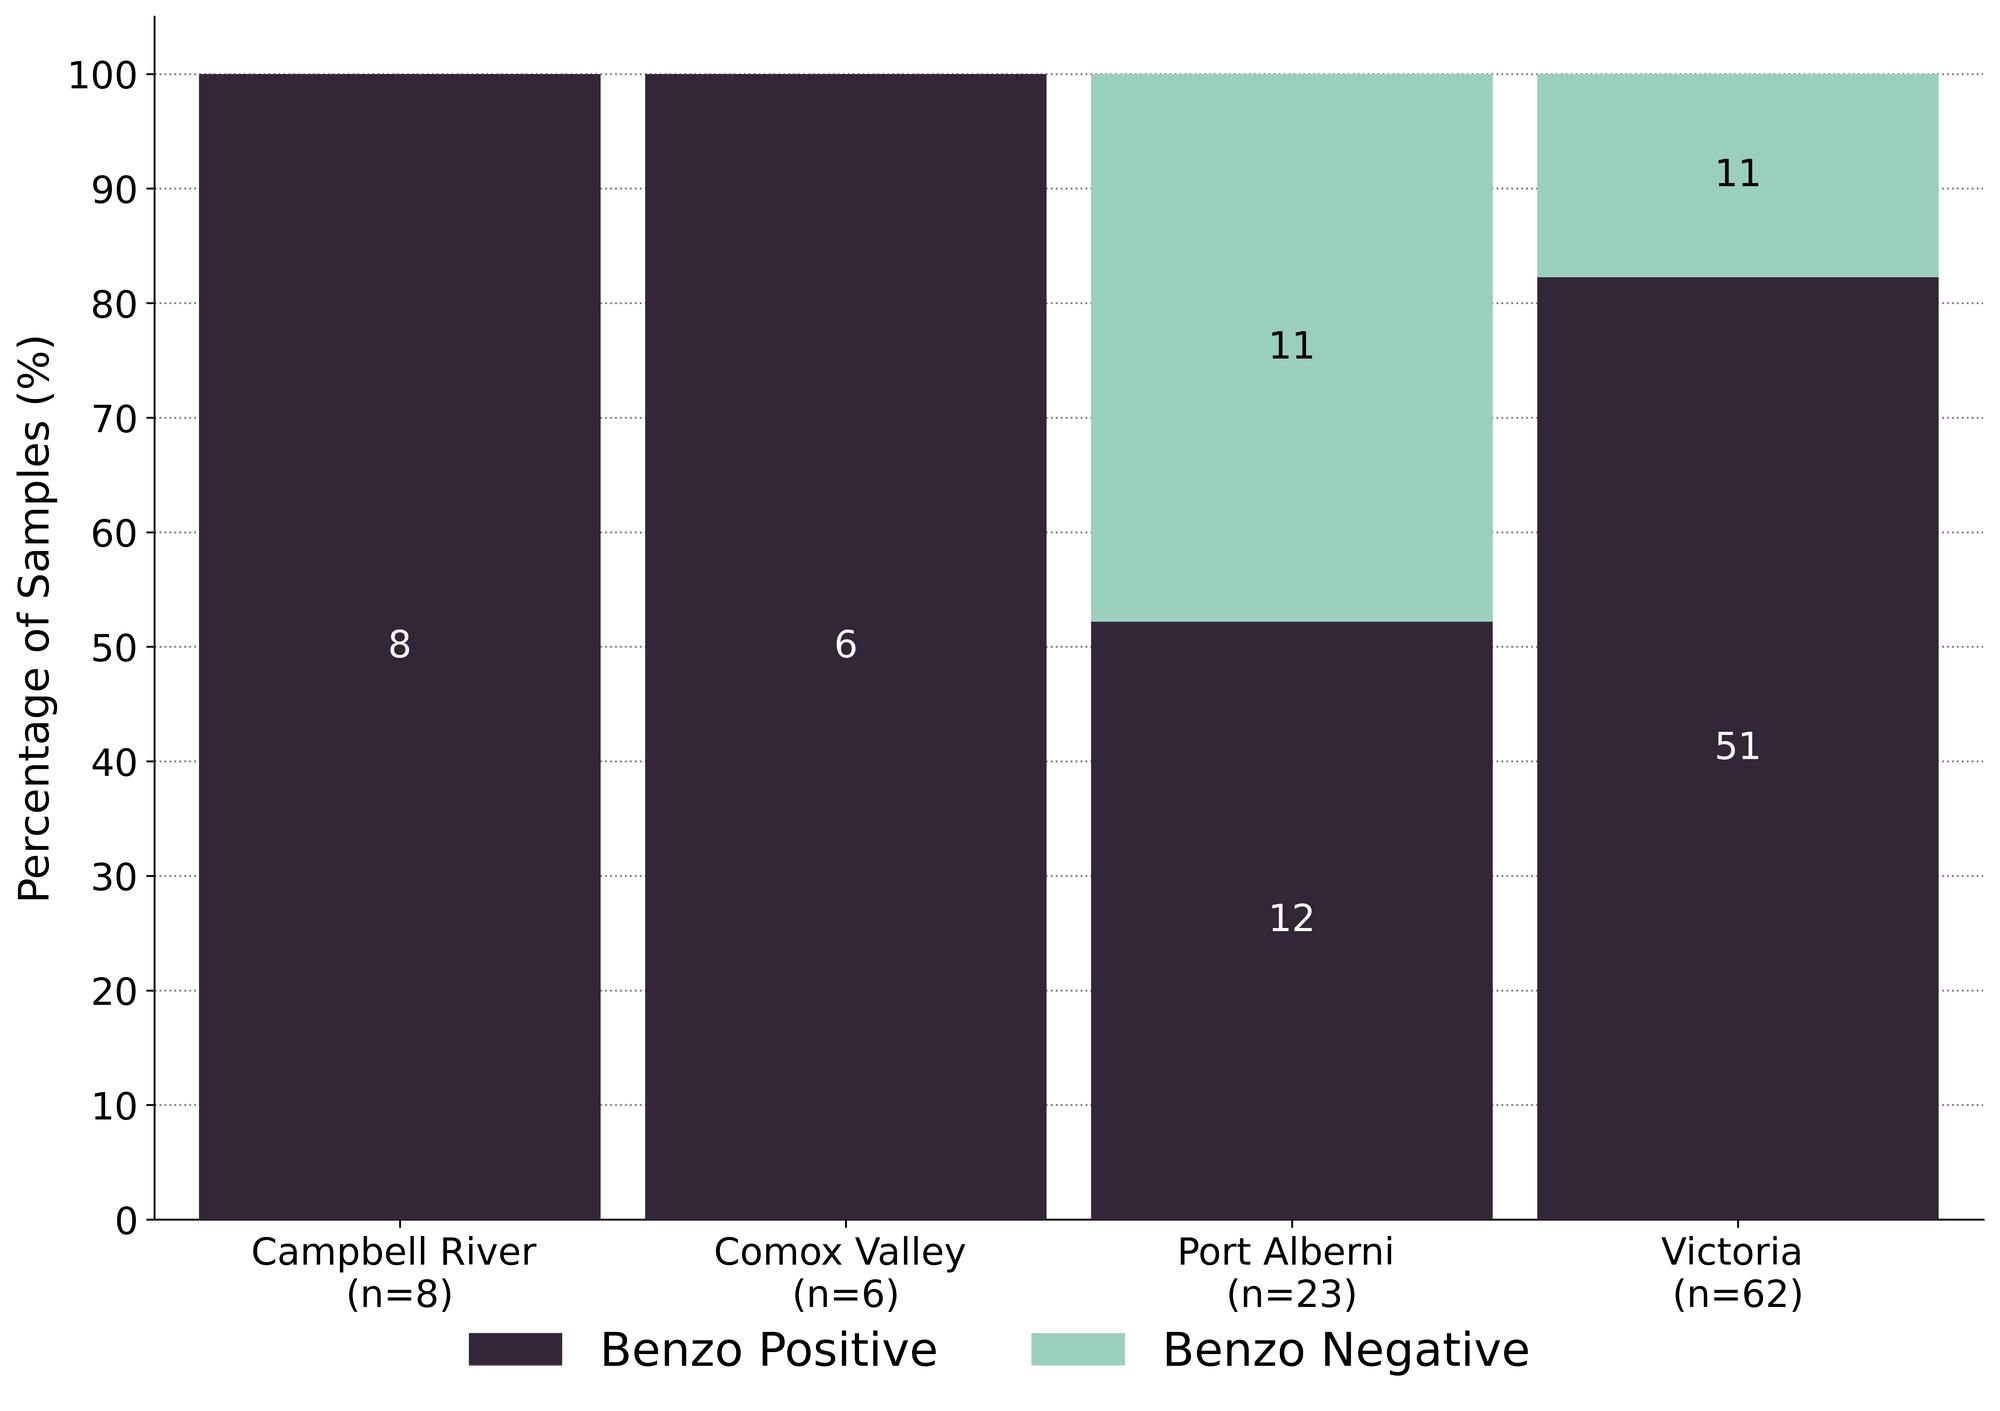
Fig. 3 illustrates the high percentage of benzo-specific adulterants found in opioid-down samples checked at the different service locations in November. These results clearly illuminate the current status of “benzo-dope” being the dominant class within the opioid market right now, a combination that carries complex health considerations and overdose response measures.
While we are grateful to be able to offer extended drug checking services across Vancouver Island as part of the UPHNS regulations, drug checking as a service on its own is severely insufficient to address the complications of a toxic drug supply. It is long past time we listen to people who use drugs who have been pointing to the remedies to this unregulated supply for years, with calls for safer supply and decriminalization as effective interventions in the unregulated market.
Quantification for Expected Opioid-Down [1]
In November, we quantified fentanyl for 97 of the opioid down samples containing fentanyl and found the median concentration to be 8.4%, with the average strength of fentanyl we normally see being around 10% as well. Though the median is a useful indicator, it doesn’t capture the volatility of fentanyl concentrations present in the opioid supply, as any one sample might be the lowest strength (0.1%) or the strongest (35%), nor does it reflect the variability in regional markets (see Fig. 5 below). Similarly, the concentration of etizolam was across the board in expected opioid down samples, ranging from 0.2% to >25%[2], with a median of 3.2%.
Not all opioid down samples brought to our service can be quantified. This is primarily due to too limited sample collected for our instruments to report a reliable mass percentage. Nevertheless, qualitative detection is still possible. ↩︎
For samples that contain more than 25% etizolam by weight, our mass spectrometer is presently unable to reproducibly assign a concentration due to the upper limits of the calibration methods currently adopted. ↩︎

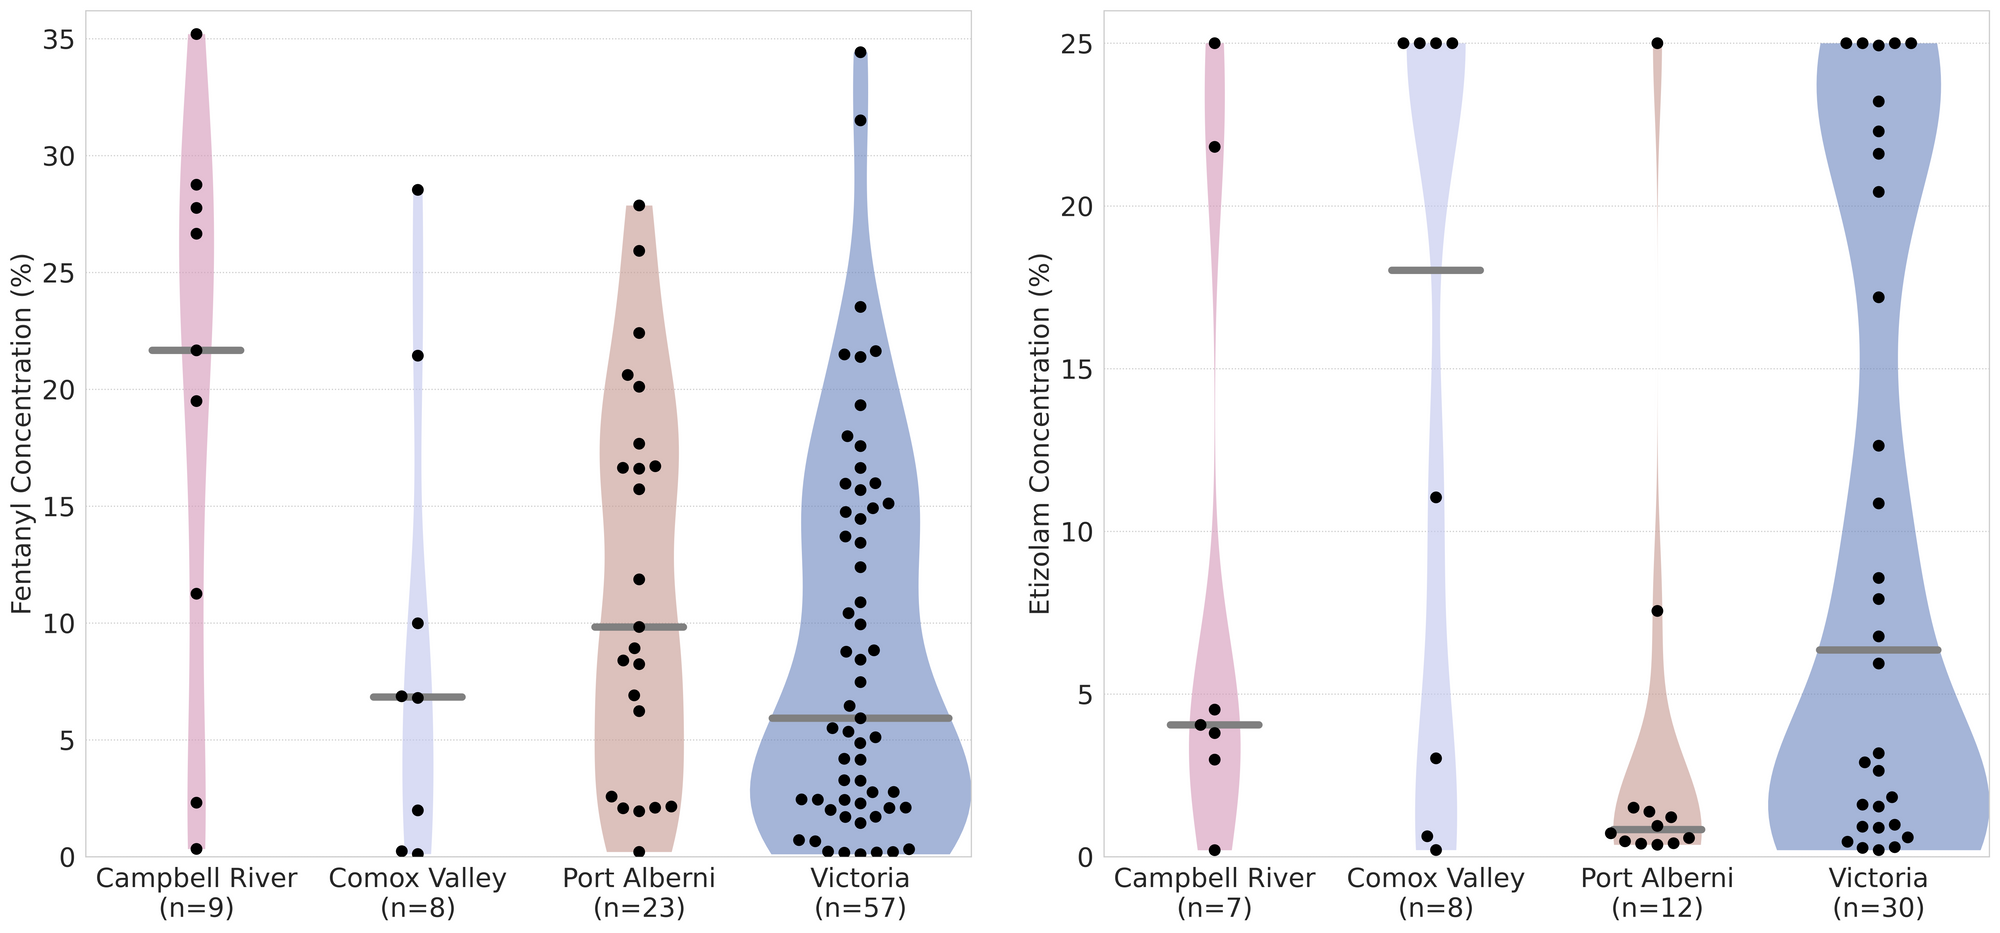
Fig. 5 demonstrates the spread of fentanyl and etizolam concentrations we found in November by service location. Don’t let the funky stylings freak you out, we’ll work through this together (with some examples):
- Black dots are individual opioid-down samples checked in each location
- Example: more fentanyl positive samples were checked in Victoria (57 fentanyl samples) than in the Campbell River (9 samples), which shouldn’t be a surprise considering only one day of pop-up service was run in Campbell River, as opposed to a full month of service in Victoria.
- Horizontal grey bars show the median concentrations of fentanyl and etizolam quantified by location
- Example: The median etizolam concentration quantified in the Comox Valley was 18%, well above the median seen in the other three service locations (4%, 0.8%, and 6% for Campbell River, Port Alberni, and Victoria, respectively)
- The width of the shaded regions mirrors the number of samples at a given concentration
- Example: A majority of the etizolam positive samples checked in Port Alberni were low concentration, whereas in Victoria, the distribution of etizolam concentrations was more continuous, with clusters of samples at both ends of the concentration range.
Clear as mud, right? Pencil "volatility visualization" down as complication #740,924,854 associated with an unregulated opioid market.
Want to be notified when we release these reports? Join our mailing list to receive updates about when our reports are out. You can subscribe and unsubscribe yourself from this list at any time.
Check back next month for the December report!
As always, send us feedback at substance@uvic.ca for how we can continue to offer our drug checking results in a useful way.