July 2021 Monthly Report

In this blog post we discuss our July 2021 report and provide more information on how to interpret the results. The PDF report can be found at the end.
Key findings:
- Carfentanil found in four samples expected to be opioid-down.
- Overall median fentanyl concentration of 7.1%, with a maximum concentration of 52.0% found in an expected opioid-down sample.
- Overall median etizolam concentration of 1.8%, with a maximum concentration of 13.1% found in an unknown sample.
- Benzodiazepines and/or etizolam found in 36% of expected opioid-down samples, which is 2% lower than the previous month.
- Benzylpiperazine found in an expected MDMA sample.
Insight for the July 2021 Monthly Report
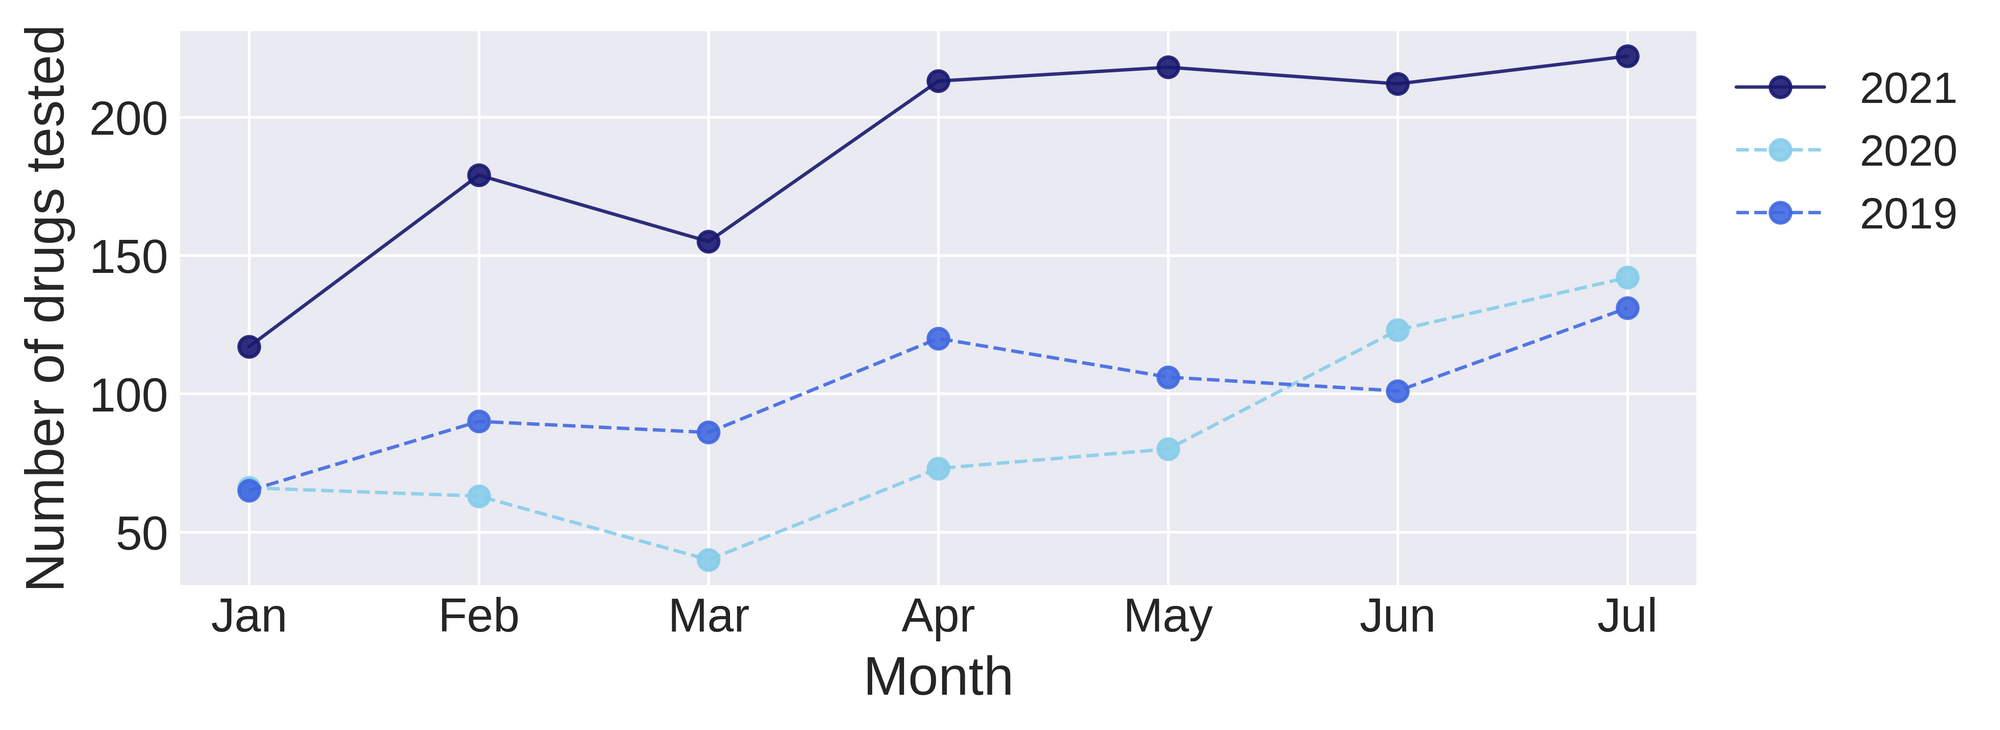
We had another record breaking month, checking 222 samples. This was a 56% increase from July 2020.
Drugs, drugs, and more drugs
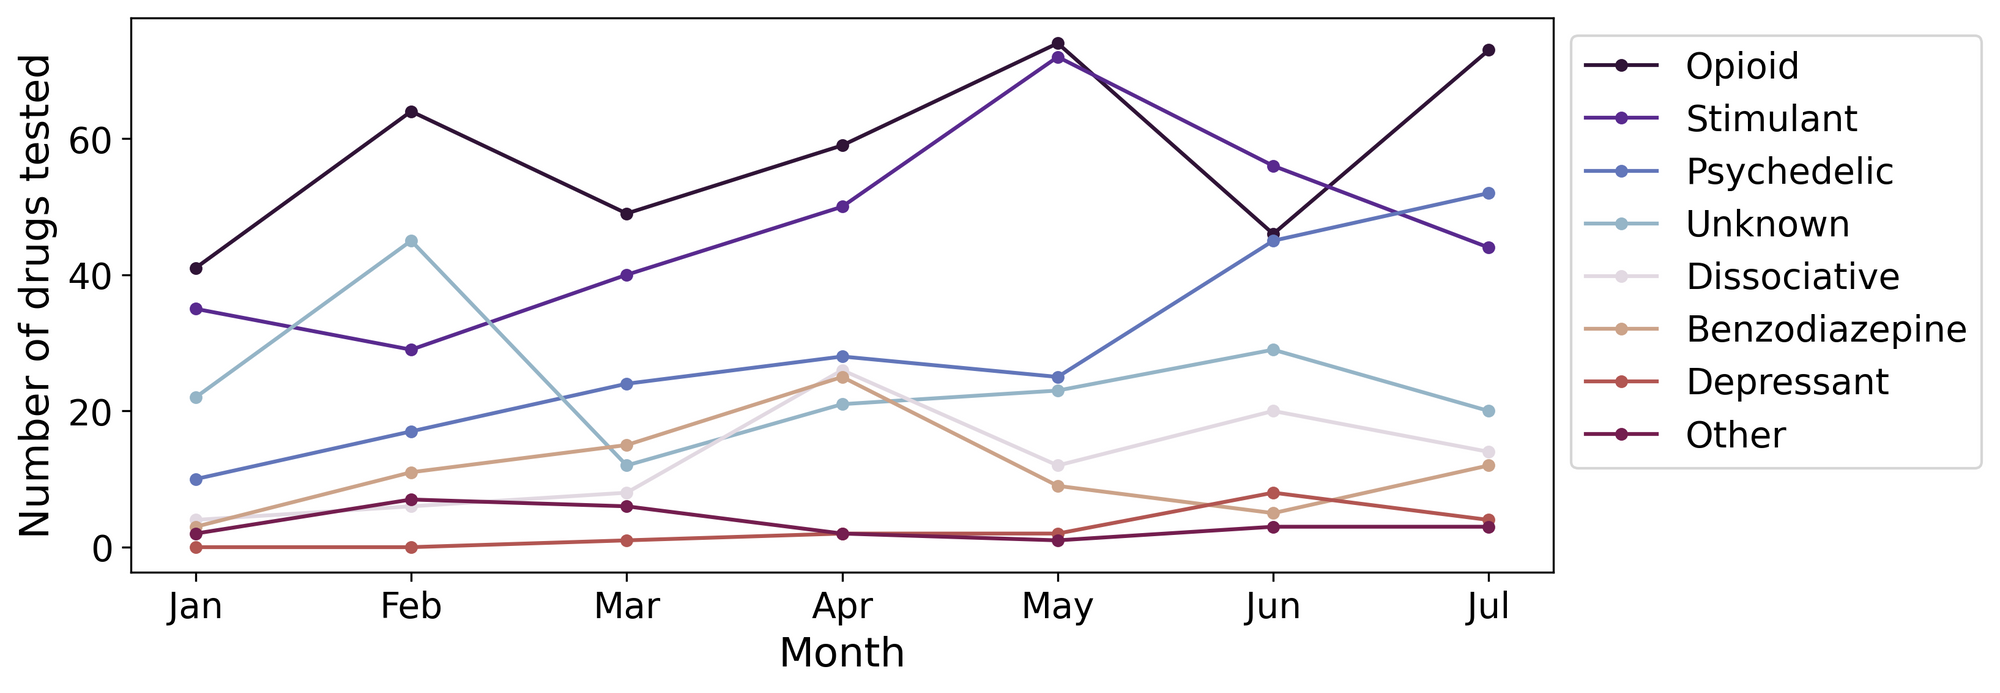
We test a lot of different drug types each month; from DMT to fentanyl to ketamine. Fig. 2 shows the prevalence of each expected drug category checked each month, with opioids and stimulants continuing to be our most common samples checked.
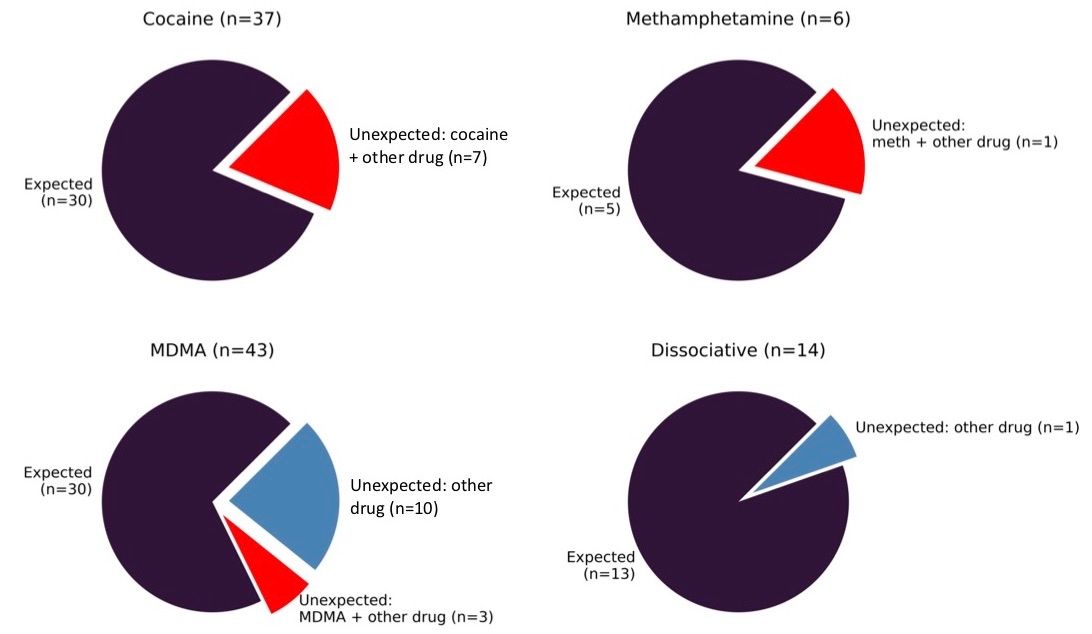
Not all the drugs we test are cut, buffed, or full of unexpected drugs. In many cases, we actually confirm that the expected drug was indeed the only expected active and that no additional cutting agents were present. The pie charts below differentiate when only the expected active was found from situations that would cause a sample to be unexpected.
But some samples are being cut right?
For the 30 cocaine samples where cocaine was the only active drug present, only one sample contained an inert cut of creatine. This means 78% of cocaine samples checked were found to contain cocaine as a single ingredient.
As we often like to say, meth is just meth. When meth was the only expected active present, no inert cuts were found. One sample of the overall samples was found to unexpectedly contain a mixture of meth, MDA and ketamine.
For the 30 MDMA samples where MDMA was the only active found, no inert cuts were found, meaning 70% of the overall MDMA samples contained MDMA as a single ingredient.
All dissociatives this month were expected to be ketamine. For the 13 samples where ketamine was found to be the only active, only one sample was found to be cut with caffeine.
Spotlight sample 1:
Green like a honeydew, putting me in a funny mood; this pressed pill was expected to be MDMA, but was found to be benzylpiperazine (BZP). This is a recreational drug with euphoriant and stimulant properties, comparable to those produced by amphetamines. Read more here.
Spotlight sample 2:
A lucent lattice, a candescent complexity; these crystals shined so bright they bring all the chemists to the yard. That’s just meth being meth.
Spotlight sample 3:
Pastel purple, bashfully bluish; this powder was expected to be MDMA, but was found to be a mixture of caffeine, sugar, and fentanyl. This combination sounds oddly familiar … it sounds almost like … an opioid-down sample! We suspect this opioid-down sample got mixed up somewhere along the line and found itself being misidentified as MDMA.
Benzodiazepines (n=12)
Though we seem to be hearing a lot about benzodiazepine adulteration in the opioid down supply, there are many substances brought to our service that are expected to be a benzo as a single ingredient, usually as a tablet.
This month none of the benzos were found to contain the expected active drug. Instead, we found a few different benzos, including etizolam (3), flualprazolam (3), and flubromazepam (2). We also found a few samples that seem to have been misrepresented as benzos as two contained MDMA/MDA mixtures, one contained lidocaine, and one contained a mixture of fentanyl with lidocaine.
Opioid-Down (n=70)
In this section we present statistics specific to the opioid-down supply, therefore they may differ from the highlighted findings above that are inclusive of all expected drug categories.
97% expected opioid-down samples contained fentanyl (68/70)
4 samples contained carfentanil
36% samples contained a benzo and/or etizolam (25/70)
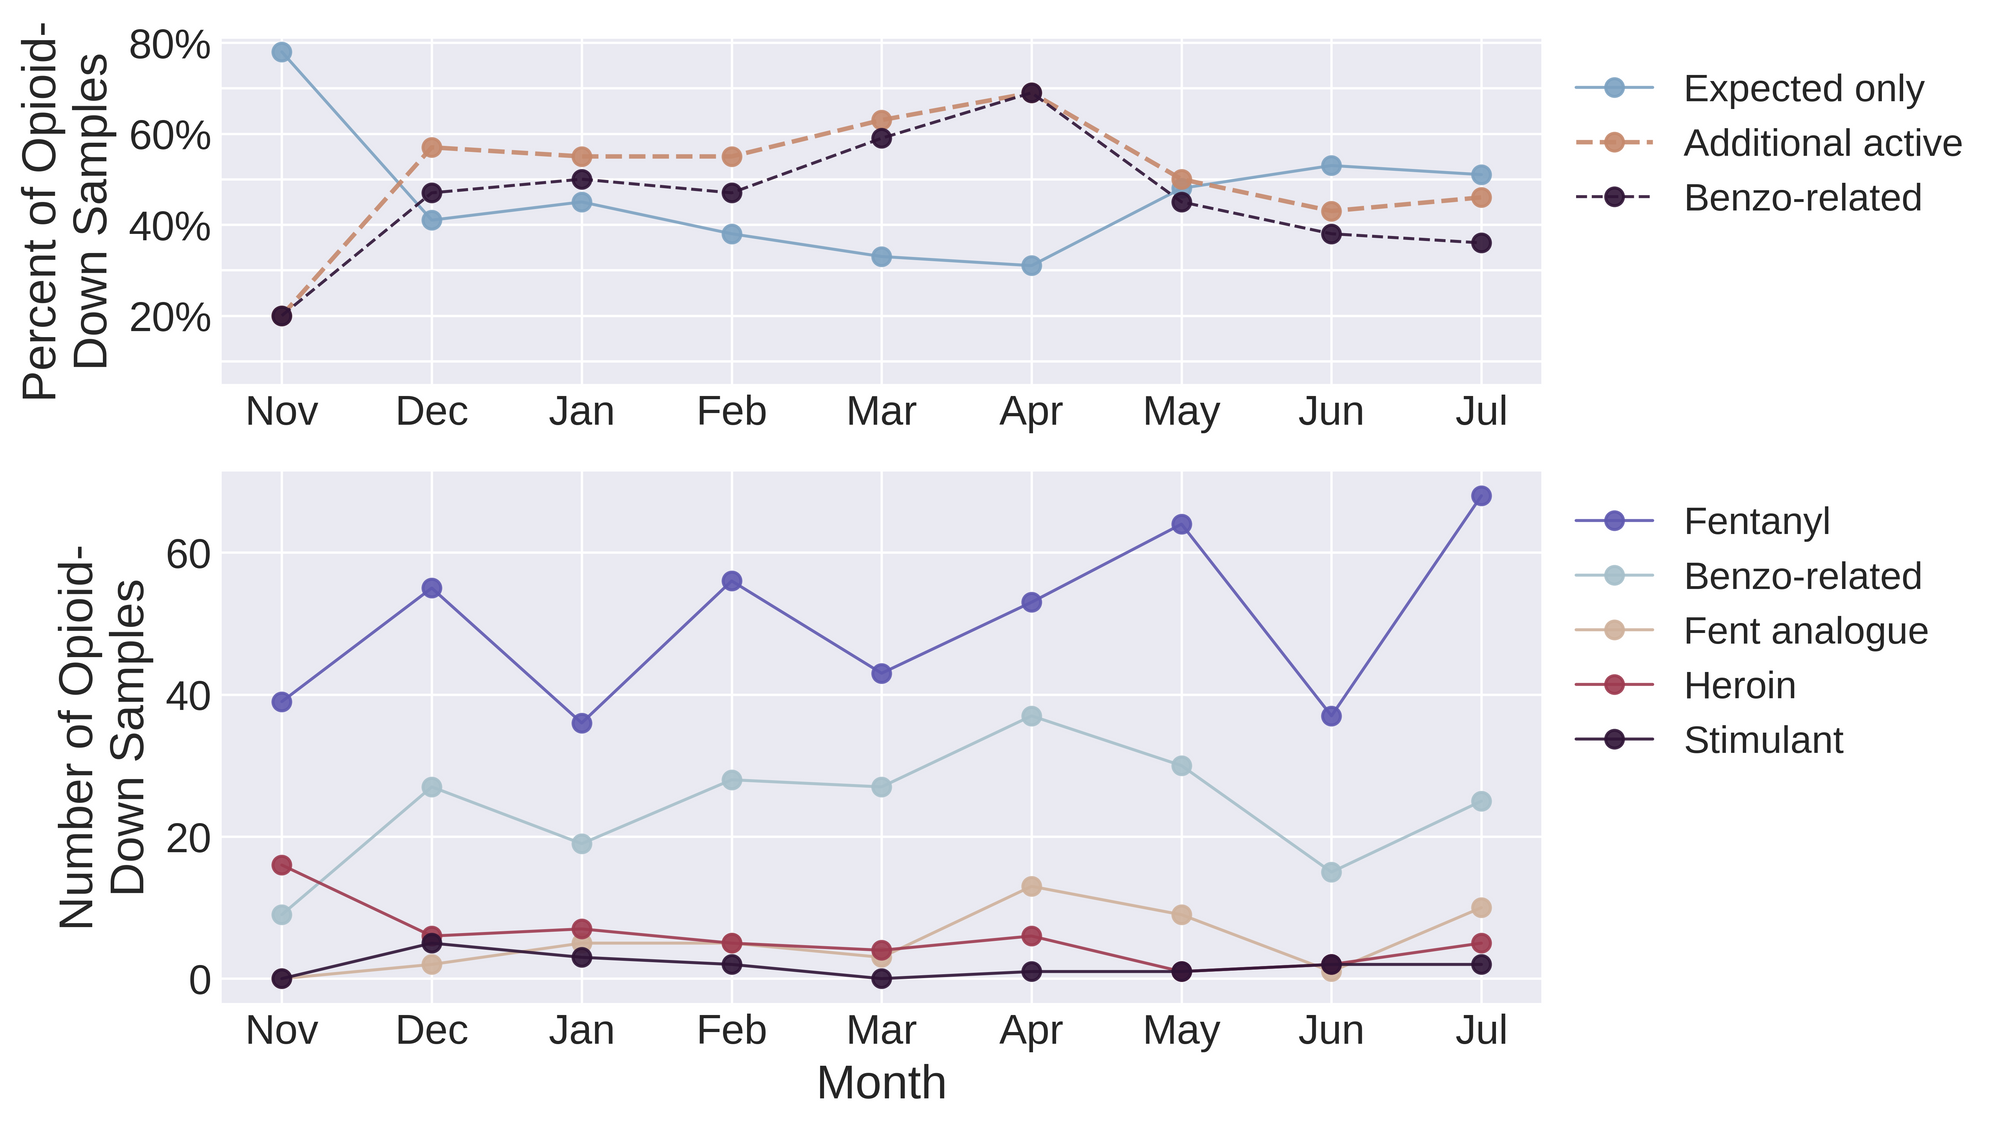
This July, 46% of opioid down samples contained an additional active to the expected fentanyl and/or heroin, with benzo-related drugs being the major contributor. This category represents the contaminated opioid down supply when adulterants are present, which is different from misrepresented samples where no expected active is found. Figure 2 illustrates the consistently high percentage of adulterants found in opioid down over time, highlighting the ever-changing conditions of prohibited markets. The only consistency we have is in knowing that each month there will be a high level of inconsistencies in the supply. People who use drugs have been pointing to the remedies to this unregulated supply for years, with calls for decriminalization and safer supply as effective interventions in the unregulated market. It’s long past time we listen.
Quantification for Expected Opioid-Down

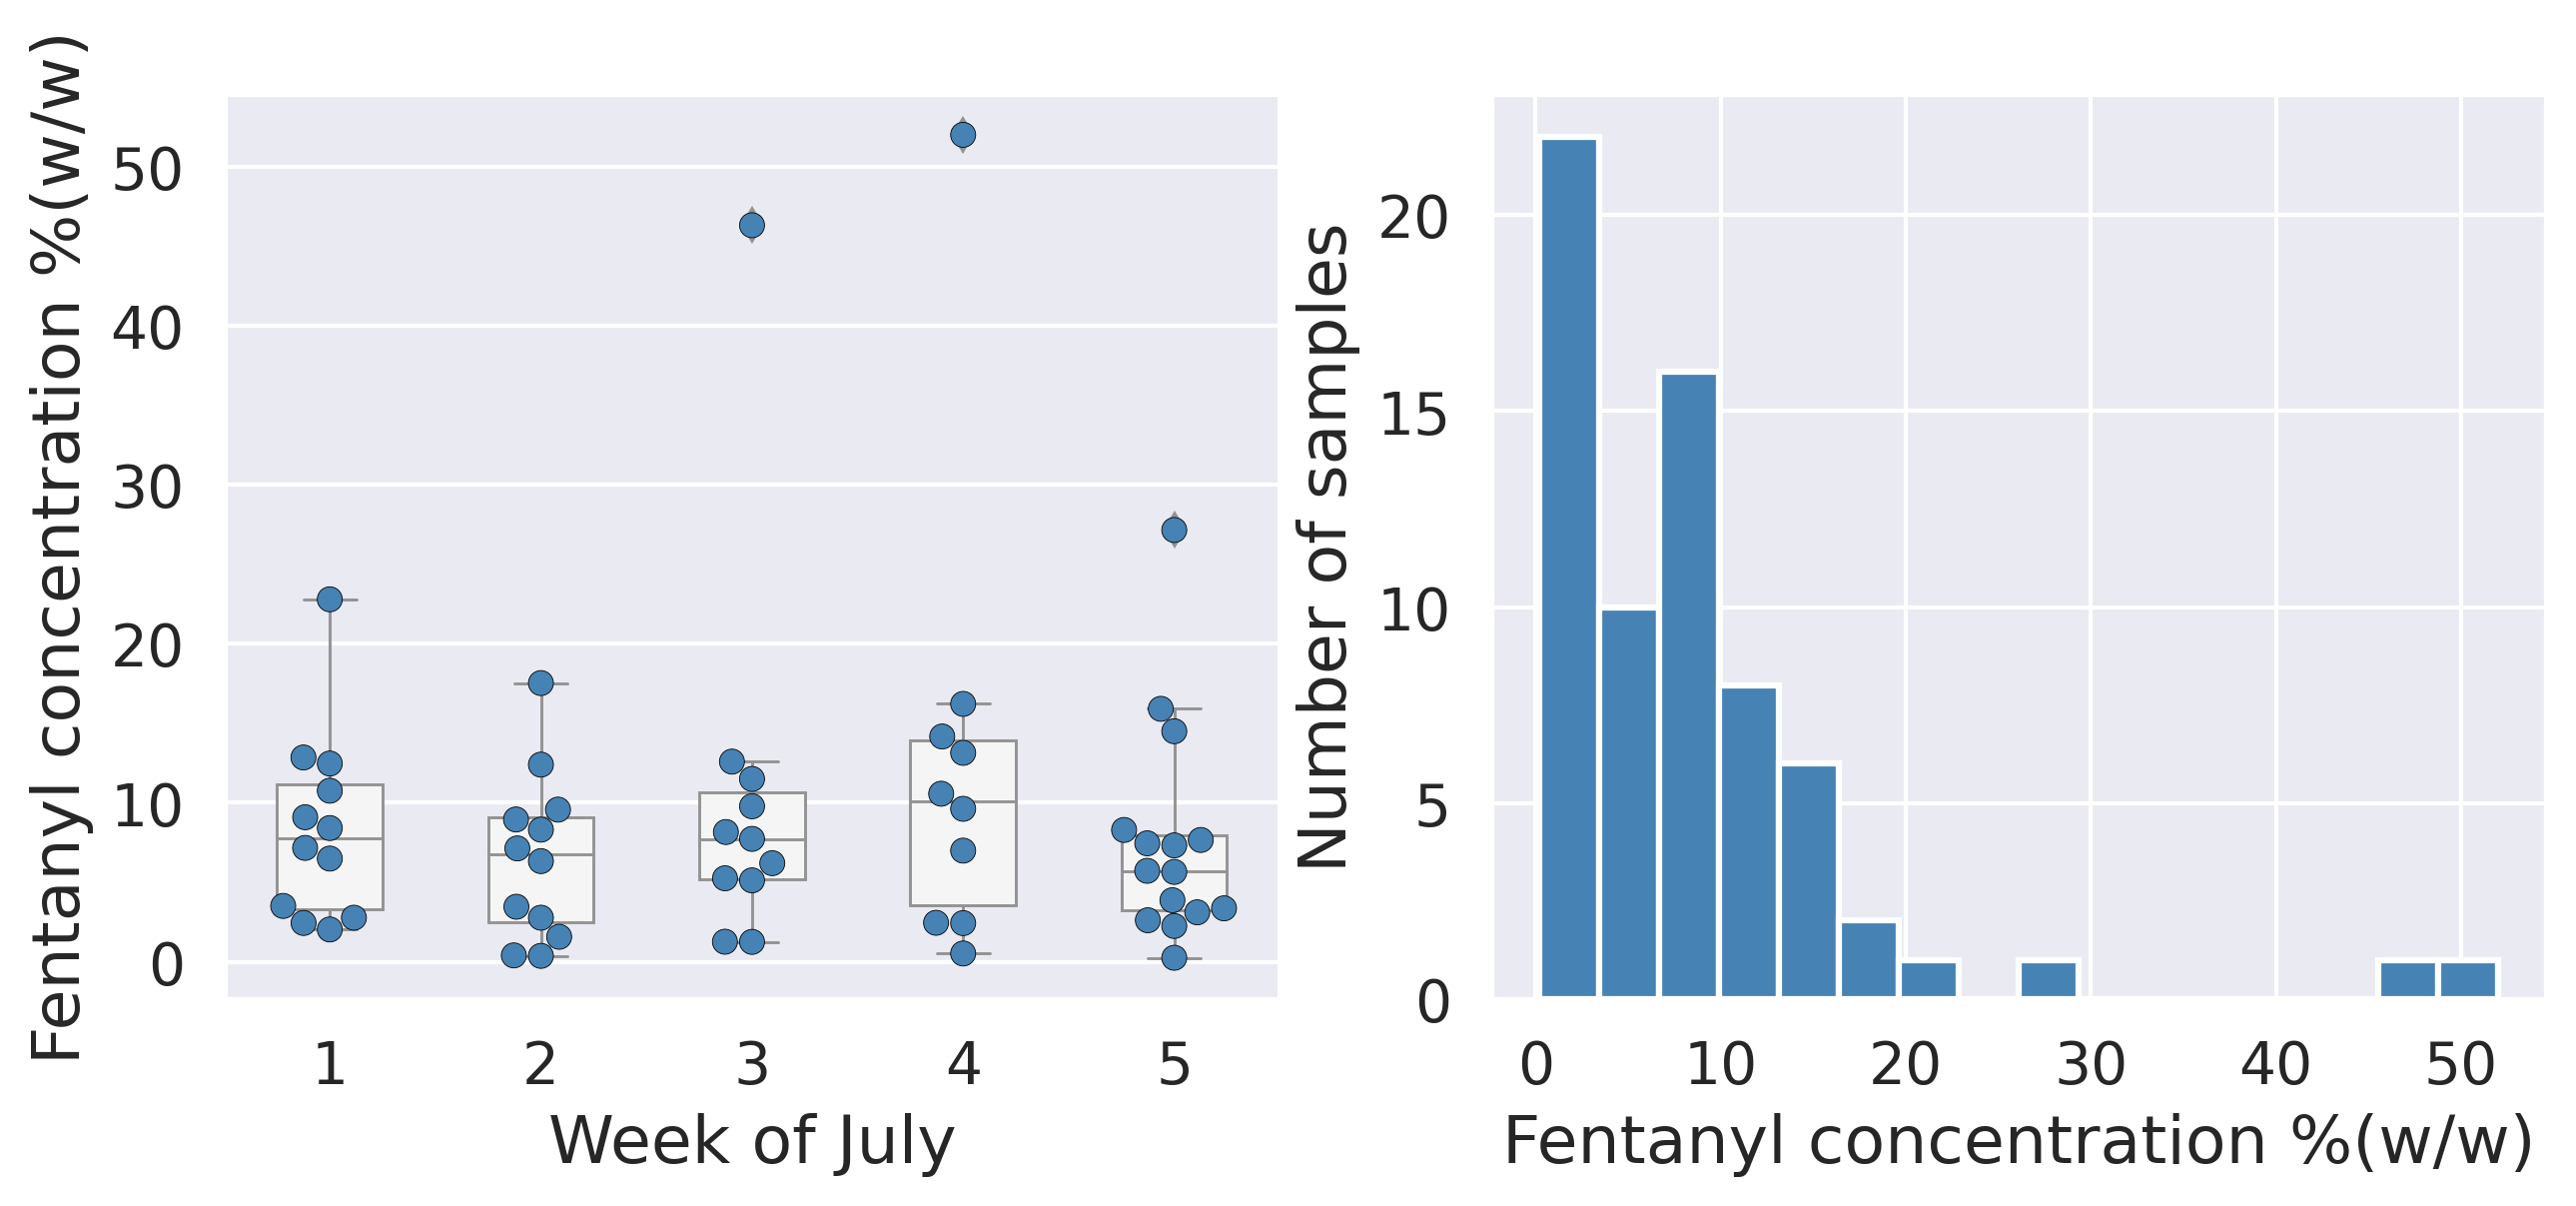
In July, we quantified fentanyl for 60/68 of the opioid down samples containing fentanyl and found the median concentration to be 7.2%, with the average strength of fentanyl we normally see being around 10%. Though the median is a useful indicator, it doesn’t capture the volatility of fentanyl concentrations present in the opioid supply, as any one sample might be the lowest strength (0.3%) or the strongest (52.0%). Figure 3 demonstrates the spread of concentrations we found in July by week (left) and for the month overall (right).
Want to be notified when we release these reports? Join our mailing list to receive updates about when our reports are out. You can subscribe and unsubscribe yourself from this list at any time.
Check back next month for the August report!
As always, send us feedback at substance@uvic.ca for how we can continue to offer our drug checking results in a useful way.