April 2021 Monthly Report


In this blog post we discuss our April 2021 report and provide more information on how to interpret the results. The PDF report can be found at the end.
Key findings:
- Fentanyl analogues found in 24% of opioid-down samples (13/54), including fluorofentanyl (7), carfentanil (5), chloroisobutyryl fentanyl (1).
- Median fentanyl concentration of 11.6%, with a maximum concentration of 32.7% found in an expected opioid-down sample.
- Median etizolam concentration of 3%, with a maximum concentration of >20% found in an expected opioid-down sample.
- Benzodiazepines and/or etizolam found in 69% of expected opioid-down samples, a 10% increase from last month.
- Ephenidine found in three expected ketamine samples.
Insight for the April 2021 Monthly Report
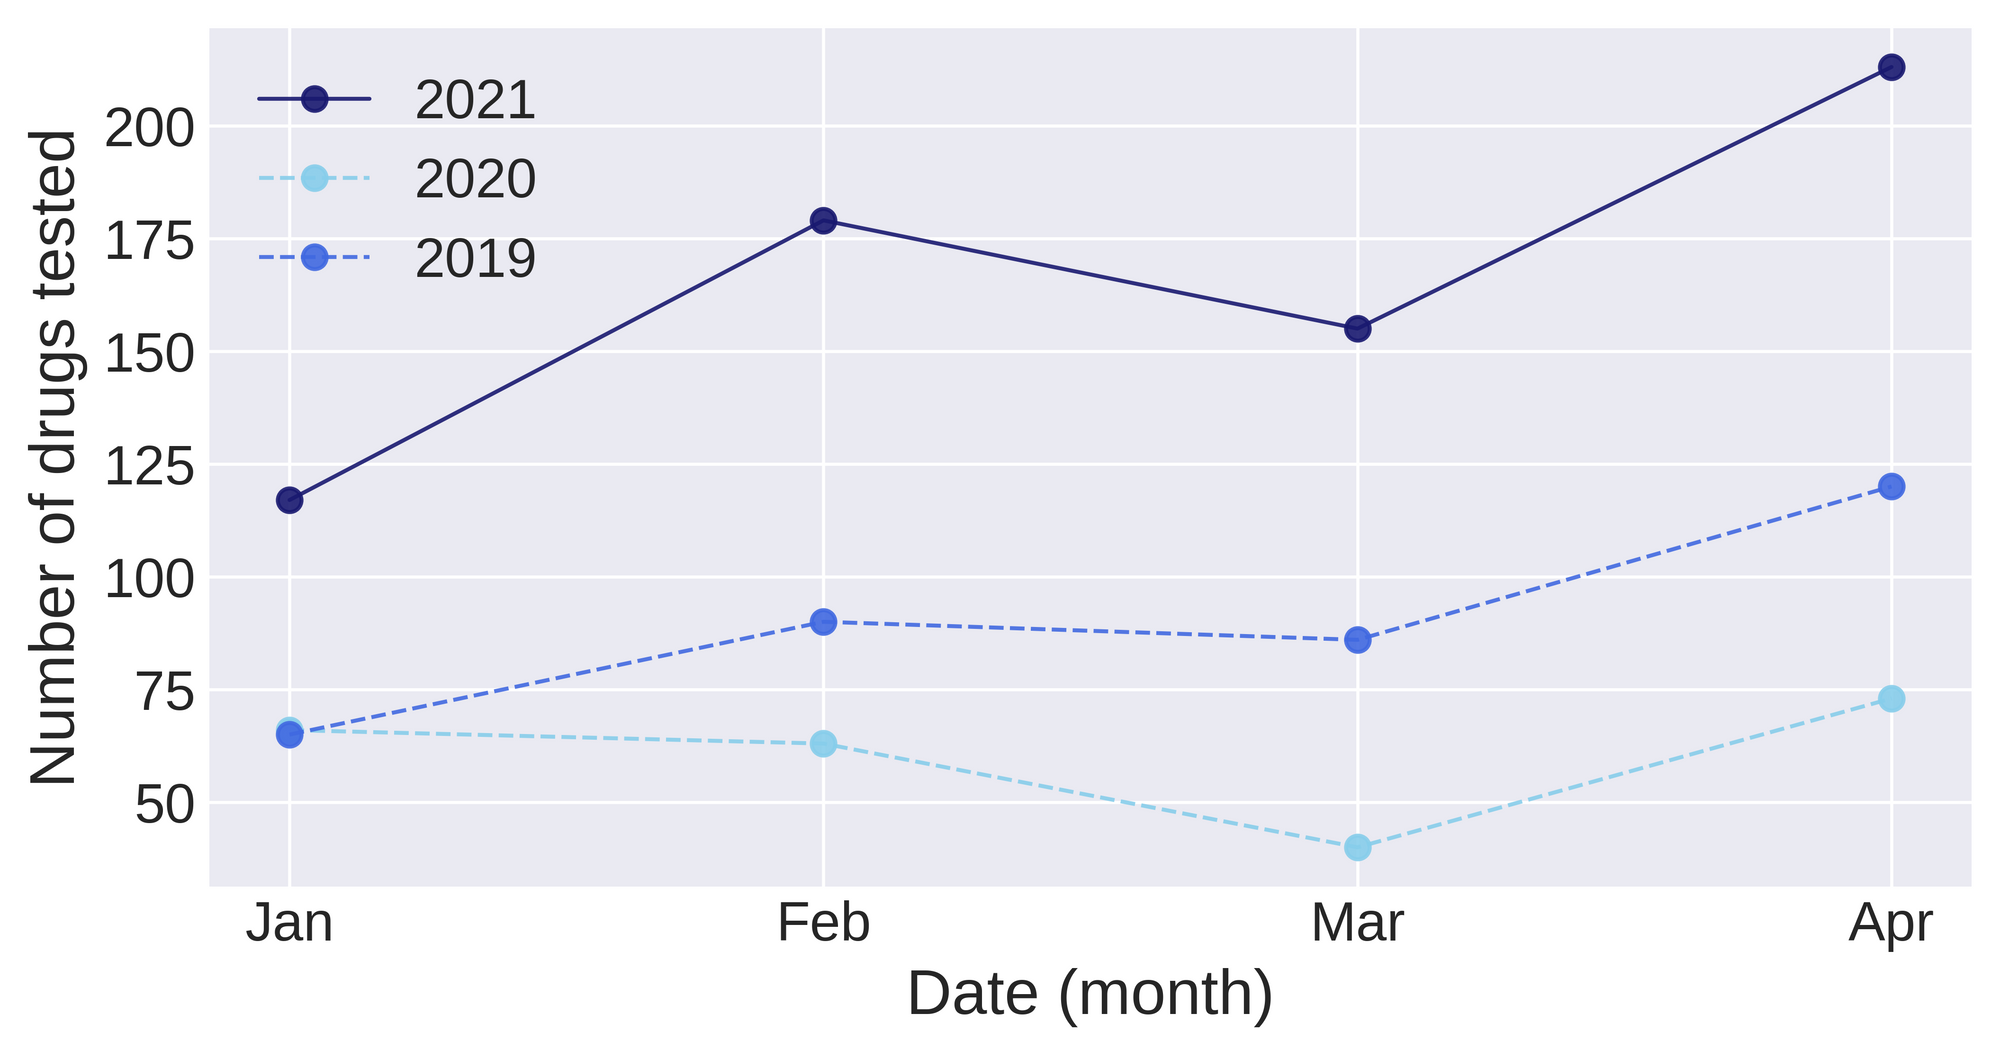
Service was booming this April as we set a record for our busiest month yet, checking 213 samples! This was a 190% increase from April 2020.
Some Good News
It’s difficult to imagine where we would be without drugs. Opioids, like fentanyl, are used every day within hospitals to effectively treat pain, among other uses. Benzodiazepines are critical tools in the treatment of anxiety and panic attacks. Caffeine is commonly consumed by millions of people to provide a midday pick me up. The reality is, we need drugs. In fact, we love drugs! Yet when we only report out on the bad news on drugs, it paints a stigmatizing picture of drugs and those who use them. For this reason, we aim to report out on the encouraging news in the illicit supply as well.
Recently, Stephanie Arlt wrote a useful piece engaging with parts of Dr. Carl Hart’s new book, Drug Use For Grown-Ups: Chasing Liberty in The Land of Fear. In it, Arlt provides a commentary that explores the dangers of emphasizing the harms of drug use while simultaneously neglecting their benefits. Arlt breaks down quotes like “imagine if you were interested in learning about cars and there was only information on car crashes,” to draw a comparison between the disproportionate emphasis on drug-related harms when discussing drugs and drug use. As Arlt points out, “[w]hen these harms are seen through tunneled vision and benefits aren’t acknowledged, the harms will always outweigh the benefits because we don’t talk about the benefits.”
As we’ve mentioned before, drug checking is not just about screening for harmful contaminants, but also for confirming that the active is in fact the active. Many drugs are uncut and unadulterated, only containing the expected ingredients. While we recognize the harms created by the current supply, in our monthly reports we aim to disrupt the tendency to always position drugs as ‘bad’ and therefore harmful. The reality is that many people use drugs for a variety of reasons and as Arlt accurately points out, “simply using drugs does not constitute harm to oneself.” In this context, we aim to talk about the encouraging data from the supply in Victoria so as not to lose sight of the complexities of drugs and drug use by only reporting on the “car crashes”. Read the article here.
Some good news in Victoria
Methamphetamine - 14/15 samples (93%) were found to only contain methamphetamine, while one sample was found to be baking soda.
Cocaine - 32/33 samples (97%) were found to be just cocaine with no cuttings agents, while one sample was found to contain cocaine cut with phenacetin (acetaminophen-like substance).
Ketamine - 19/26 samples (73%) were found to only contain ketamine with no cuts.
MDMA - 13/17 samples (79%) were found to only contain MDMA with no cuts.
LSD - 7/8 samples (88%) were found to only contain LSD, while no active was detected in one sample due to the limits in our detection.
GHB - 2/2 samples (100%) were found to only be GHB.
As you can see, many people use our service and find only the expected drug they brought in. It’s a reality that “car crashes” do happen, often because of existing structures that disproportionately impact certain communities and places, but many cars are coasting safely on the highway.
Spotlight samples
Spotlight One: An MDMA sample was found to contain fentanyl and etizolam with no MDMA. This was a clear misrepresentation of MDMA, rather than some cases where we discuss the possibilities of cross-contamination triggering a positive fentanyl strip result. This sample looked like powdered opioid-down (because it was), rather than crystals or crystal-powder that is typical of MDMA.
Spotlight Two: One MDMA sample was found to be just MDMA. It had beautiful, shiny, crystals in shades of dazzling pink that made you wish it was 2 am and that you were raving on the beach. The service user was stoked. We were stoked.
Spotlight Three: Three ketamine samples were found to be ephenidine. Ephenidine is a novel designer drug that can be classed as a dissociative anesthetic. It is an NMDA receptor antagonist, as is ketamine, so they have similar effects, yet ephenidine has relatively unknown long term effects due to its short history. Read about some user experiences with ephenidine here.
Expected Opioid-Down (n=54)
Fentanyl and Analogues
- 98% expected opioid-down samples contained fentanyl (53/54)
- 13% samples contained fluorofentanyl (7/54).
- 5 samples contained carfentanil
- 1 sample contained chloro isobutyryl fentanyl
- 49% samples contained over 10% fentanyl (24/49 quantified)
Fentanyl analogues look very similar to fentanyl, but minor differences in their structure can greatly affect their ability to bind to mu opioid receptors in our bodies, therefore they can greatly differ in potency. Carfentanil has an additional methyl ester group and is known to be 100x stronger than fentanyl. Fluorofentanyl has an additional fluorine atom that when para- on the benzene ring, is half the potency of fentanyl, but when ortho- it is 2.6x as potent. We are unable to differentiate ortho- and para- fluorofentanyl with our current methods. Chloroisobutyryl fentanyl has an extra chlorine atom and is found to be 62x stronger than fentanyl. Read more here.
Benzos and Etizolam
- 69% samples contained a benzo and/or etizolam (37/54)
- 56% samples contained etizolam (30/54)
- 20% samples contained a benzodiazepine (11/54)
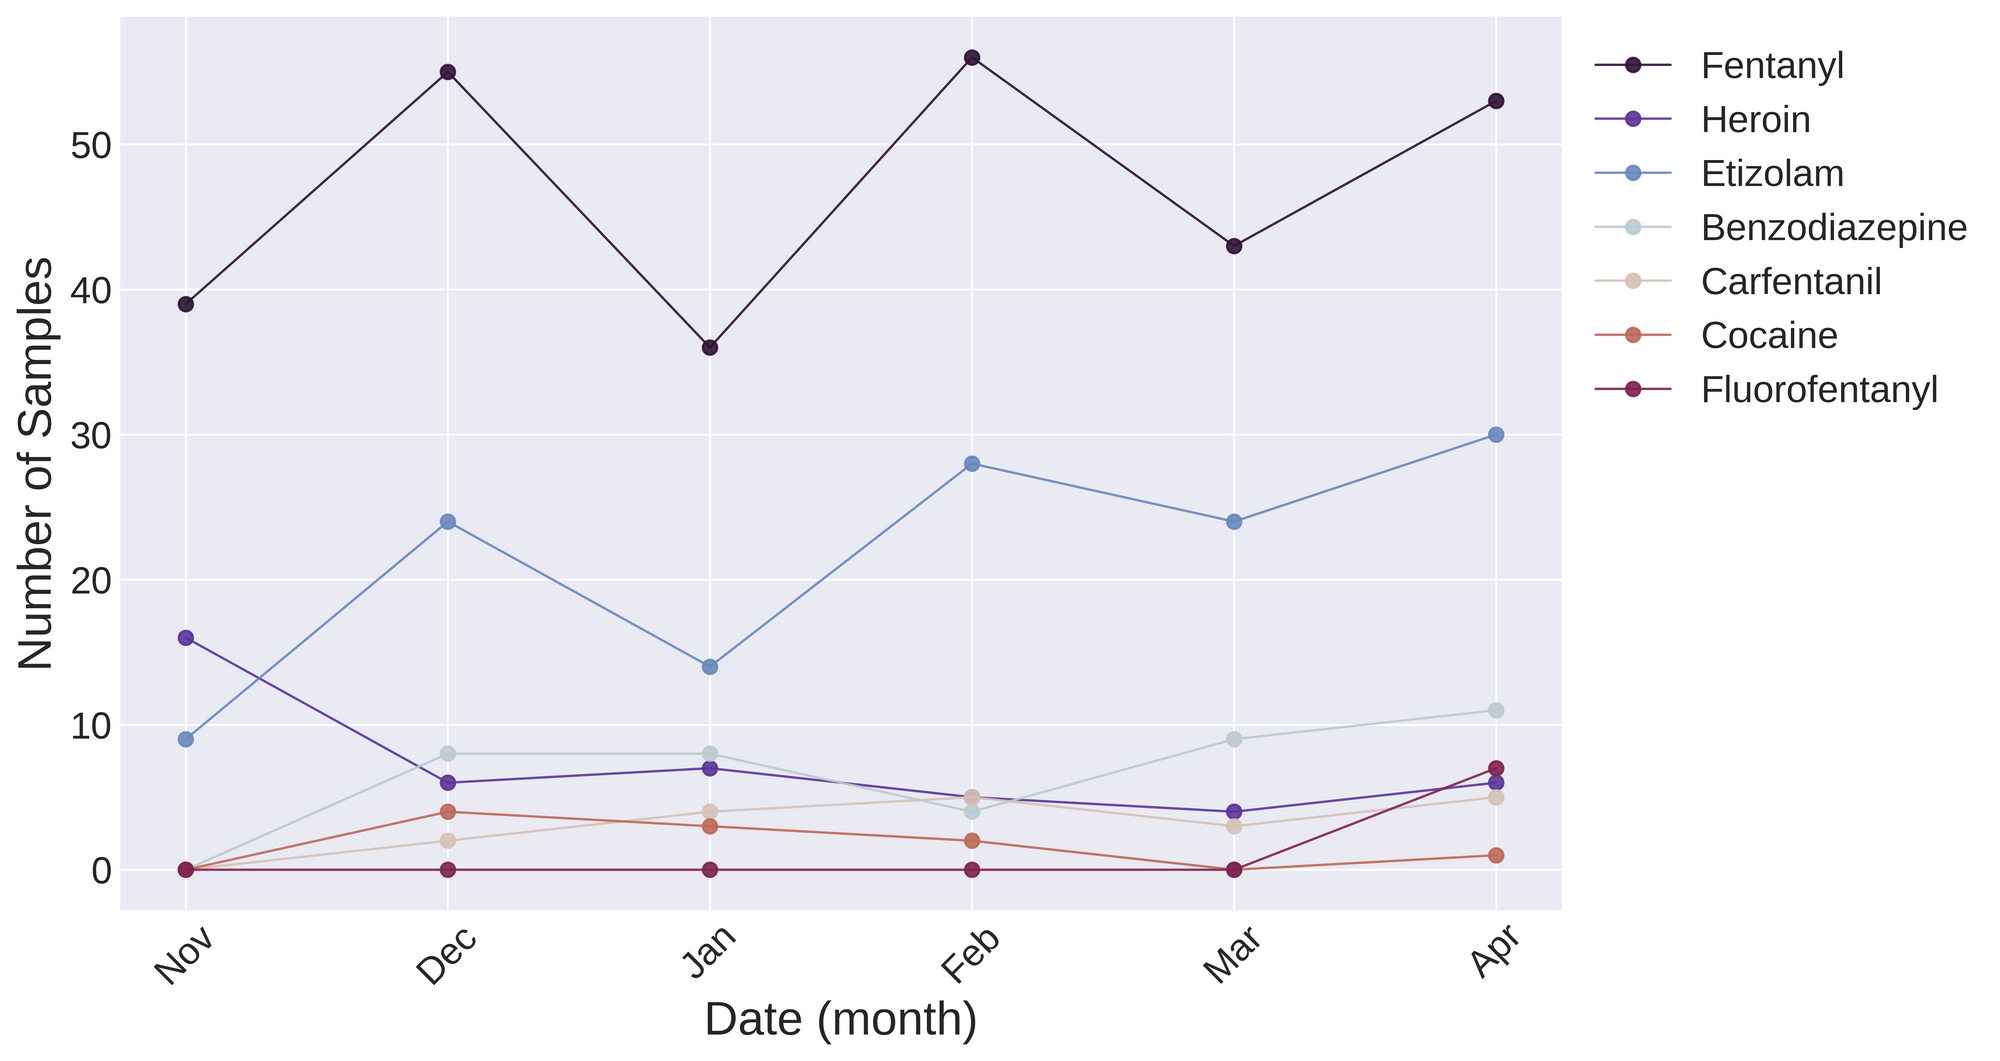
This April, 69% of opioid-down samples contained an active in addition to fentanyl and/or heroin. Yes this is the same percent stated above, meaning a benzo and/or etizolam were in every sample containing an additional active. Fentanyl analogues, cocaine and methylenedioxycathinone were found in combination with benzos as additional actives. This number has continued to increase over the past months: Mar (63%), Feb (55%), Jan (55%), Dec (61%), Nov (20%). Figure 2 shows the prevalence of actives being found in opioid-down samples over a six month time period. These data highlight the inconsistencies and irregularities of the illicit supply. The increase in benzodiazepine adulteration is not only distressing, it reflects the ever-changing conditions of prohibited markets. People who use drugs have been pointing to the remedies to this unregulated supply for years, with calls for decriminalization and safer supply as effective interventions in the unregulated market. It’s long past time we listen.
Quantification for Expected Opioid-Down
These values differ from those contained in the attached PDF report because they are restricted to expected opioid-down samples.

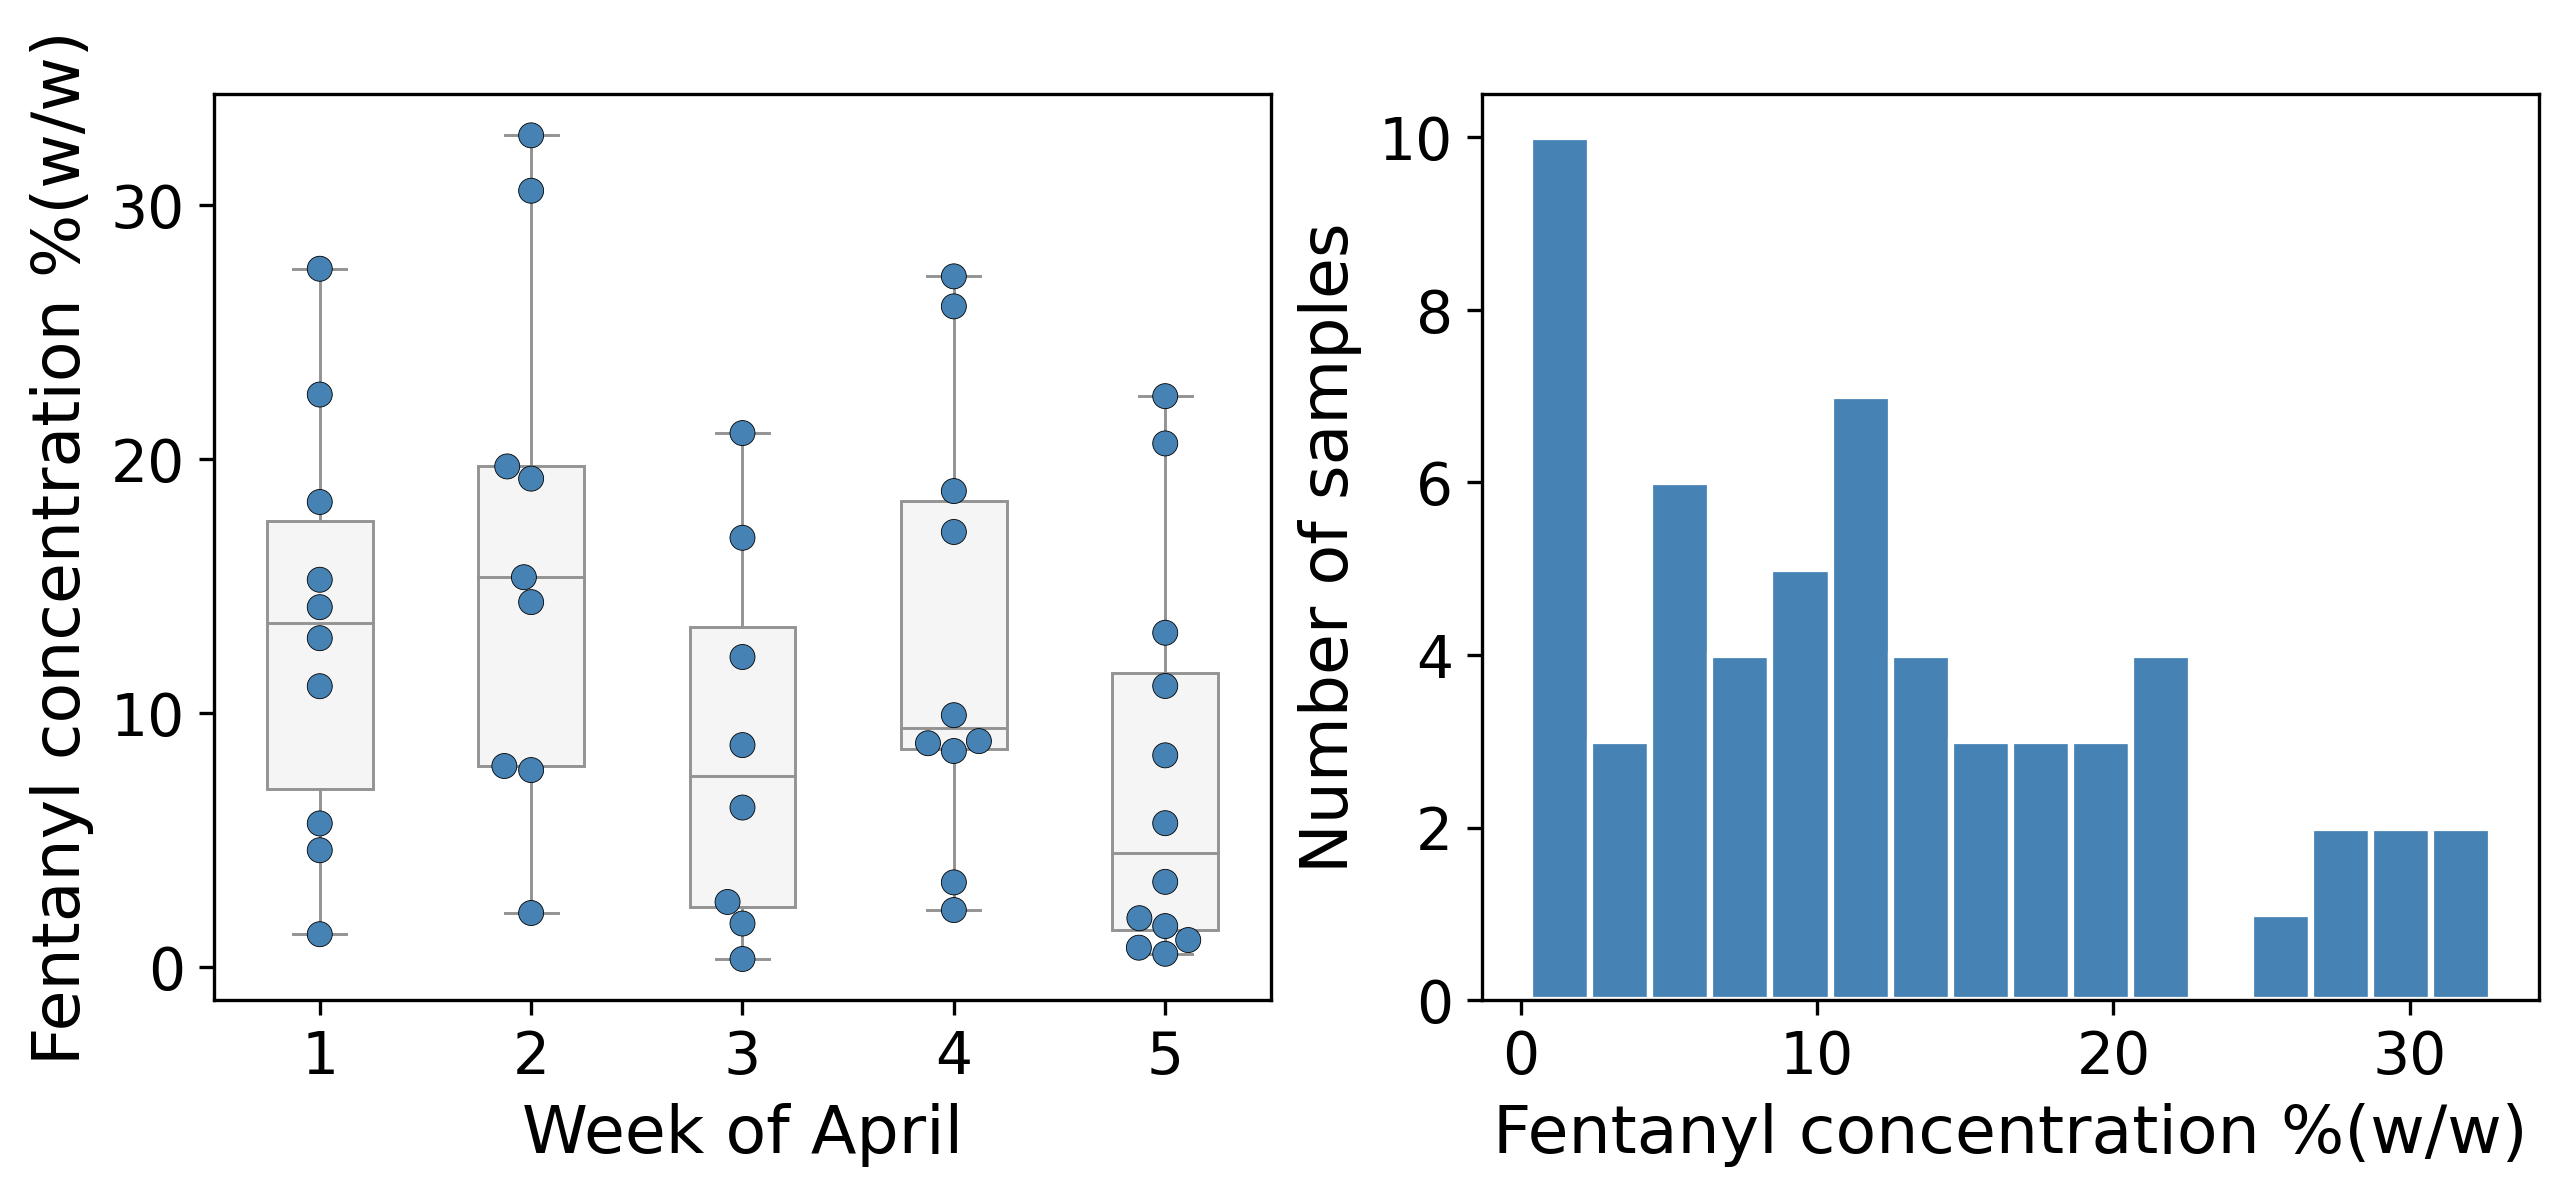
In April, we quantified fentanyl for 49 of the 54 of the expected opioid-down samples that contained fentanyl. We found the median concentration to be 9.9% fentanyl. Figure 3 demonstrates the spread of fentanyl concentrations in April by week (left) and for the month overall (right). The average strength of fentanyl in opioid-down that we see during service is around 10% in general. The median concentration of 9.9% fentanyl for April confirms this average. Our findings illustrate the volatility of fentanyl concentrations in the opioid-supply, as any one sample in the week might be the lowest strength sample (0.3%) or the strongest sample (32.7%).
Want to be notified when we release these reports? Join our mailing list to receive updates about when our reports are out. You can subscribe and unsubscribe yourself from this list at any time.
Check back next month for the May report!
As always, send us feedback at substance@uvic.ca for how we can continue to offer our drug checking results in a useful way.