January 2023 Monthly Report

In this blog post, we discuss our January 2023 report and provide more information on how to interpret the results. The PDF report can be found at the end.
Key findings:
- The median fentanyl concentration found, across all expected drug categories, was 10.7% with a maximum of over 80%
- Carfentanil was found in 3 expected opioid-down samples, with concentrations of 0.06%, 0.11%, and 0.59%
- Benzodiazepines and/or etizolam were found in 43% (141/330) of expected opioid-down samples
- The median concentration of bromazolam, the most common benzodiazepine found across all drug categories, was 2.6% with a maximum of over 80% in an expected bromazolam sample
- Xylazine was found in 11 expected opioid-down samples, with a median concentration of 9.1% and a maximum concentration of 28.6%
Insight for the January 2023 Monthly Report
2022 was a rush and we are feeling a little dizzy looking back at the past year. In 2022, we:
- Checked 6239 samples (a 244% increase in the number of samples checked in 2021, and more than half of the total samples checked since the beginning of the Project in 2018)
- Opened 415 envelopes containing 723 samples (without a single paper cut to note)
- Implemented our Distributed Drug Checking model and welcomed Campbell River, the Comox Valley, Duncan, and Port Alberni onboard as full-time sites for distributed drug checking, checking 314 samples between the sites
- Offered drug checking at seven events (find the 2022 Events report attached at the end of this blog)
- Ran pop-up drug checking in Duncan, Nanaimo (find a report highlighting the findings from our trip to NANDU attached at the end of this blog), Parksville, Sooke, Salt Spring Island, and in downtown Victoria for Overdose Awareness Day
- Collaborated with our peers during Teaching Thursdays
- Published some papers
- Handed out more harm-reduction supplies, stickers, and snacks than you could shake a pixie stick at
All of this activity leaves our heads spinning!(not to mention some additional confusion from: the fact it is currently March 2023 and we are talking about 2022 in a blog post that is supposed to be about January 2023 data; from the multiple definitions of a year that complicate this author’s thought process when thinking about a “year” in review (are we actually back to where we were a year ago? Could we have checked another sample or two in 2022 if society utilized the 20ish-minute differences between the different “year” definitions? What even is time, man?); from the idea that the Earth is spinning around its axis at about 460 m/s and is orbiting the Sun at around 30km/s and is orbiting the centre of the Galaxy at about 220 km/s and is moving with respect to the Cosmic Microwave Background at around 400-800 km/s; and from all the drugs.)
Despite the apparent daze, this buzz feels good. We are feeling stable on our feet as we hurdle into 2023 and in January we checked 685 samples, surpassing our previous record for the number of samples checked in a month. Energized by the velocity of 2022, we hope that the uptick in service in January foreshadows another productive year and that we can continue to build our momentum throughout 2023. We look forward to another journey around the Sun with you all.
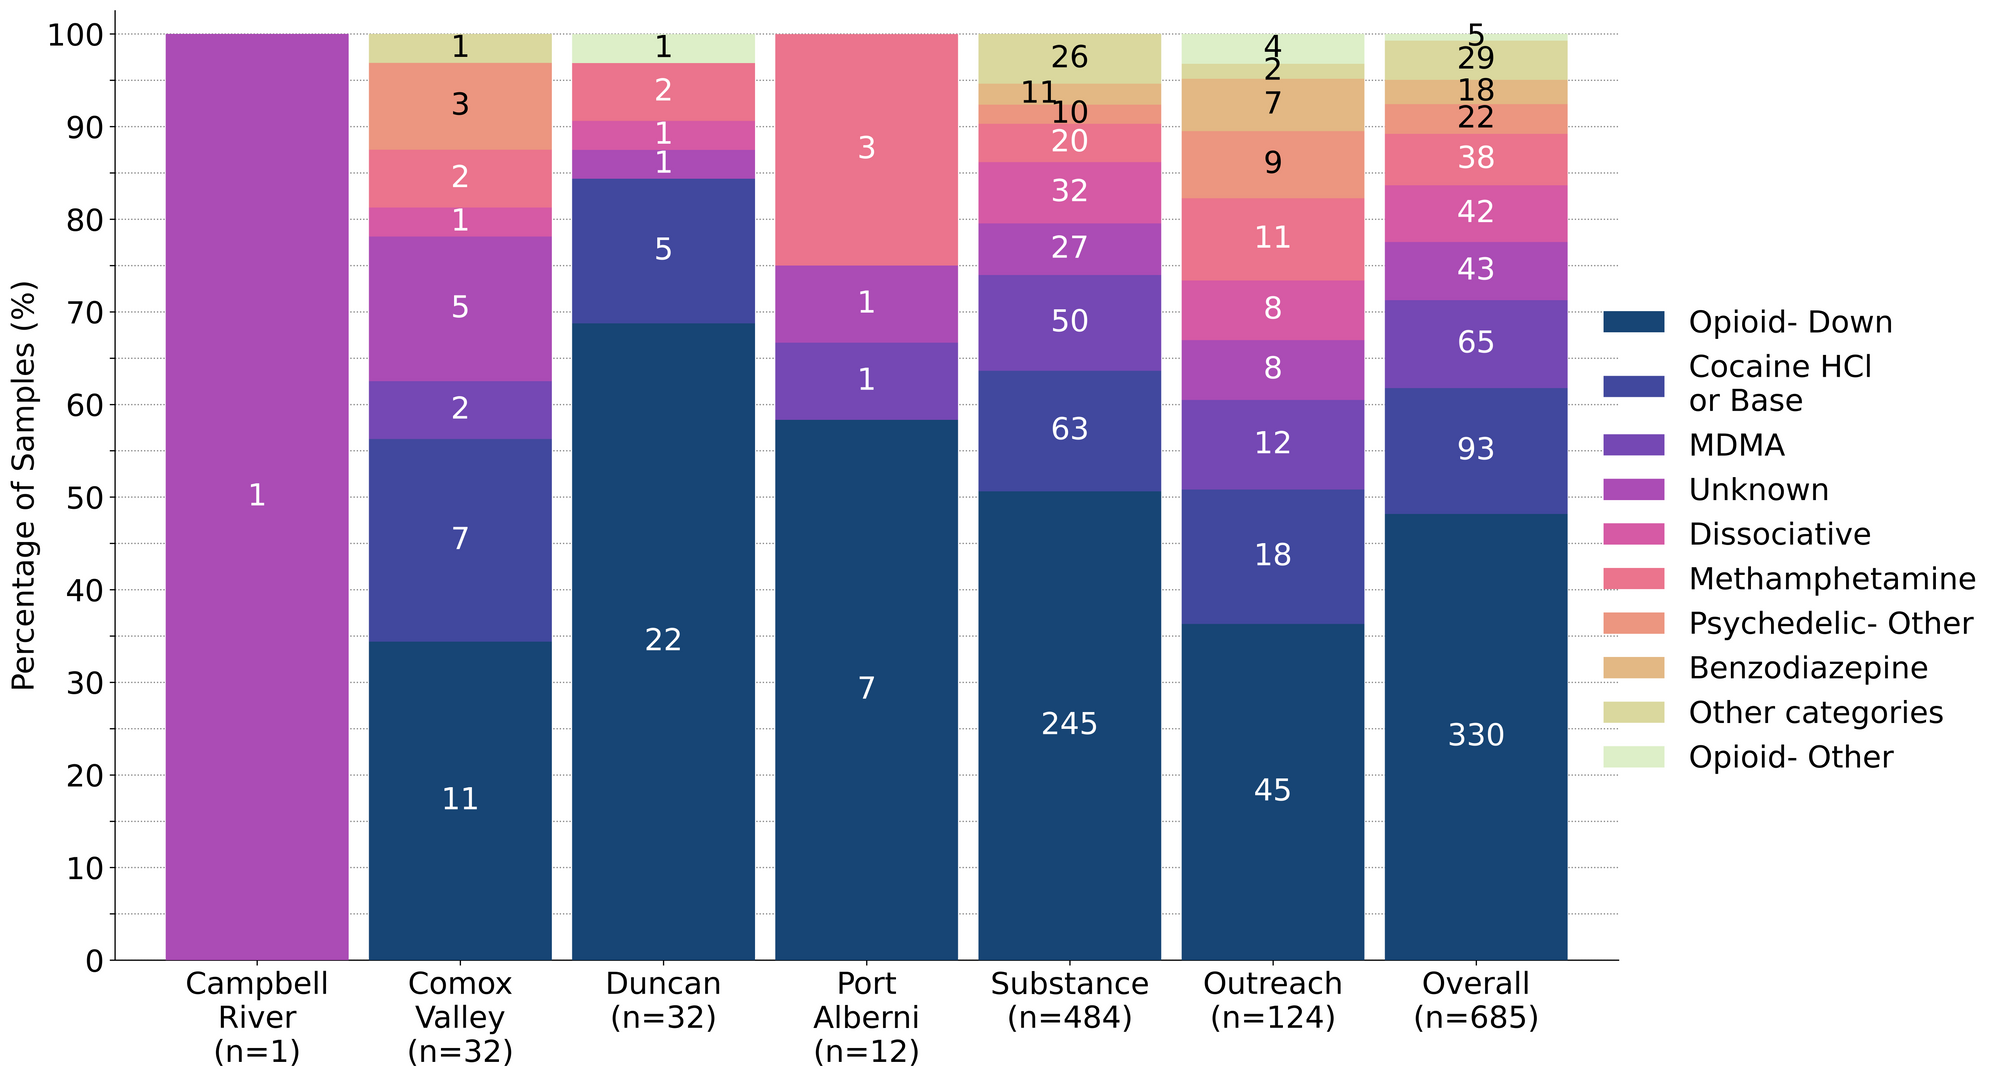
This blog, and the associated pdf report, breakdown our sample counts into six categories:
-
samples received through direct service provision in Victoria, where service users are bringing samples into the Substance storefront. These samples are labelled as “Substance” samples in the figures/tables of this blog post
-
samples received through direct service provision in Campbell River, where service users are bringing samples to the Vancouver Island Mental Health Society (VIHMS). These samples are labelled as “Campbell River”.
-
samples received through direct service provision in the Comox Valley, where service users are bringing samples to AVI Health & Community Services in Courtenay, BC. These samples are labelled as “Comox Valley”.
-
samples received through direct service provision in the Cowichan Valley, where service users are bringing samples to the Duncan Lookout Society OPS in Duncan, BC. These samples are labelled as “Duncan”.
-
samples received through direct service provision in Port Alberni, where service users are bringing samples into Port Alberni Shelter Society’s OPS. These samples are labelled as “Port Alberni”.
-
samples received through indirect service provision, where samples are collected through no-contact drop-off envelopes, mail-in envelopes, or are collected by harm reduction workers and other community members at supported housing sites, overdose prevention sites, and supervised consumption locations. These samples are labelled as “Outreach” samples in the figures/tables herein.
Drug types
Fig. 1 shows the prevalence of each expected drug category checked, split by sample collection location/method.

Novel notables in the new year?
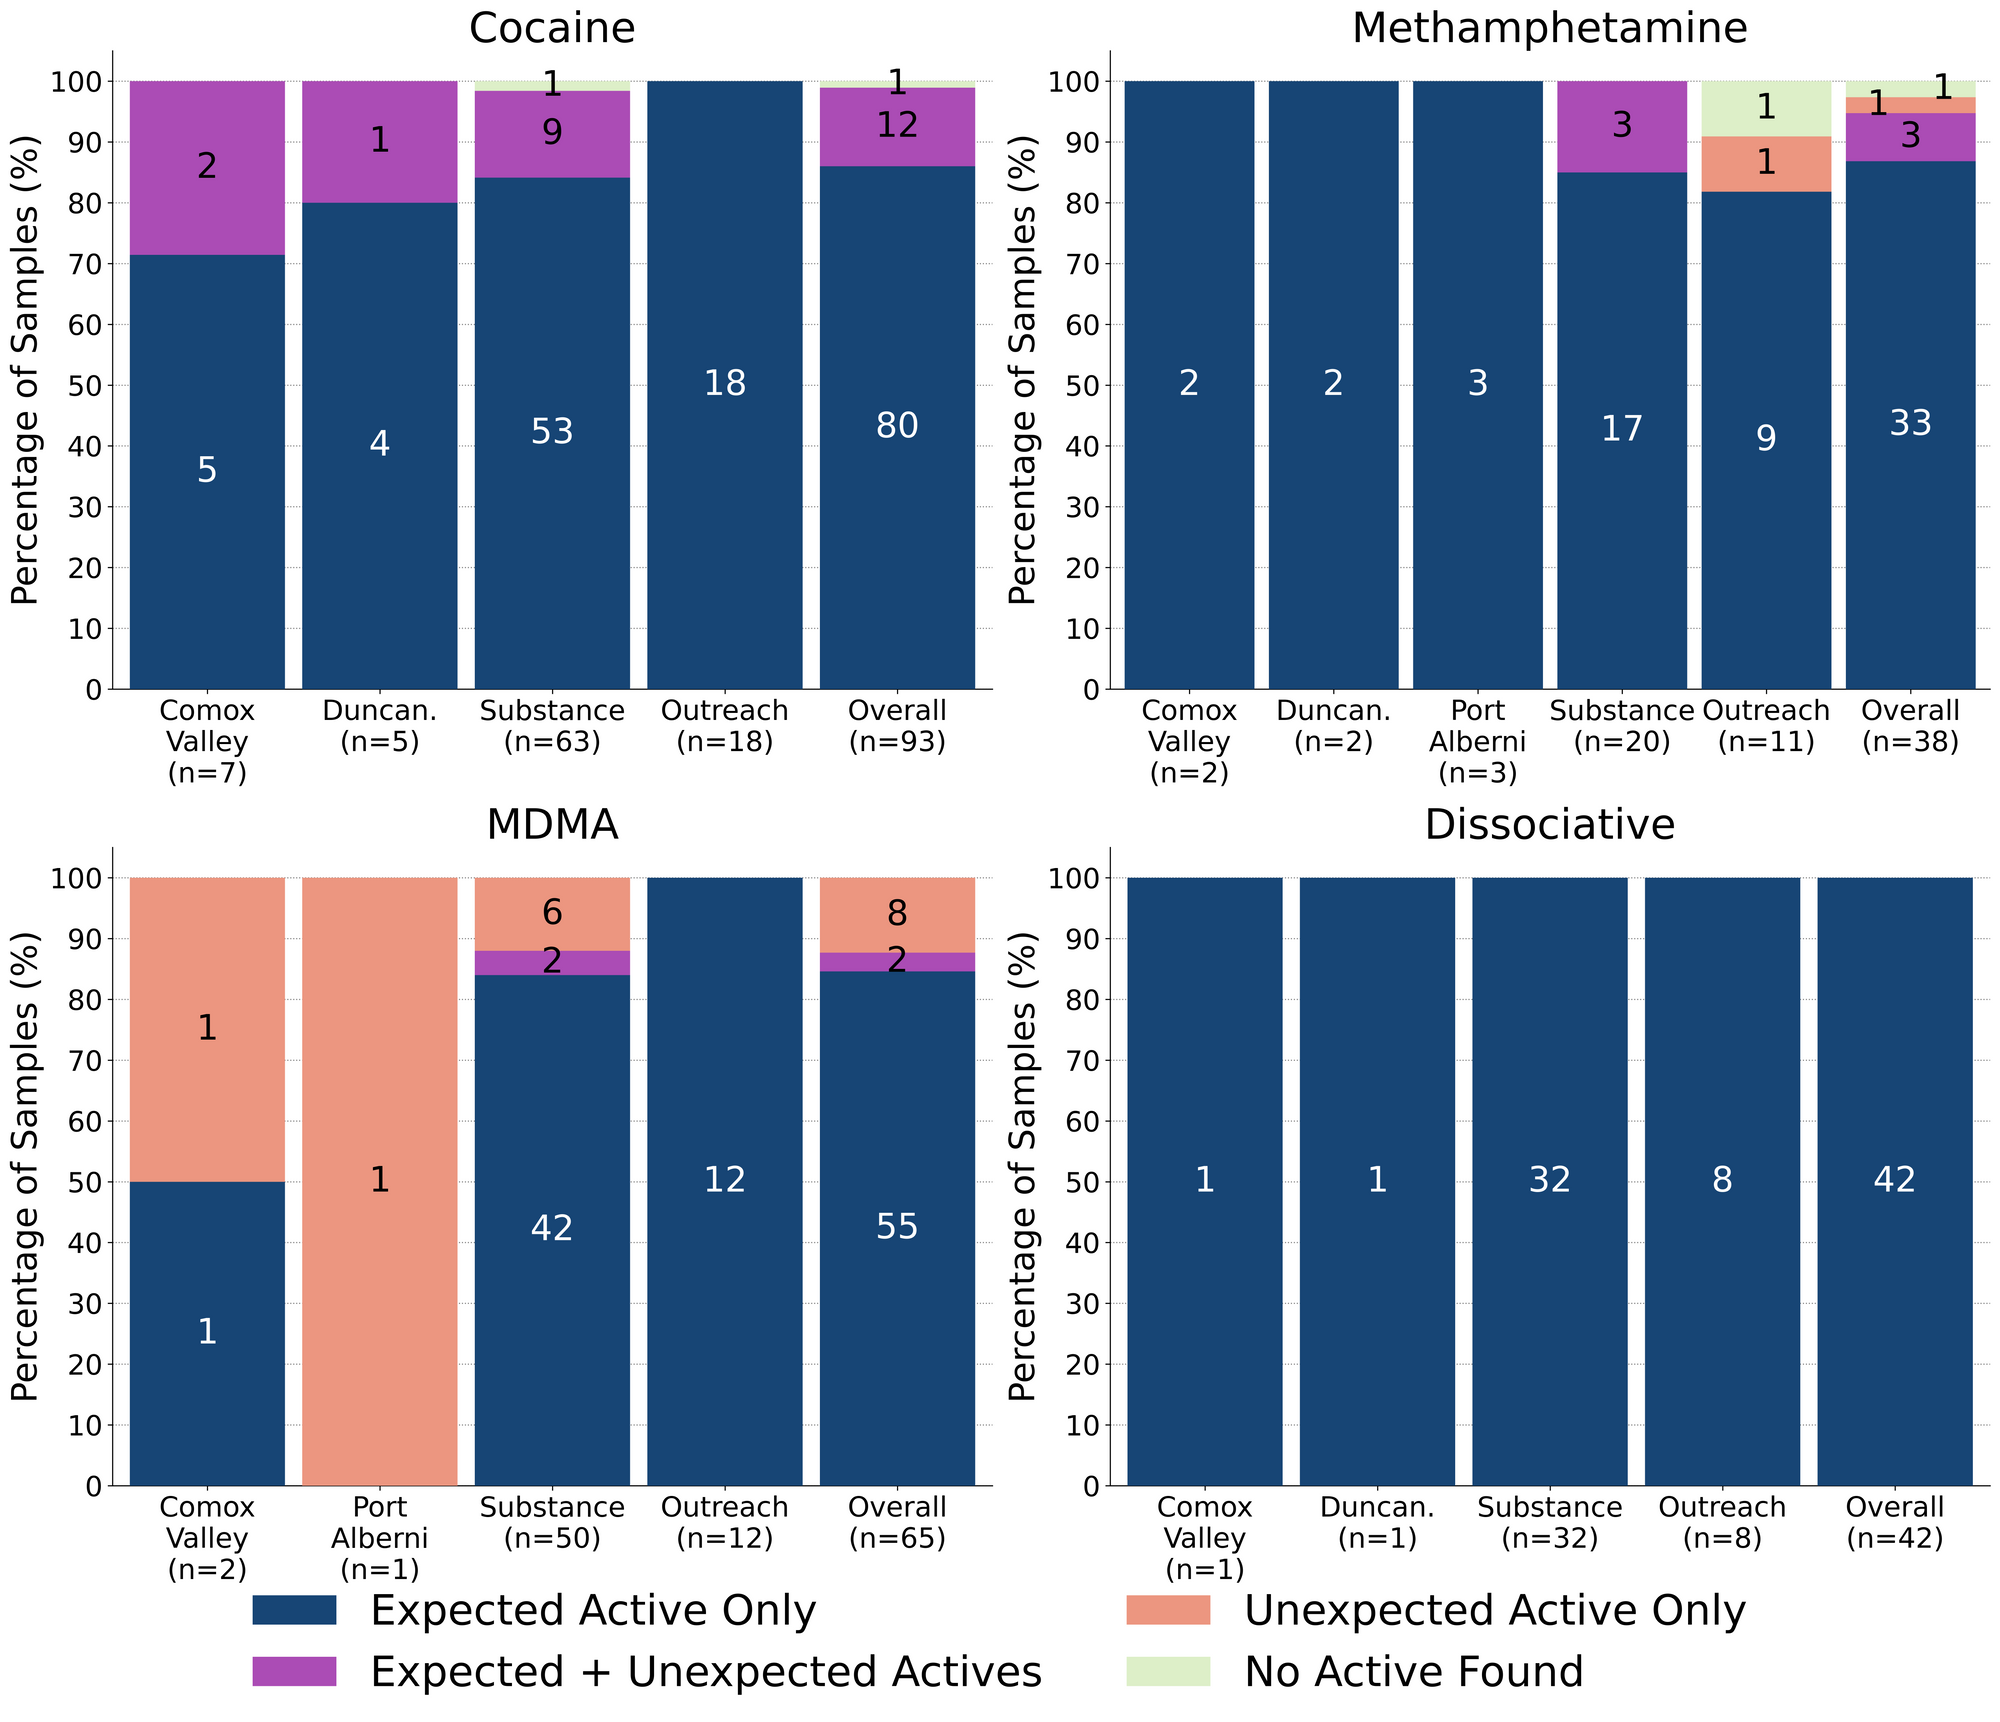
For a majority of samples checked, we confirm that the expected drug was indeed the only active and that no additional active compounds were present. The bar charts below highlight a few classes of drugs, differentiating samples when only the expected active was found from situations when other unexpected active components were detected.
K continues to be K! 100% (42/42) of expected ketamine samples checked in January were confirmed to be ketamine with no other active compounds detected. Inactive cuts were detected in three of these samples, with two samples from Victoria containing monosodium glutamate (MSG) as a cutting agent, and a sample from Duncan containing inositol (a sugar) as a cut.
87% (33/38) of expected methamphetamine samples checked were found to be meth with no other active compounds detected. Three of these samples contained inactive cuts, with caffeine detected in two samples and dimethyl sulfone (MSM) detected in another. All three cut samples were checked in Victoria. Active compounds, in addition to meth, were detected in three samples:
-
One sample from Victoria contained meth with cocaine detected at 10% by weight as well
-
Two samples from Victoria were found to contain meth with fentanyl detected as well
- In one sample, the contents were primarily meth, with a trace amount of fentanyl detected via mass spectrometry (less than 0.1% fentanyl). This sample was brought in alongside a baggie of “raw”/uncut fentanyl that was also being checked; we suspect trace cross-contamination occurred during sample transport
- The other sample was residue collected from a syringe and was found to contain meth along with 1% fentanyl, 0.5% fluorofentanyl, 1% bromazolam, caffeine and mannitol (a sugar). Given that this polysubstance mixture was brought to us inside a prepared syringe with little additional information, we cannot speculate as to where/when the meth + down mixture was prepared
The two remaining expected methamphetamine samples contained no meth. One was found to contain MDMA instead and the other appeared to just be a caffeine pill; both were checked in Victoria.
86% (80/93) of expected cocaine samples checked were confirmed to be cocaine with no active adulterants detected. Four of these samples were found to be cut, with caffeine detected in two samples, creatine detected in another, and inositol detected in the fourth; all four samples were checked in Victoria. 12 samples contained an active component in addition to cocaine:
- Benzocaine - 4 samples (1 from the Comox Valley and 3 from Victoria); a local anesthetic/numbing agent
- Fentanyl + Fluorofentanyl - 1 sample (Victoria). This expected cocaine base sample was found to primarily contain cocaine base, with fentanyl detected at 3%, fluorofentanyl detected at 1%, and caffeine found in small amounts as well
- Levamisole - 4 samples (all Victoria); an antihelminthic drug used to treat parasitic worm infections, commonly seen as a cut in cocaine
- One of the samples from Victoria also contained phenacetin
- MDMA - 1 sample (Comox Valley)
- Phenacetin - 3 samples (1 from Duncan and 2 from Victoria); “super buff” a tylenol-like drug, commonly seen as a cut in cocaine
- One sample also contained levamisole
The remaining cocaine sample did not contain cocaine or any other active compound and was found to be creatine powder.
85% (55/65) of expected MDA/MDMA samples checked were confirmed to be MDA (1 sample) and MDMA (54 samples), as expected. Tracking inactive cuts, eight MDMA samples were cut with caffeine. The remaining ten expected MDA/MDMA samples displayed a range of compositions:
- Six expected MDMA samples were found to be MDA instead. Five were checked in Victoria and the sixth was collected in the Comox Valley
- One expected MDA sample from Victoria was found to be MDMA instead
- One expected MDMA sample from Victoria was found to be a mixture of both MDA and MDMA
- One expected MDMA sample from Victoria was found to be a mixture of both MDMA and ketamine
- One expected MDMA sample from Port Alberni was found just to be methamphetamine
January saw a sharp increase in the number of expected GHB samples checked, compared to the past few months. Within the eight expected GHB samples checked, only one sample was just GHB, six (75%) were found to contain GHB and GBL, and one sample contained no GHB and was found to just be GBL. GBL is a prodrug of GHB, meaning it is converted into GHB in the body. GBL is typically dosed in smaller amounts than GHB, has a faster onset, and has a shorter overall duration. For those grappling for more than just the gist on “G”, check out these great guides by DanceSafe and TripSit.
Benzodiazepines (n=18)
67% (12/18) of the expected benzodiazepine samples checked in January came to our service site in Victoria in the form of pressed pills with the following expected and detected compositions:

Within the six remaining samples:
- One sample was confirmed to be bromazolam powder, as expected
- Two samples were confirmed to contain etizolam, as expected. These samples were brought in on perforated blotter paper labelled “ETIZOLAM”
- One powder sample was found to contain bromazolam. The service user expected a benzo but did not know which benzo could be present
- One powder sample was found to contain flualprazoalm. The service user expected a benzo but did not know which benzo could be present
- One powder sample contained no benzos and was found to be sodium bicarbonate (baking powder) instead
Opioid-Down (n=330)
In this section we present results specific to the opioid-down supply, therefore they may differ from the highlighted findings above that are inclusive of all expected drug categories.
- 93% of expected opioid-down samples contained fentanyl (308/330), with a median concentration of 10.9% and a range of 0.1% to >80%
- 8 samples contained heroin (2% of expected opioid-down samples), with a median concentration of 34.4% and a range of 24.9% to >80%:
- 3 samples were just heroin (and related alkaloids like acetylmorphine (MAM) and acetylcodeine). All were checked in Victoria
- 5 samples additionally contained fentanyl ranging from 5% to 21%.
- Etizolam was detected in four of these samples, with concentrations ranging from 0.3% to 24%
- 41% of expected opioid-down samples contained fluorofentanyl (136/330), with a median concentration of 4.2% and a range of 0.2% to >80%
- 3 samples contained carfentanil, with the following compositions:
- One sample (Victoria) contained carfentanil at 0.06%, fentanyl at 3.6%, fluorofentanyl at 1.6%, isotonitazene at 0.6%, bromazolam at 0.3%, and lidocaine at 0.2%
- One sample (Victoria) contained carfentanil at 0.11% and fentanyl at 0.75%
- One sample (Victoria) contained carfentanil at 0.59%, fentanyl at 1.0%, and bromazolam at 0.2%
- 43% of expected opioid-down samples contained a benzodiazepine and/or etizolam (141/330)
- Xylazine was detected in 3% (11/330) of opioid-down samples, with a median concentration of 9.1% and a range of 0.1% to 28.6%
In January, 64% (212/330) of all opioid-down samples checked contained an additional active to the expected fentanyl/heroin. The adulteration data is shown in Fig. 3 highlighting the prevalence of benzos, fluorofentanyl, and xylazine in the down supply
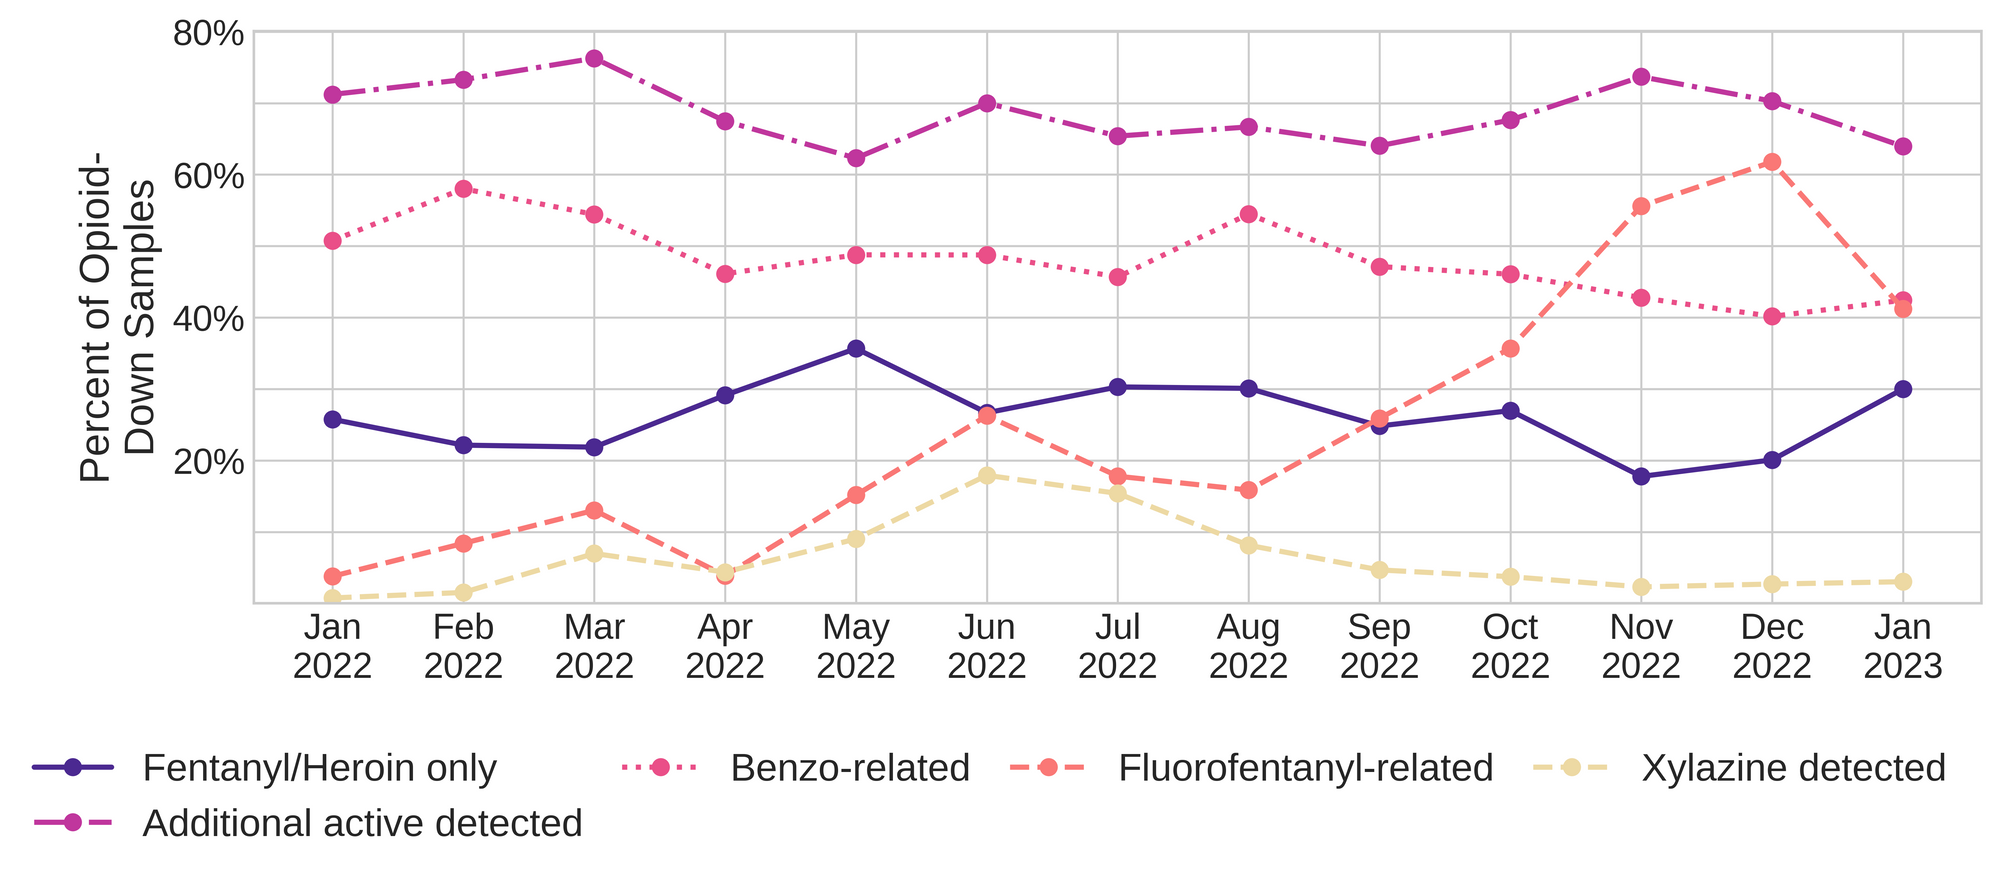
Fluorofentanyl was the most common additional active found within the opioid-down supply, with 38% (124/330) of opioid-down samples containing fluorofentanyl in addition to fentanyl. Additionally, fluorofentanyl was the only opioid detected in 4% (12/330) of opioid-down samples (i.e. no fentanyl or heroin was detected in these samples). The prevalence of fluorofentanyl in the down supply appears to be decreasing when compared to previous months (see Fig. 3), however, it is too early to tell if this is a trend or just another example of volatility in the unregulated supply.
Benzo-related drugs contribute to a majority of the other additional actives found in expected opioid-down samples, with 43% (141/330) of expected opioid-down samples checked containing a benzo-related drug. Bromazolam continues to be the most common benzo seen in the down supply, with bromazolam being detected in 72% of the benzo-positive opioid-down samples. Scattered detections of other drugs are still found and can be reviewed in the pdf report at the end of this blog.
Earlier in this blog post, we indicated that we, as a service, are feeling pretty good about the outlook in the new year, but, we as people who support those who use drugs are still feeling very queasy about the landscape that our service exists within. Turns out, our biliousness is not the result of the motion sickness expected from the daze of developments but is nausea spawned from the revolting stagnant mire that we find ourselves existing within for an eighth year: the drug poisoning public health emergency.
To our continued disgust, the rates of preventable illicit drug toxicity deaths remain extremely high in so-called “British Columbia”. According to the British Columbia Coroners Service 2022 annual report on illicit drug-related deaths in the Province, 2,272 people were lost in 2022 to preventable illicit drug poisoning and failed drug policy. Too many friends and family have left us and we mourn with our communities every day as we continue to experience the atrocities of a failed war on drugs and the people who use them.
We revisited this tragedy in our writing last year, the year before it, and at times in-between and we are absolutely sick of repeating ourselves yet again, another year later: Without an accessible safer supply, people who use drugs are left with no other options but to navigate a highly volatile and unregulated market. Samples like the carfentanil + fentanyl + fluorofentanyl + isotonitazene + bromazolam + lidocaine sample are completely unacceptable; people deserve better. They deserved better alternatives to the erratic illicit market eight years ago, they deserve better alternatives now.
Quantification for Expected Opioid-Down[1]
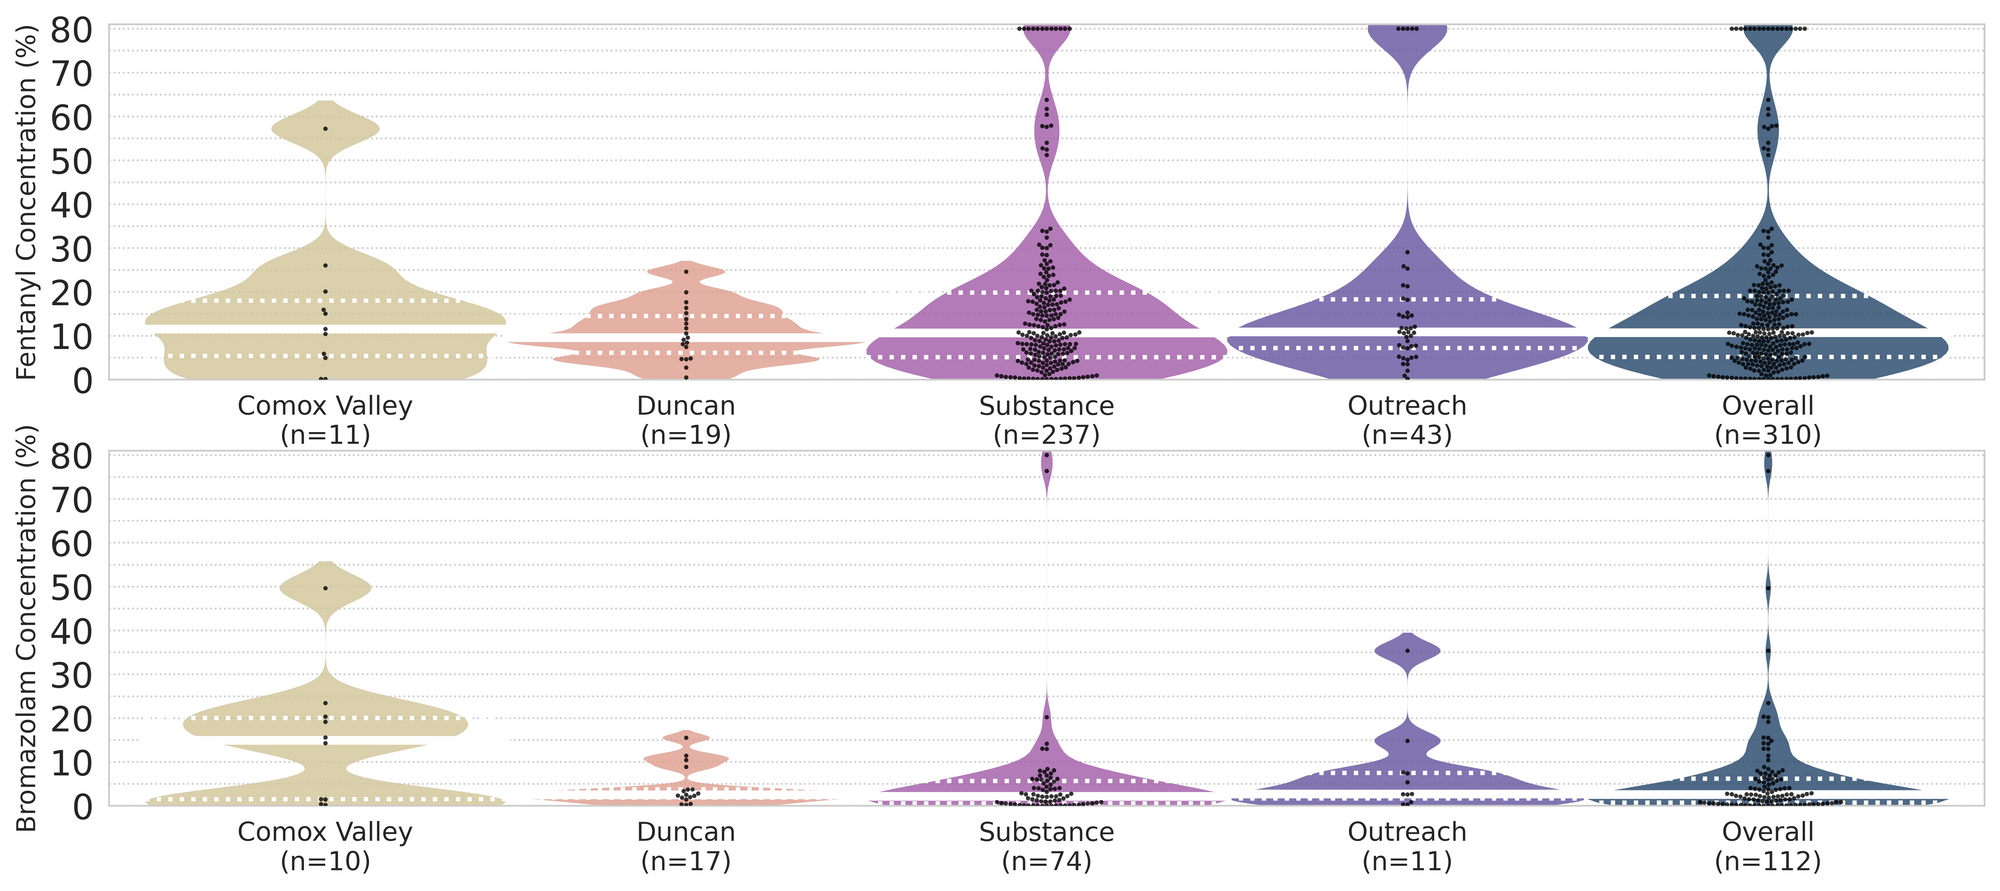
In January, we quantified fentanyl for 296 of the expected opioid-down samples containing fentanyl and found the median concentration to be 10.9%[2]. Though the median is a useful indicator, it doesn’t capture the volatility of fentanyl concentrations present in the opioid supply, as half of fentanyl-positive down samples contained between 5.9% and 19.6% fentanyl, and any one sample might be the lowest strength (0.1%) or the strongest (>80%[3]). Similarly, the concentration of bromazolam was across the board in expected opioid down samples, with samples ranging from 0.1% to 49.7% bromazolam, with a median of 2.6%.
Not all opioid down samples brought to our service can be quantified. This is primarily due to too limited sample collected for our instruments to report a reliable mass percentage. Nevertheless, qualitative detection is still possible. ↩︎
This number is specific to fentanyl quantified in opioid-down samples. The median concentration listed in the Key Findings at the beginning of this blog (10.7%) is inclusive of all samples checked, across all drug classes, that contained fentanyl. ↩︎
For samples that contain more than 80% fentanyl, or more than 25% etizolam by weight, our mass spectrometer is presently unable to reproducibly assign a concentration due to the upper limits of the calibration methods currently adopted. ↩︎

The fentanyl and bromazolam concentrations that we quantified in January, across all expected drug categories, are presented in Fig. 4. Black dots are individual opioid-down samples, Horizontal white bars show the median concentrations of fentanyl and bromazolam quantified, the width of the shaded regions mirrors the number of samples at a given concentration.
Want to be notified when we release these reports? Join our mailing list to receive updates about when our reports are out. You can subscribe and unsubscribe yourself from this list at any time.
Check back next month for the February report!
As always, send us feedback at substance@uvic.ca for how we can continue to offer our drug checking results in a useful way.