January 2022 Monthly Report

In this blog post we discuss our January 2022 report and provide more information on how to interpret the results. The PDF report can be found at the end.
Key findings:
- Carfentanil was found in three samples, all expected opioid-down
- 97% of expected opioid-down samples contained fentanyl
- The median fentanyl concentration found was 10.8%, with a maximum of over 80%
- Benzodiazepines and/or etizolam were found in 50.8% of expected opioid-down samples
- The maximum concentration of etizolam found was >25%, in an expected opioid-down sample
- W-19, a novel synthetic analgesic was detected in a sample with an “unknown” reported drug category
Insight for the January 2022 Monthly Report
The British Columbia Coroners Service has now released the 2021 annual report on illicit drug-related deaths in the Province and the report is truly devastating. 2,224 people were lost in 2021 to illicit drug toxicity and failed drug policy. That is 6 people taken from us every day by a preventable and resolvable crisis that has been allowed to perpetuate month after month, year after year.
In 2021, we reported on the parallels between our observations on the local drug supply and the post-mortem toxicology results of the 2020 Coroners report, and exhaustingly called for safe supply, decriminalization, and reduced barriers to harm reduction services. A year later and unfortunately the messages remain the same; now amplified by sustained calls from the Province’s own Coroners Service to end the crisis.. Rather than echoing our pleas for drug reform yet again, today we would like to join the reader in a moment of remembrance and reflection to grieve our family and friends who are no longer with us.
As we begin a new lap around the Sun, we carry with us the gravity of the ongoing emergency and work in earnest to support those impacted by this crisis.
Drug types
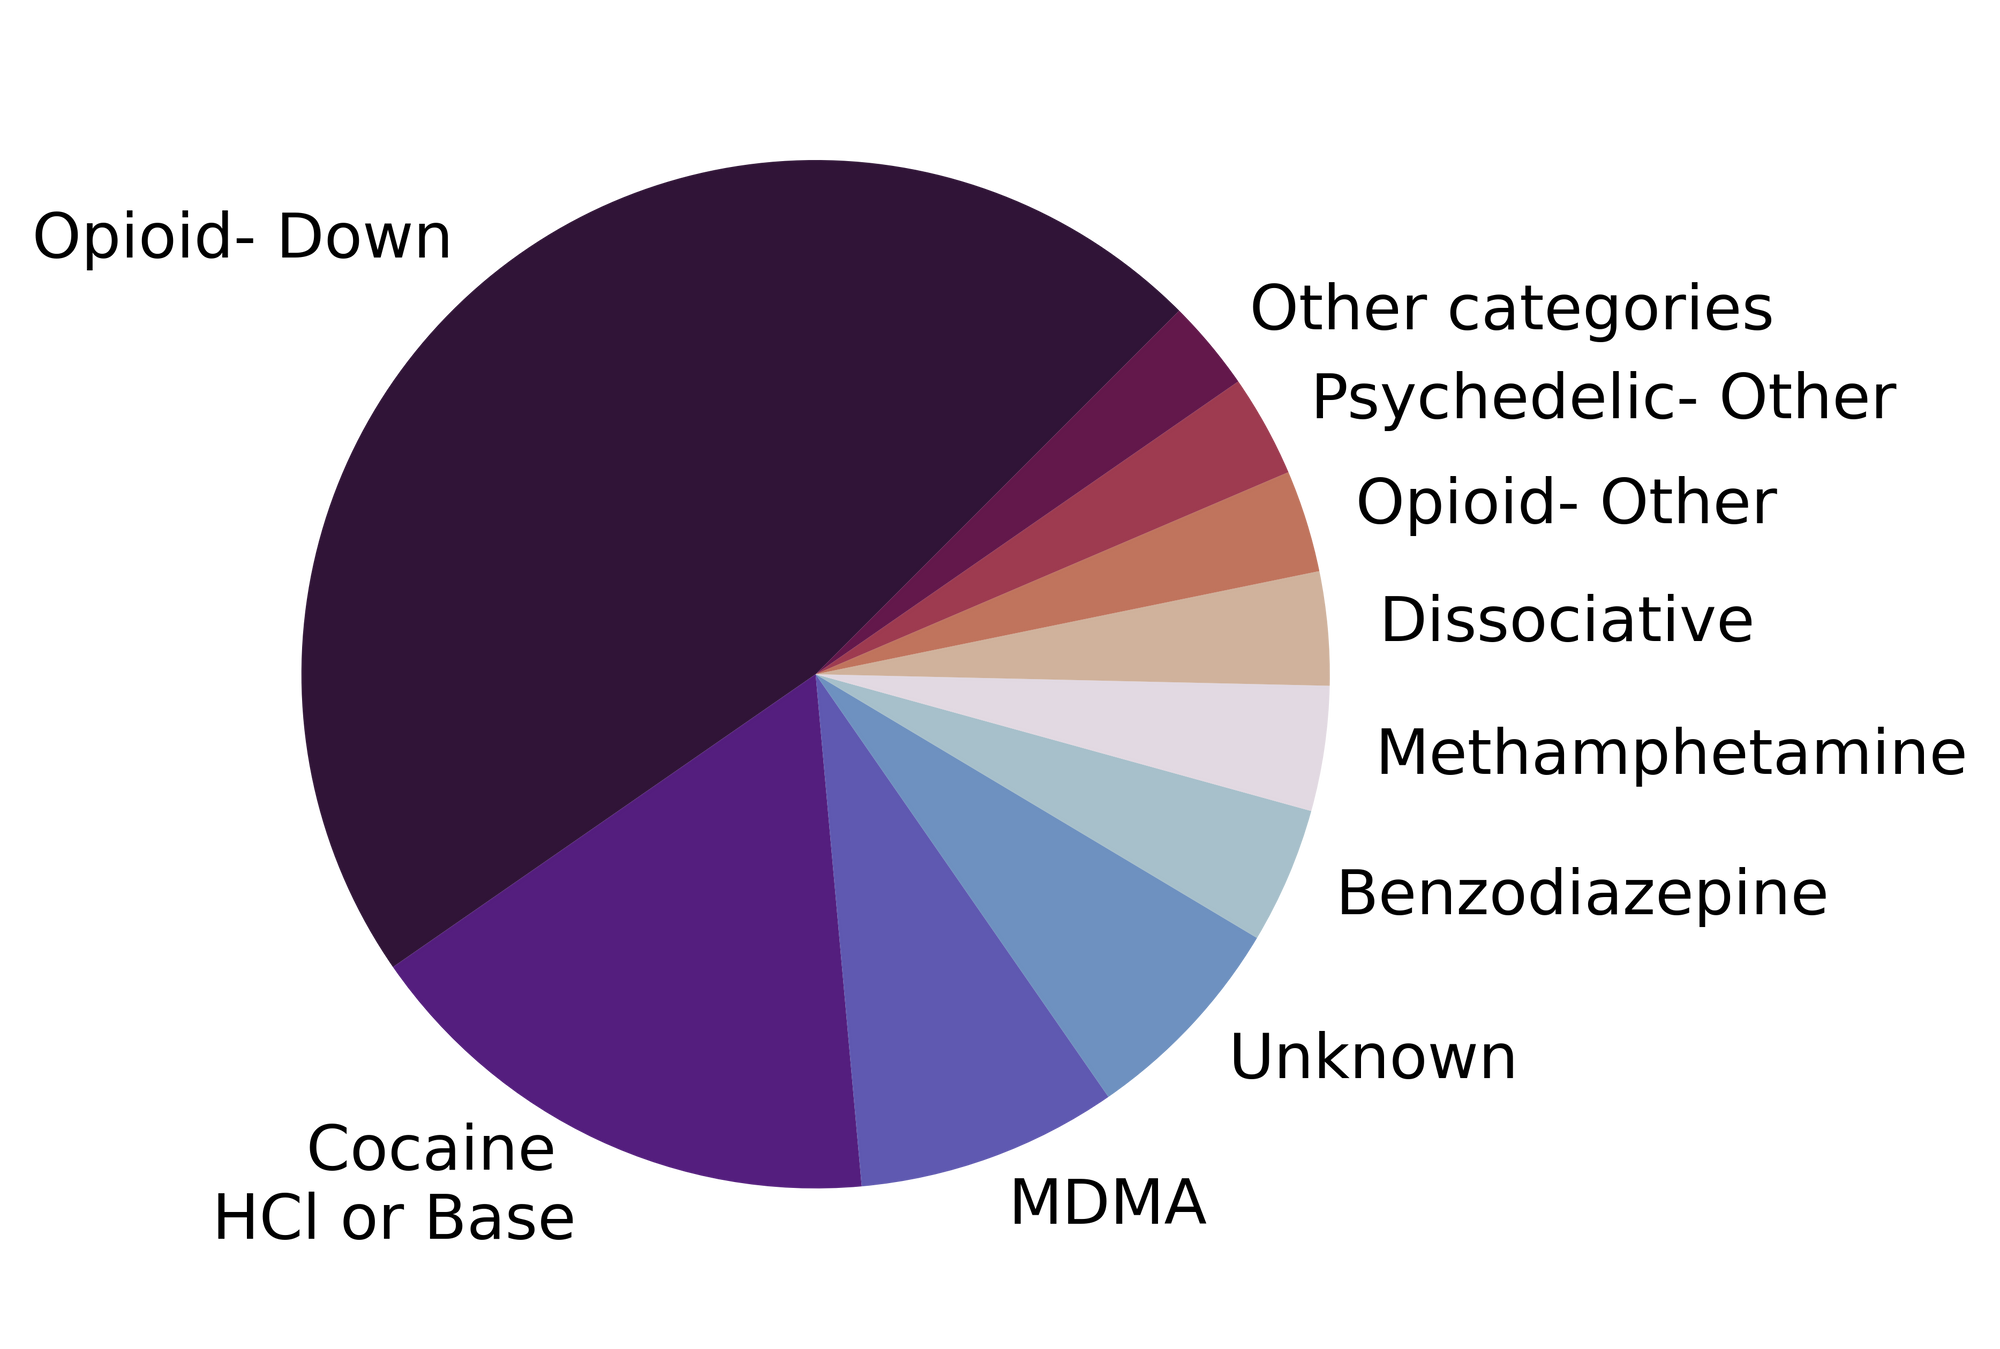
In January, we checked copious compounds, covering drug categories containing cocaine, caffeine, carfentanil, and countless other components. Alliterative attempts aside, our data were actually quite countable and are tabulated below. Fig. 1 shows the prevalence of each expected drug category checked.

Novel notables in the new year?
For a majority of samples checked, we confirm that the expected drug was indeed the only active and that no additional active compounds were present. The bar charts below highlight a few classes of drugs, differentiating samples when only the expected active was found from situations when other unexpected components were detected.
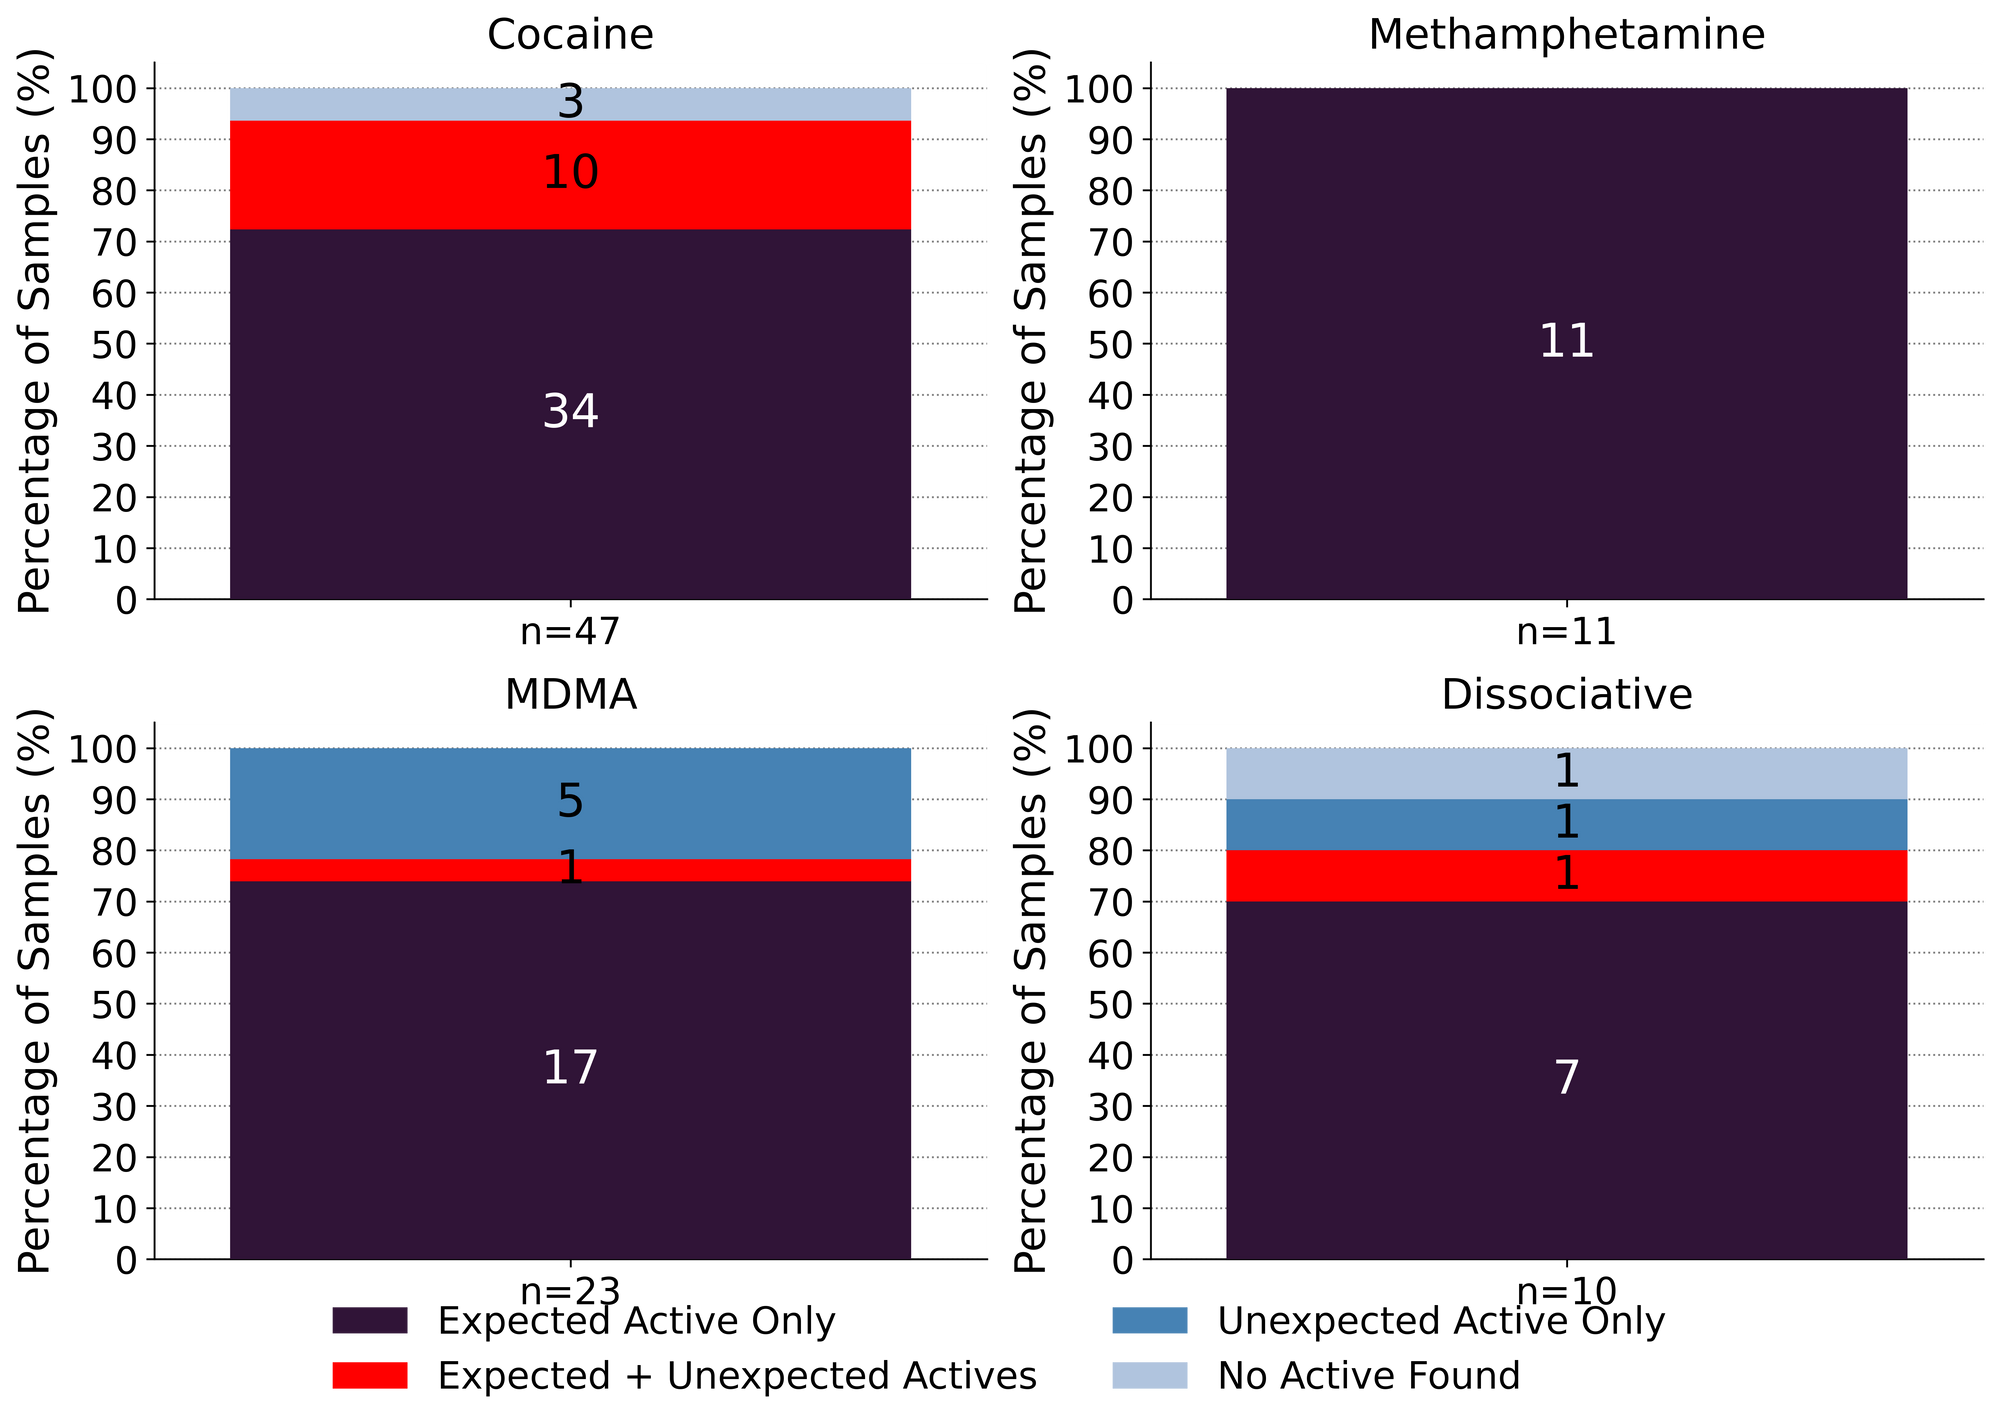
Our favourite song remains the same in the new year: “meth is meth”. 11 expected methamphetamine samples were checked in January and 11 were found to be meth as a single component, no cuts or buffs detected.
Ketamine held its role as the primary representative of the dissociative class in January. 7 samples were found to be ketamine, as expected, with no other components found. 1 expected ketamine sample was found to contain both ketamine and 2-fluorodescholoketamine (2-FDCK, a novel dissociative closely related to ketamine with comparable dosage and effect), 1 expected ketamine sample was instead found to be methamphetamine, and the final expected ketamine sample was found to be isopropylbenzylamine (see Spotlight Sample 1 below).
Spotlight Sample 1
Sparkly shards got you seeing stars? Many samples brought to our service have very similar visual appearances that can bamboozle even the most seasoned drug inspection experts. Picture, if you will, a gleaming crystalline solid reminiscent of miniaturised basalt columns made of glittering glass. Is it ketamine? Maybe it’s meth? Fortunately, our spectrometers are far more difficult to hoodwink and the true identity is revealed: isopropylbenzylamine. Not associated with any psychoactive effects, this compound has a role as an intermediary in organic compound synthesis, and a history as a cutting agent in methamphetamine due to similar physical properties.
MDMA and MDA continued their paired party into the new year. 78% (14/18) of expected MDMA samples checked were confirmed to be MDMA while the remaining 22% (4/18) were found to be MDA instead. Similarly, 60% (3/5) of expected MDA samples checked in January were found to be MDA, while the remaining two samples were found to be MDMA and MDA+MDMA.
Spotlight Samples 2
Don’t let Shakespeare’s adage “all that glitters is not gold” discourage you in your pursuit for pleasure treasure, especially since not all that is gold glitters. If you find yourself on a quest for MDMA, there may be diamonds in the rough: of the expected MDMA samples checked that were confirmed to be MDMA as a single component, the visual appearance varied greatly. Murky brown chunks, sparkly white powders, and purple crystals have all been identified as simply MDMA.
47 expected cocaine samples were checked in January. 72% (34/47) were found to only contain cocaine (or cocaine base) as a single ingredient. 10 samples contained an active component in addition to cocaine, with the additional actives representing a suite of different drug categories:
- Levamisole - 3 samples; an antihelminthic drug used to treat parasitic worm infections, commonly seen as a cut in cocaine
- Phenacetin - 3 samples; an acetaminophen (Tylenol)-like drug, colloquially referred to as “superbuff”
- Two of the above samples contained both levamisole and phenacetin
- Benzocaine - 2 samples; a topical local anaesthetic
- Amphetamine - 1 sample
- Acetaminophen - 1 sample; this sample also contained levamisole and phenacetin
- 2C-H - 1 sample, a lesser-known phenethylamine that lacks the psychedelic properties typically associated with other 2C-x drugs
- Fentanyl - 2 samples; both samples tested positive for fentanyl via immunoassay strip test, but no fentanyl was detected on our instruments. We suspect sample cross contamination due to shared baggies in both cases.
The remaining 3 expected cocaine samples checked in January did not contain cocaine or any other active compounds and were found to be caffeine.
Benzodiazepines (n=12)
12 pressed pill samples expected to be alprazolam (Xanax) were checked in January and all 12 samples did not contain the expected active (alprazolam). Instead, 11 were found to contain a different benzodiazepine: 8 contained etizolam, 2 contained flubromazolam, and 1 contained flualprazolam. Despite alprazolam, etizolam, and flualprazolam all having a similar duration of effect (around 5-7 hours), flualprazolam is around twice as potent as alprazolam, while etizolam is around half as potent (i.e. 0.5mg flualprazolam ~ 1mg alprazolam ~ 2mg etizolam). Flubromazolam, on the other hand, is remarkably potent, active at 0.1mg with effects lasting up to 18 hours. One pill contained no active ingredients at all and appeared to just be lactose (a sugar pill).
As we have reported before, these results were not unexpected to the majority of the service users who brought in these samples. In many cases, the “expected active” is based on the visual appearance of the tablet (e.g. a white bar with “X|A|N|A|X” stamped on it), even though service users regularly suspect otherwise based on their invaluable experiential knowledge of the drugs they use and the markets from which they come. Hopefully our services can help folks add a name (and correspondingly appropriate dosage) to their experiences.
Opioid-Down (n=132)
In this section we present results specific to the opioid-down supply, therefore they may differ from the highlighted findings above that are inclusive of all expected drug categories.
- 97% of expected opioid-down samples contained fentanyl (128/132)
- Of the remaining 4 samples, 1 sample contained no opioid and was found to be benzocaine, and 3 sample contained no active compounds
- Heroin the primary active found in 2 samples at concentrations of 32.4% and >80%
- Fentanyl was additionally detected in these samples at 4% and 1%, respectively
- Three samples contained carfentanil in the month of January
- 51% of expected opioid-down samples contained a benzo and/or etizolam (67/132)
- Xylazine was detected in 1 opioid-down sample, with a concentration of 2.1%
This January, 71% of all opioid-down samples checked contained an additional active to the expected fentanyl and/or heroin. Examining the past year of data (Fig. 3), we can see this level of adulteration is consistent within the inconsistent down supply.
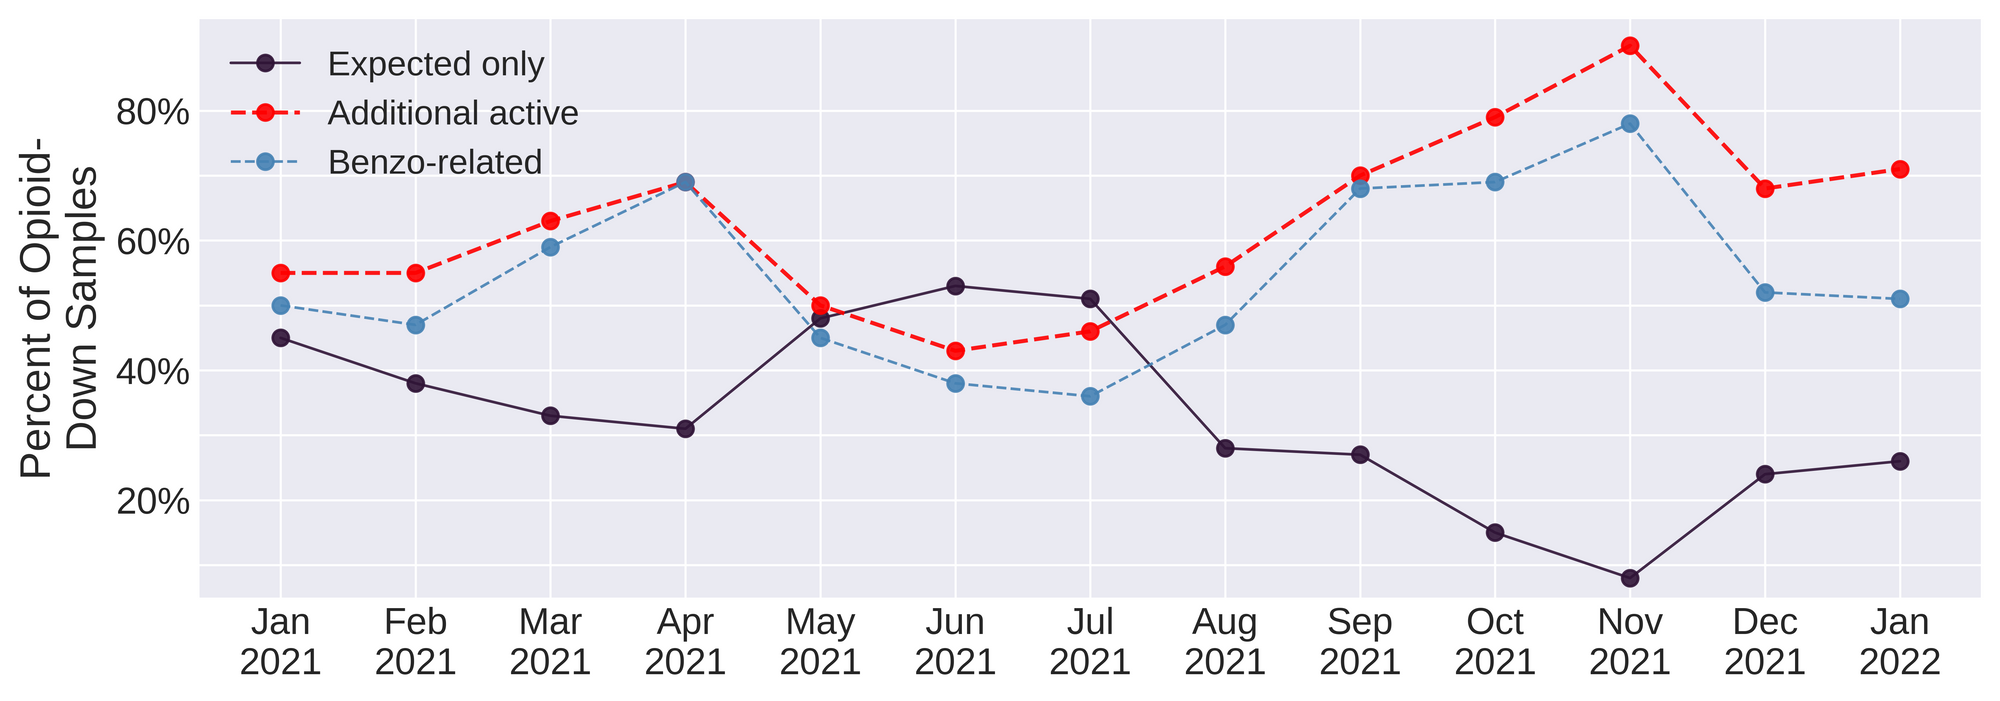
Benzo-related drugs remain the primary contributor to the additional actives found in expected opioid-down samples with 51% (67/132) of the total expected opioid-down samples checked containing a benzo-related drug.
After more than a year of the same messaging, we feel like a broken record: it is long past time we listen to the people who use drugs who have been pointing to the remedies to this unregulated supply for years. As Chief Coroner Lisa Lapointe points out, safer supply and decriminalization are effective interventions in the unregulated market, and the ever increasing number of deaths associated with this unpredictable market amplifies the immediacy of this needed reform.
Quantification for Expected Opioid-Down[1]
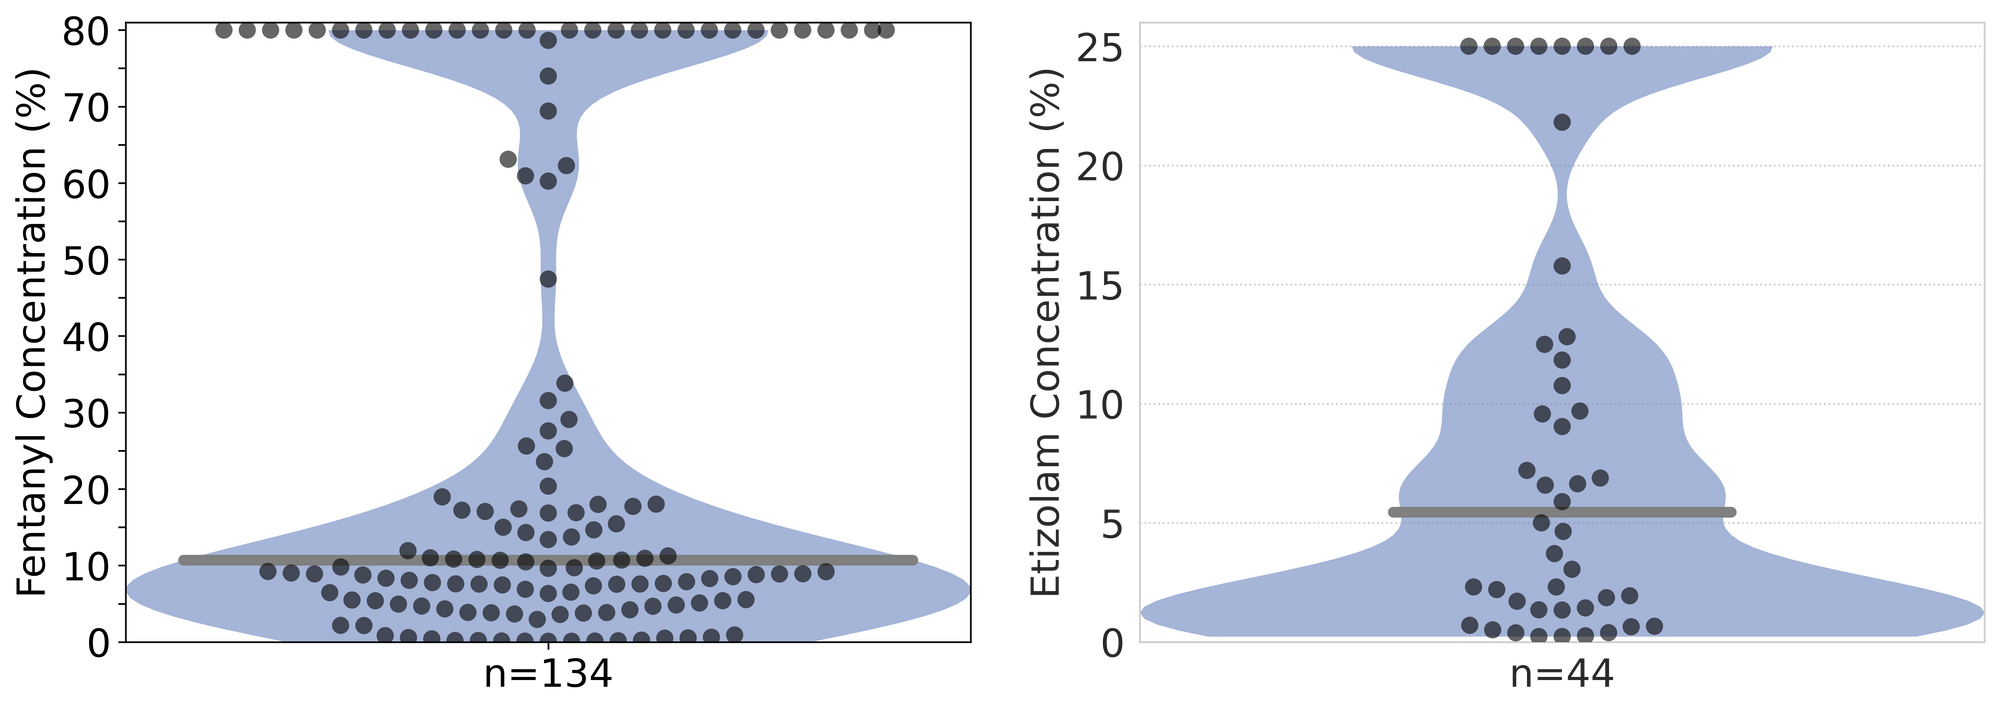
In January, we quantified fentanyl for 127 of the expected opioid-down samples containing fentanyl and found the median concentration to be 10.5% with the average strength of fentanyl we normally see being around 10% as well. Though the median is a useful indicator, it doesn’t capture the volatility of fentanyl concentrations present in the opioid supply, as any one sample might be the lowest strength (0.1%) or the strongest (>80%[2]). Similarly, the concentration of etizolam was across the board in expected opioid down samples, ranging from 0.2% to >25%[2:1], with a median of 6.8%.
Not all opioid down samples brought to our service can be quantified. This is primarily due to too limited sample collected for our instruments to report a reliable mass percentage. Nevertheless, qualitative detection is still possible. ↩︎
For samples that contain more than 80% fenanyl, or more than 25% etizolam by weight, our mass spectrometer is presently unable to reproducibly assign a concentration due to the upper limits of the calibration methods currently adopted. ↩︎ ↩︎

The fentanyl and etizolam concentrations that we quantified in down samples checked in January are presented in Fig. 4. Black dots are individual opioid-down samples, Horizontal grey bars show the median concentrations of fentanyl and etizolam quantified, the width of the shaded regions mirrors the number of samples at a given concentration.
January 2022 was a particularly notable month in terms of very high concentration opioid-down samples, with 29 samples (22% of the total opioid-down samples checked) containing fentanyl at concentrations above 80%. Based on our survey data, we suspect many of these samples are not directly reflective of the consumer market and instead are being brought in by people within the supply chain. Knowledge about drug composition is not only valuable to the end consumer, but also to the provider in regards to quality control, market intervention, and expanded reach of harm reduction practices. We refer the reader to Larnder et al. 2021 for our findings and insights on the significant value that third party drug checking has as a harm reduction practice, as well as to Bardwell et al. 2019, Long et al. 2020, Kolla & Strike 2020, Betsos et al. 2021, and Wallace et al. 2021 for further discussion on the importance of collaborative drug checking with people who sell drugs as an effort to reduce harms.
Want to be notified when we release these reports? Join our mailing list to receive updates about when our reports are out. You can subscribe and unsubscribe yourself from this list at any time.
Check back next month for the February report!
As always, send us feedback at substance@uvic.ca for how we can continue to offer our drug checking results in a useful way.