August 2022 Monthly Report

In this blog post we discuss our August 2022 report and provide more information on how to interpret the results. The PDF report can be found at the end.
Key findings:
- The median fentanyl concentration found, across all expected drug categories, was 12.6%, with a maximum of over 80%
- Carfentanil was found in 7 samples (6 opioid-down, 1 expected benzodiazepine) with a median concentration of 0.30% and maximum concentration of 1.19%
- Benzodiazepines and/or etizolam were found in 55% of expected opioid-down samples
- The median concentration of bromazolam, the most common benzodiazepine found across all expected drug categories, was 2.5%, with a maximum of 64.7%
- Xylazine, a veterinary sedative, was found in 20 (8%) of expected opioid-down samples with a median concentration of 0.5% and a maximum concentration of 5.0%
Insight for the August 2022 Monthly Report
August brought the most sweltering days of “hot girl summer” for many, and for us at Substance, August was the peak of our own “perspiring person period”. It was easy for us to work up a sweat in August, whether that sweat was beading on our foreheads from feverishly flaying open fentanyl strip tests to keep up with the flux of 583 samples, dripping on the dance floor post pop-up drug checking, or pooling in our palms in sickening, clammy disgust as we screamed with rage and sorrow on Overdose Awareness Day in remembrance of our loved ones lost to drug poisoning and failed drug policy. The juxtapositions of focus and fervency, felicities and fury, and festivals and funerals experienced in August encapsulate the environment that our project exists within. This turbulent energy drives us to perpetually improve our services and strengthen our relationships with the communities that we serve, collaborate with, and receive support from.
As before, this blog, and the associated pdf report, breakdown our sample counts into five categories:
-
samples received through direct service provision in Victoria, where service users are bringing samples into the Substance storefront. These samples are labelled as “Substance” samples in the figures/tables of this blog post
-
samples received through direct service provision in Campbell River, where service users are bringing samples to the Vancouver Island Mental Health Society (VIHMS). These samples are labelled as “Campbell River” samples in the figures/tables of this blog post
-
samples received through direct service provision in the Comox Valley, where service users are bringing samples to AVI Health & Community Services in Courtenay, BC. These samples are labelled as “Comox Valley” samples in the figures/tables of this blog post.
-
samples received through direct service provision in Port Alberni, where service users are bringing samples into PASS’s OPS. These samples are labelled as “Port Alberni” samples in the figures/tables of this blog post.
-
samples received through indirect service provision, where samples are being collected through no contact drop-off envelopes, mail-in envelopes, or are being collected by harm reduction workers and/or other community members at supported housing sites, at overdose prevention sites, and supervised consumption locations. August’s outreach data also includes samples collected during pop-up drug checking at the Phillips Brewing Backyard Implosion Explosion festival, Footwork Entertainment Summer Social festival, Plant Based Productions Plants ’N Animals festival, and during community-embedded tabling on Overdose Awareness Day. These samples are labelled as “Outreach” samples in the figures/tables herein.
Drug types
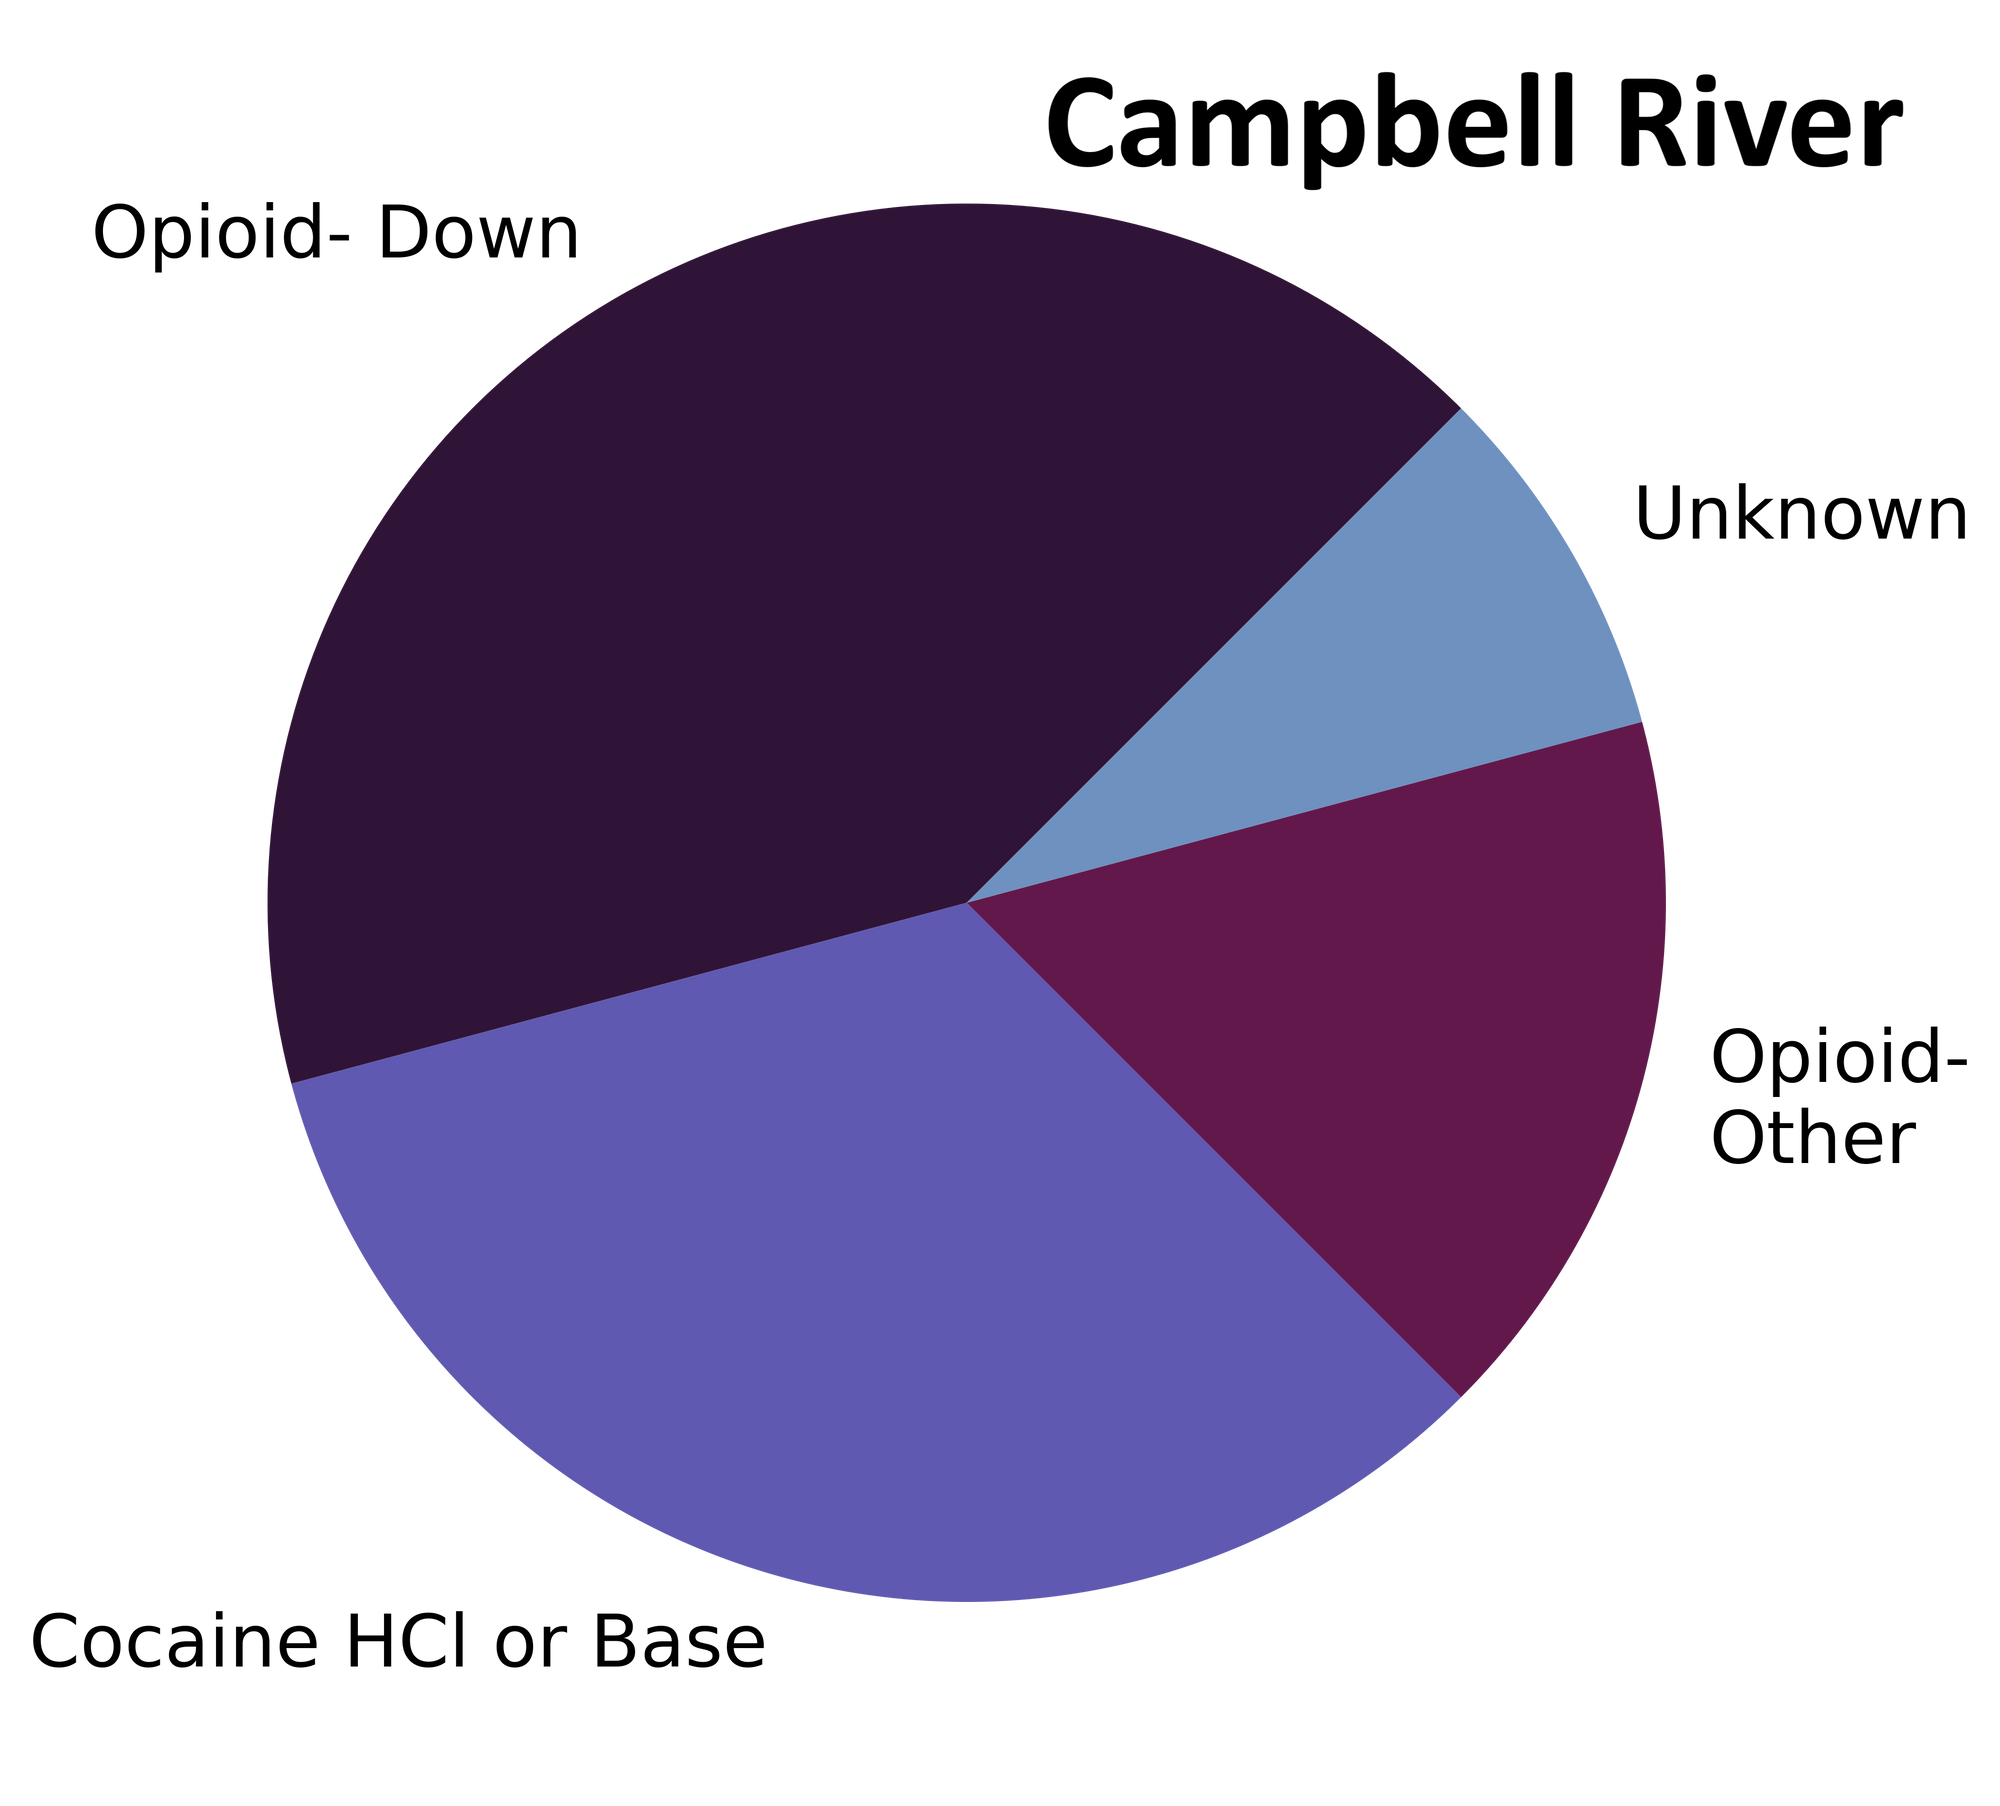
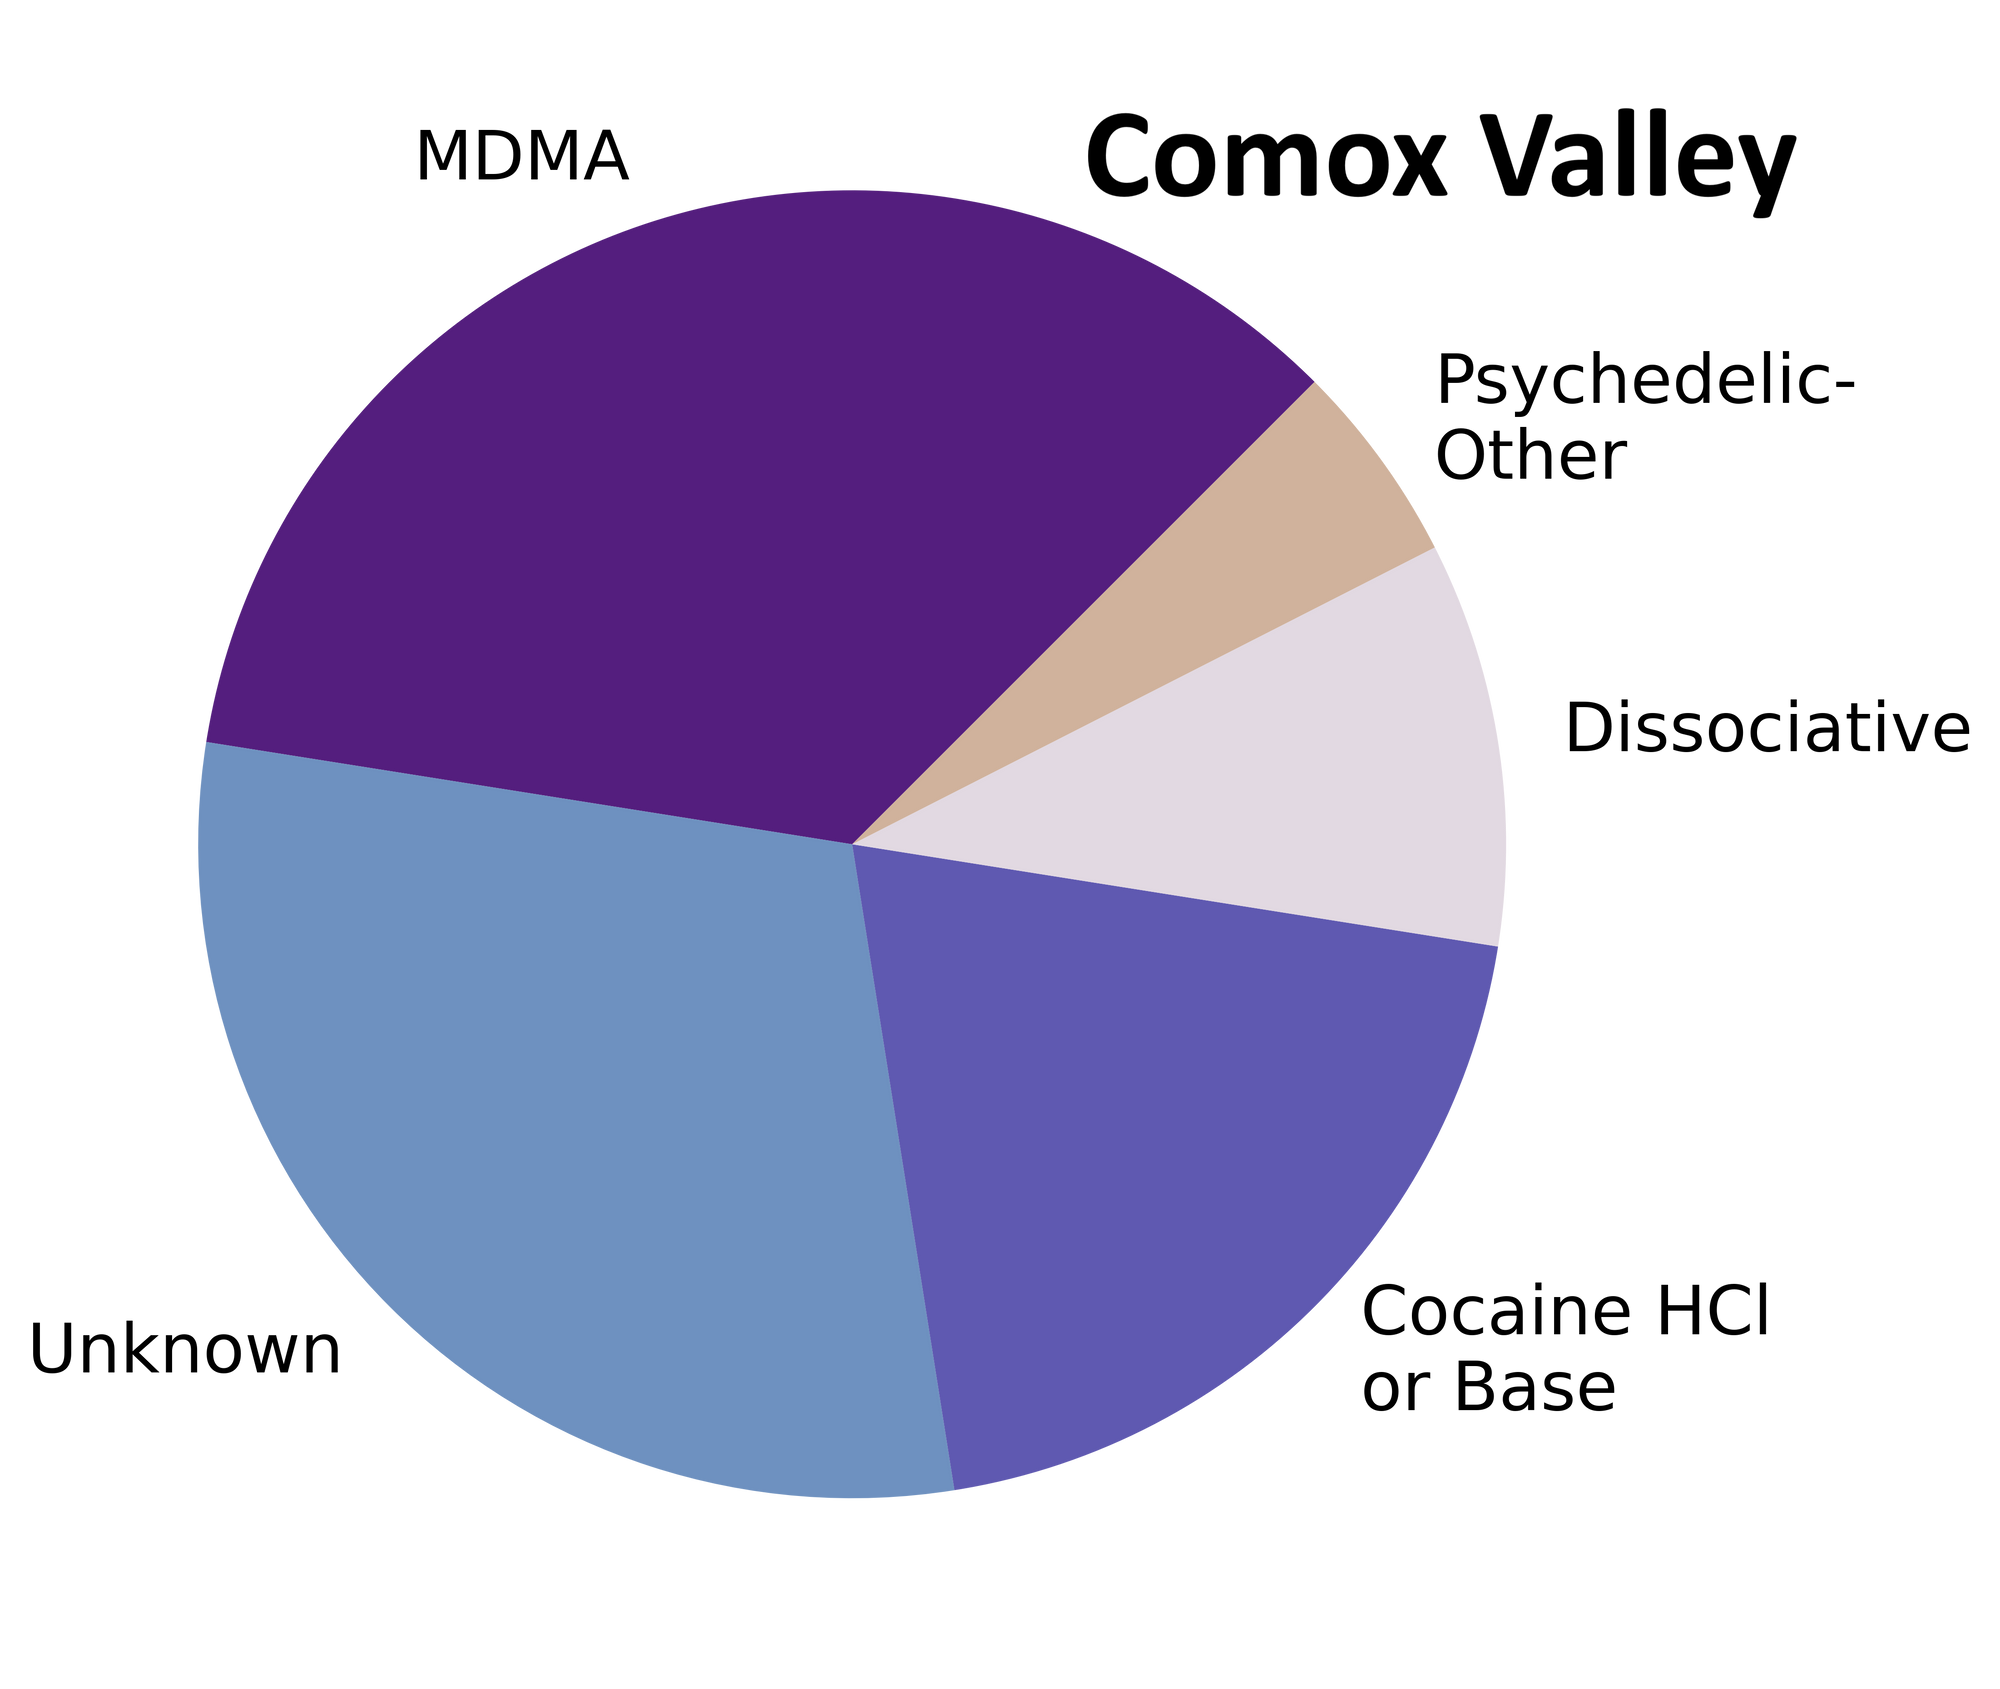
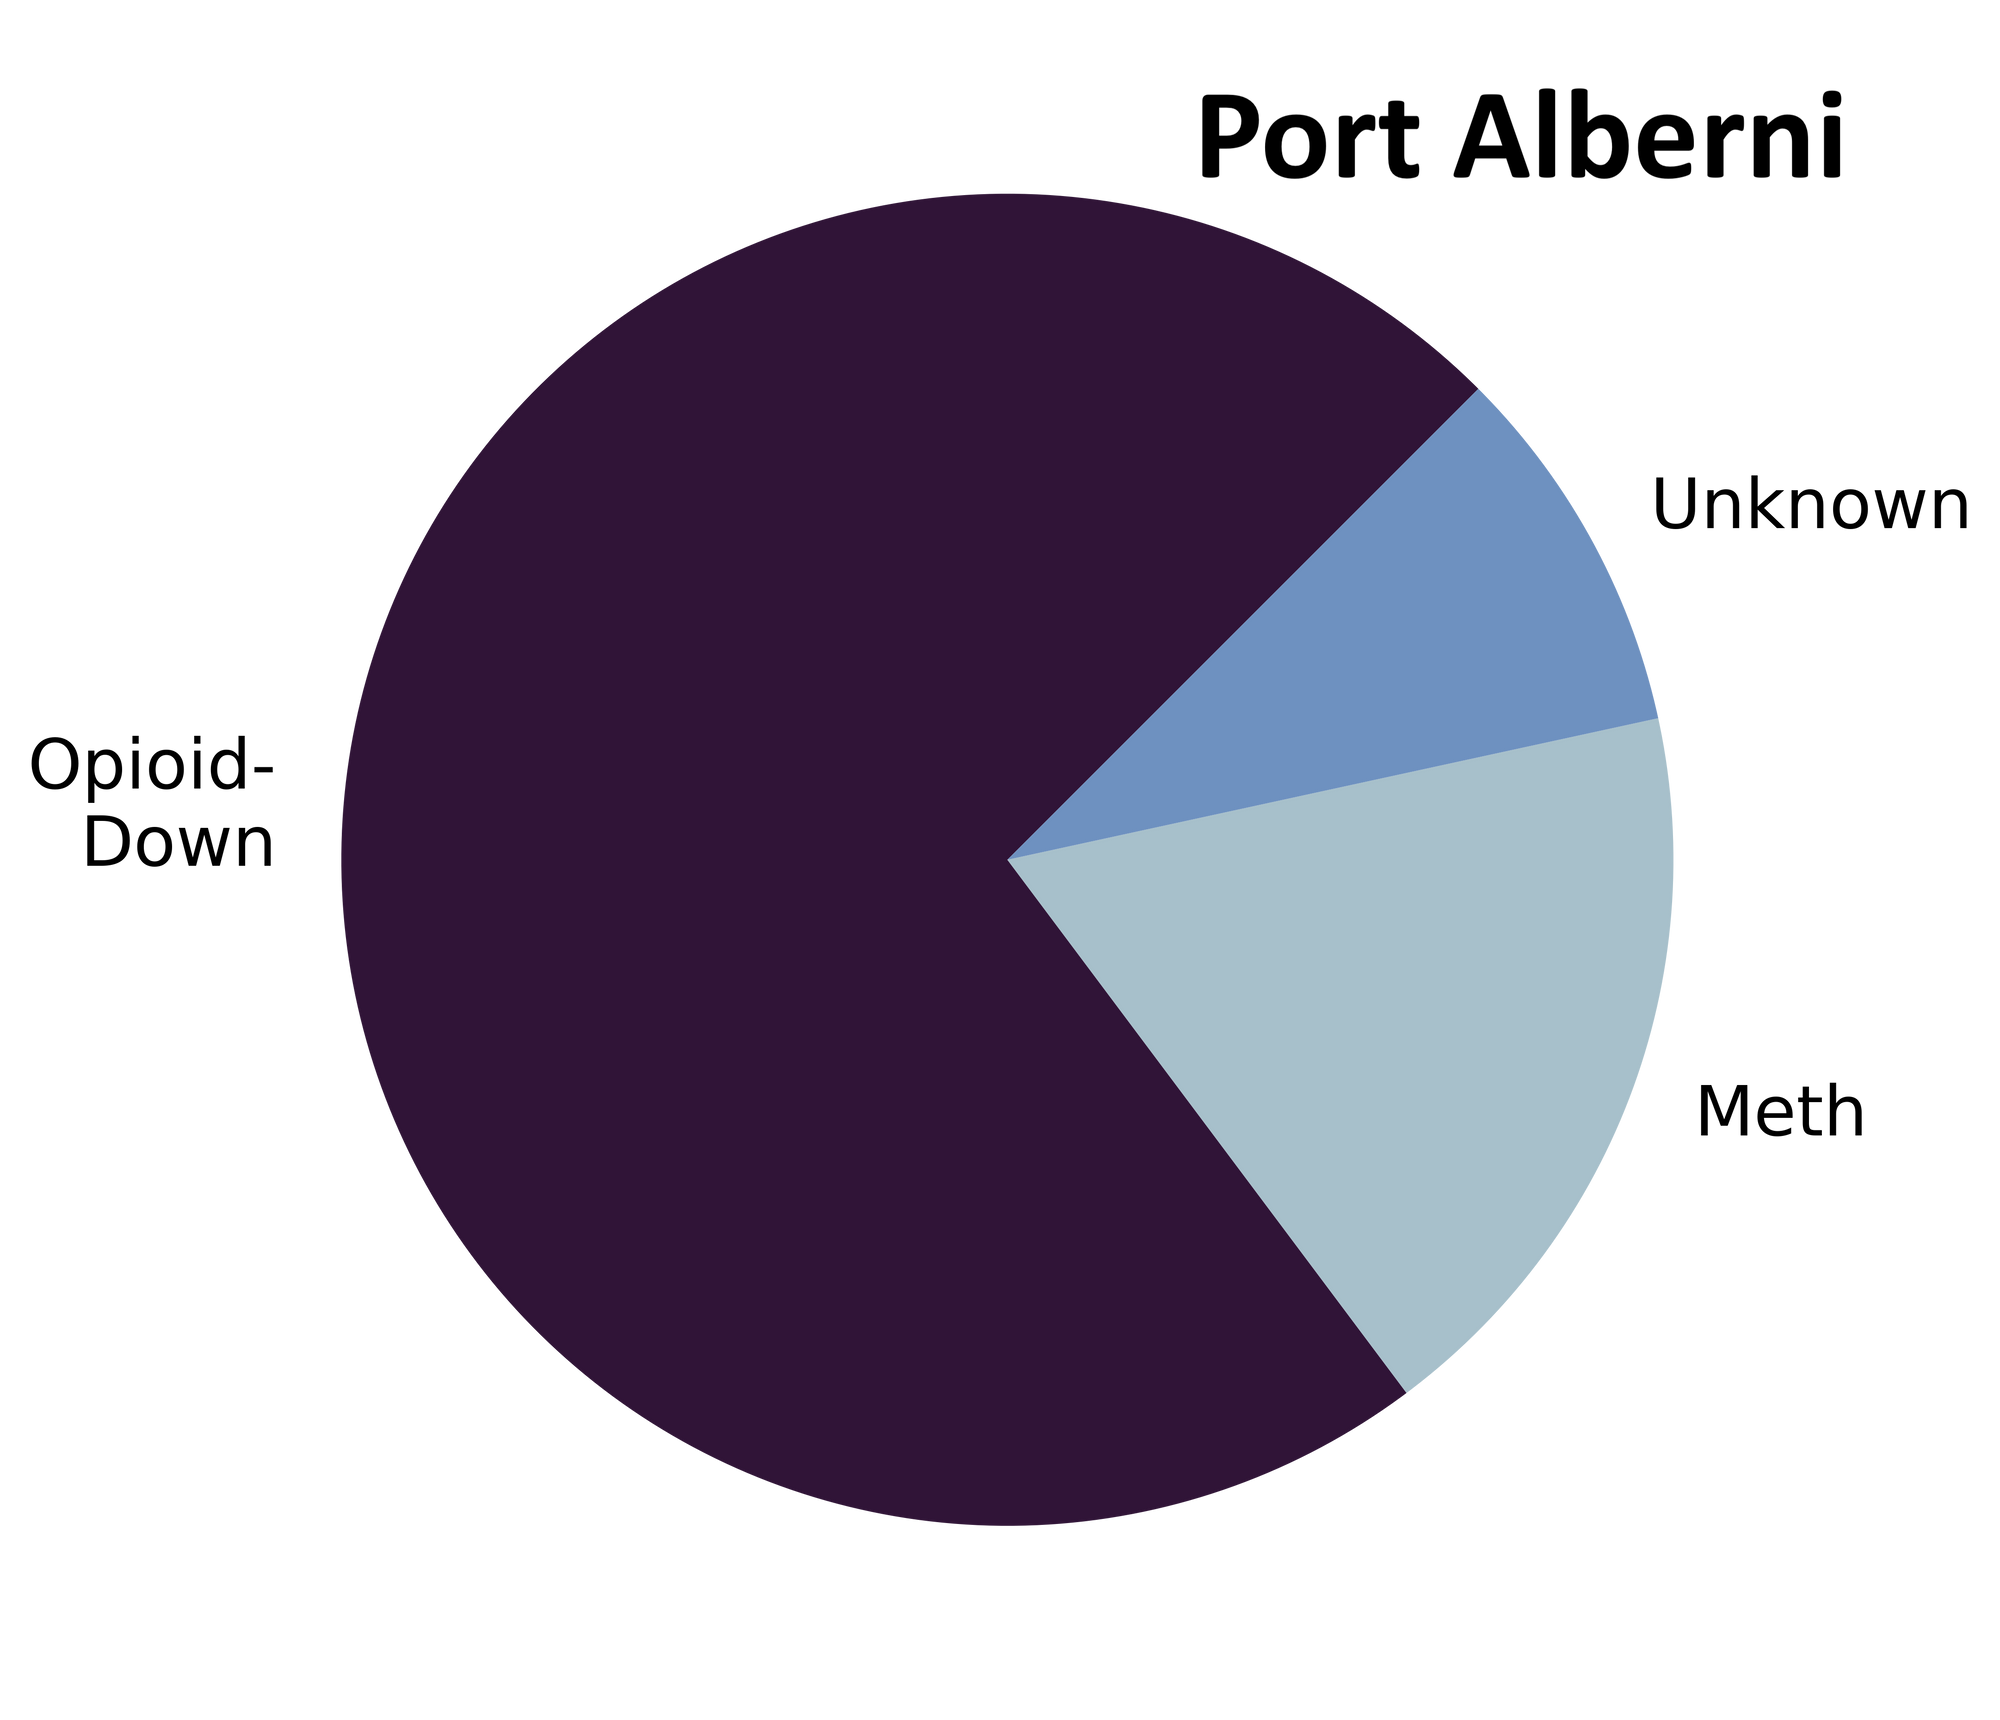
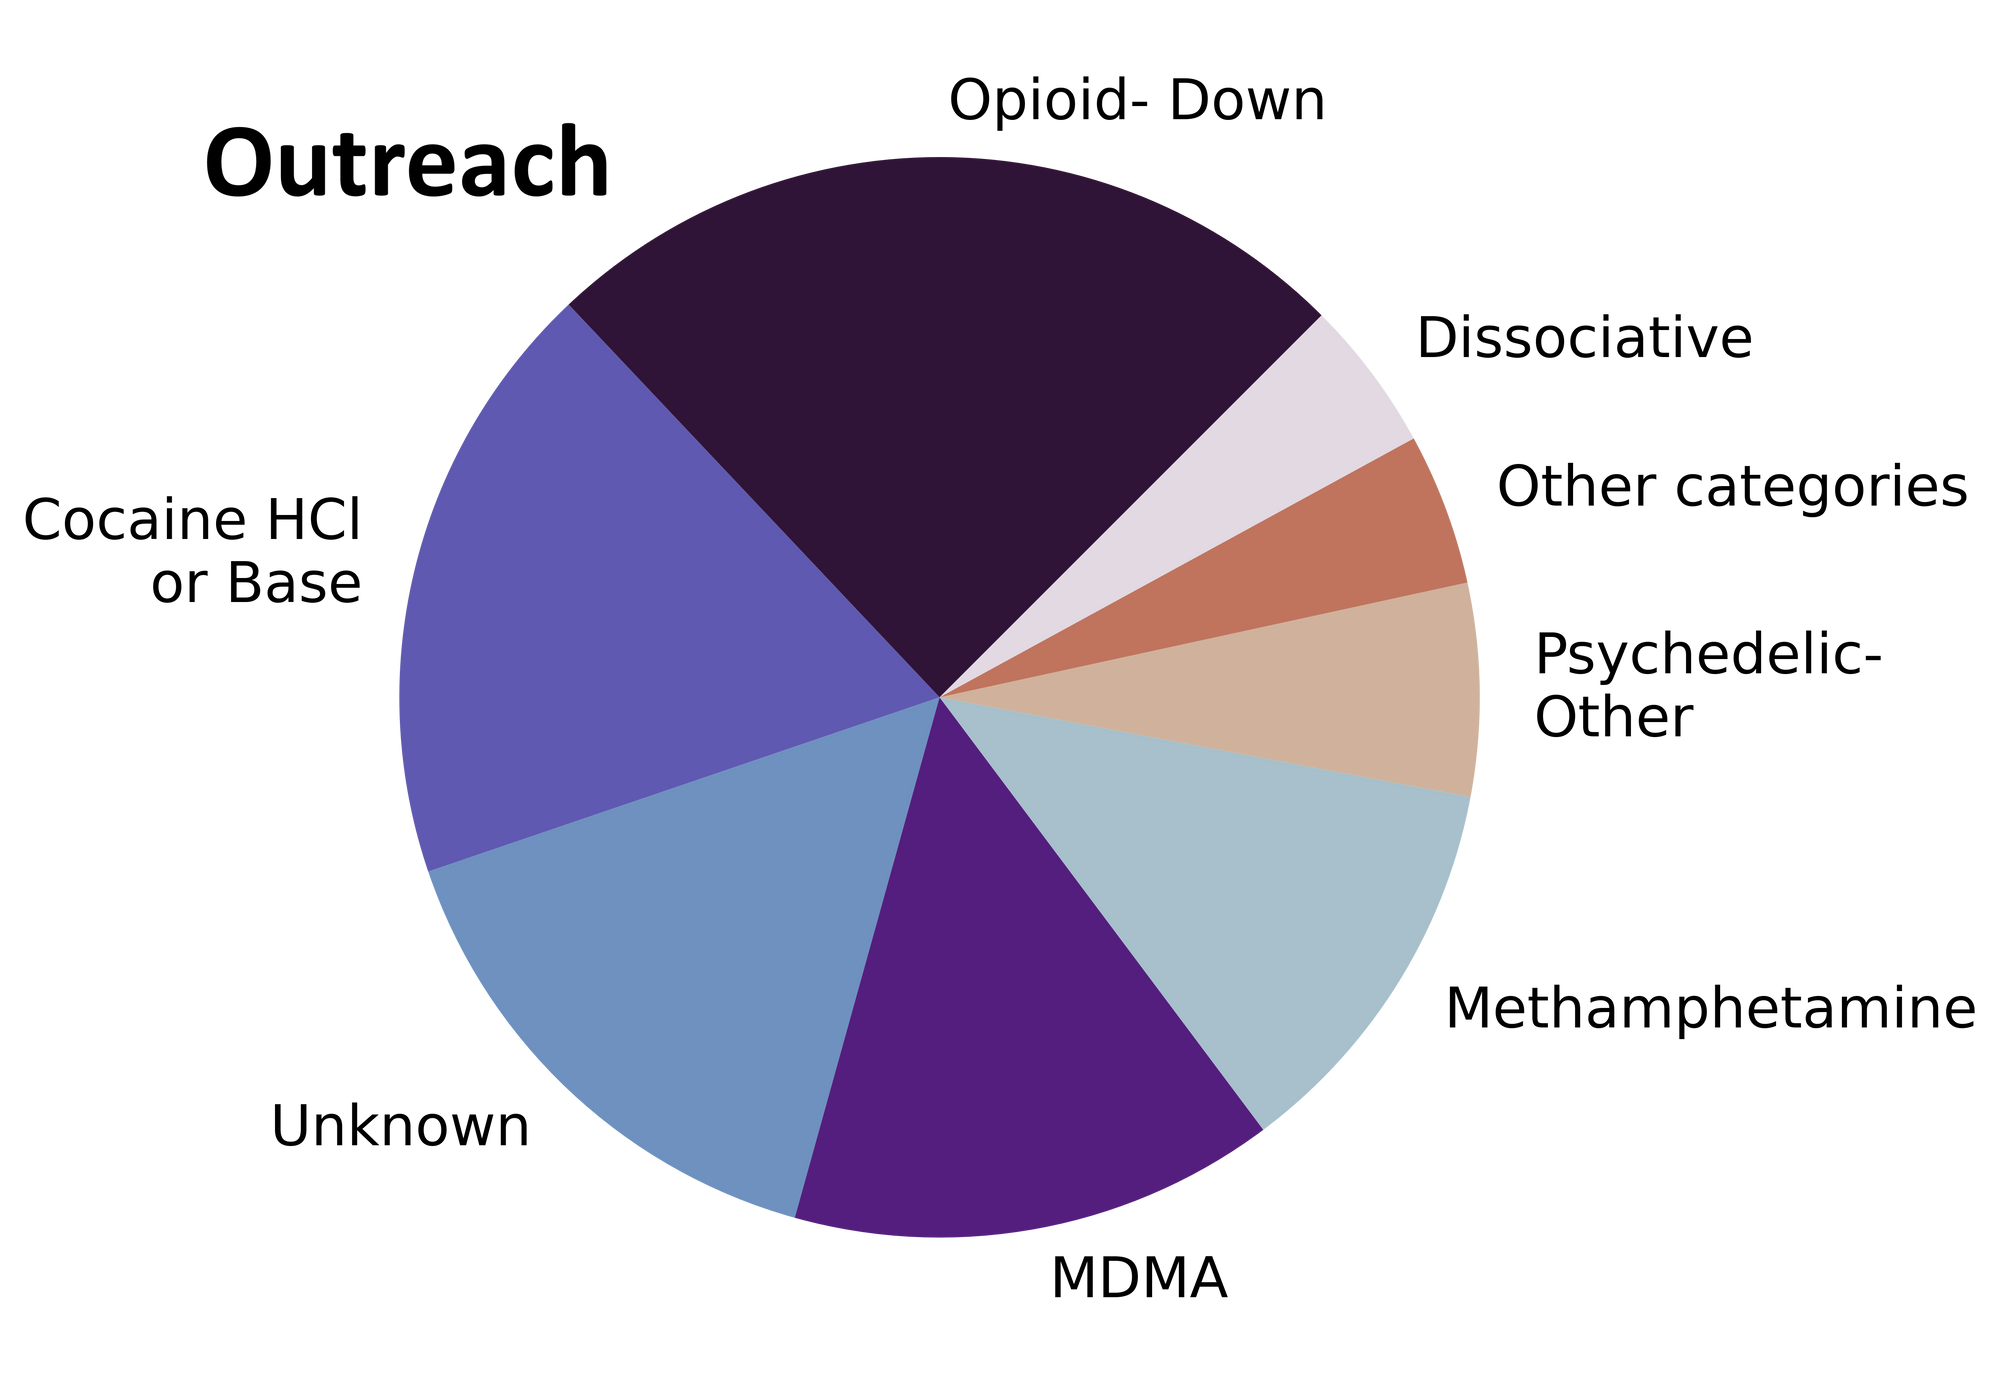
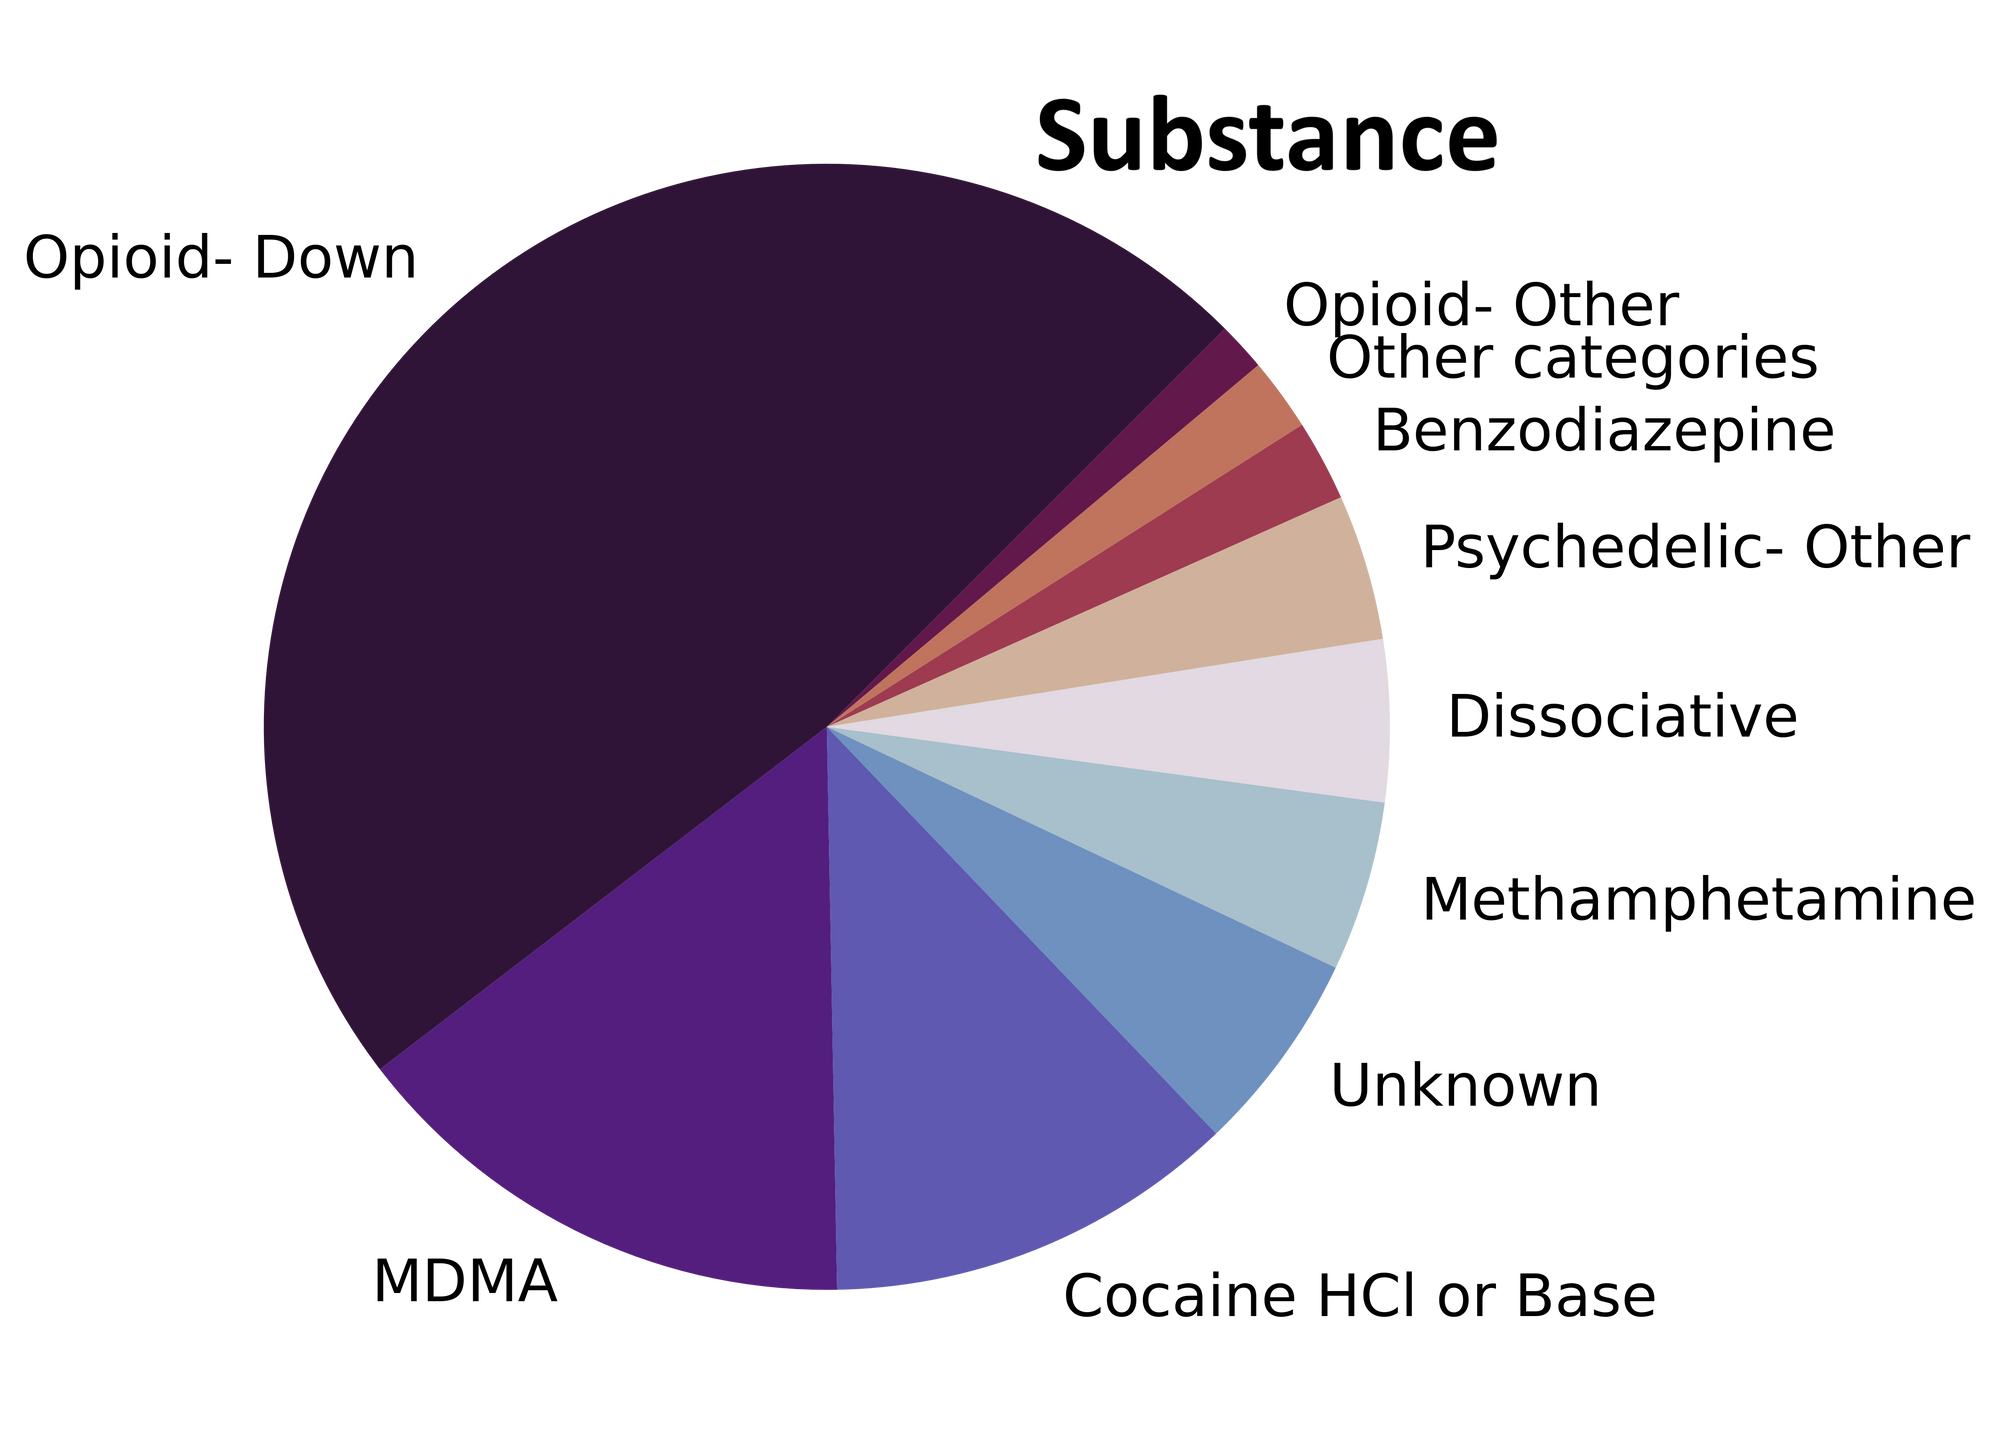
August’s flurry of activity brought an avalanche of samples to our service, from abstruse amalgams of acetylmorphine and acetylcodeine to “as advertised” allotments of alprazolam. Fig. 1 shows the prevalence of each expected drug category checked, split by sample collection location/method.

An assessment of August’s anticipated actives and anomalous adulterants
For a majority of samples checked, we confirm that the expected drug was indeed the only active and that no additional active compounds were present. The bar charts below highlight a few classes of drugs, differentiating samples when only the expected active was found from situations when other unexpected active components were detected.
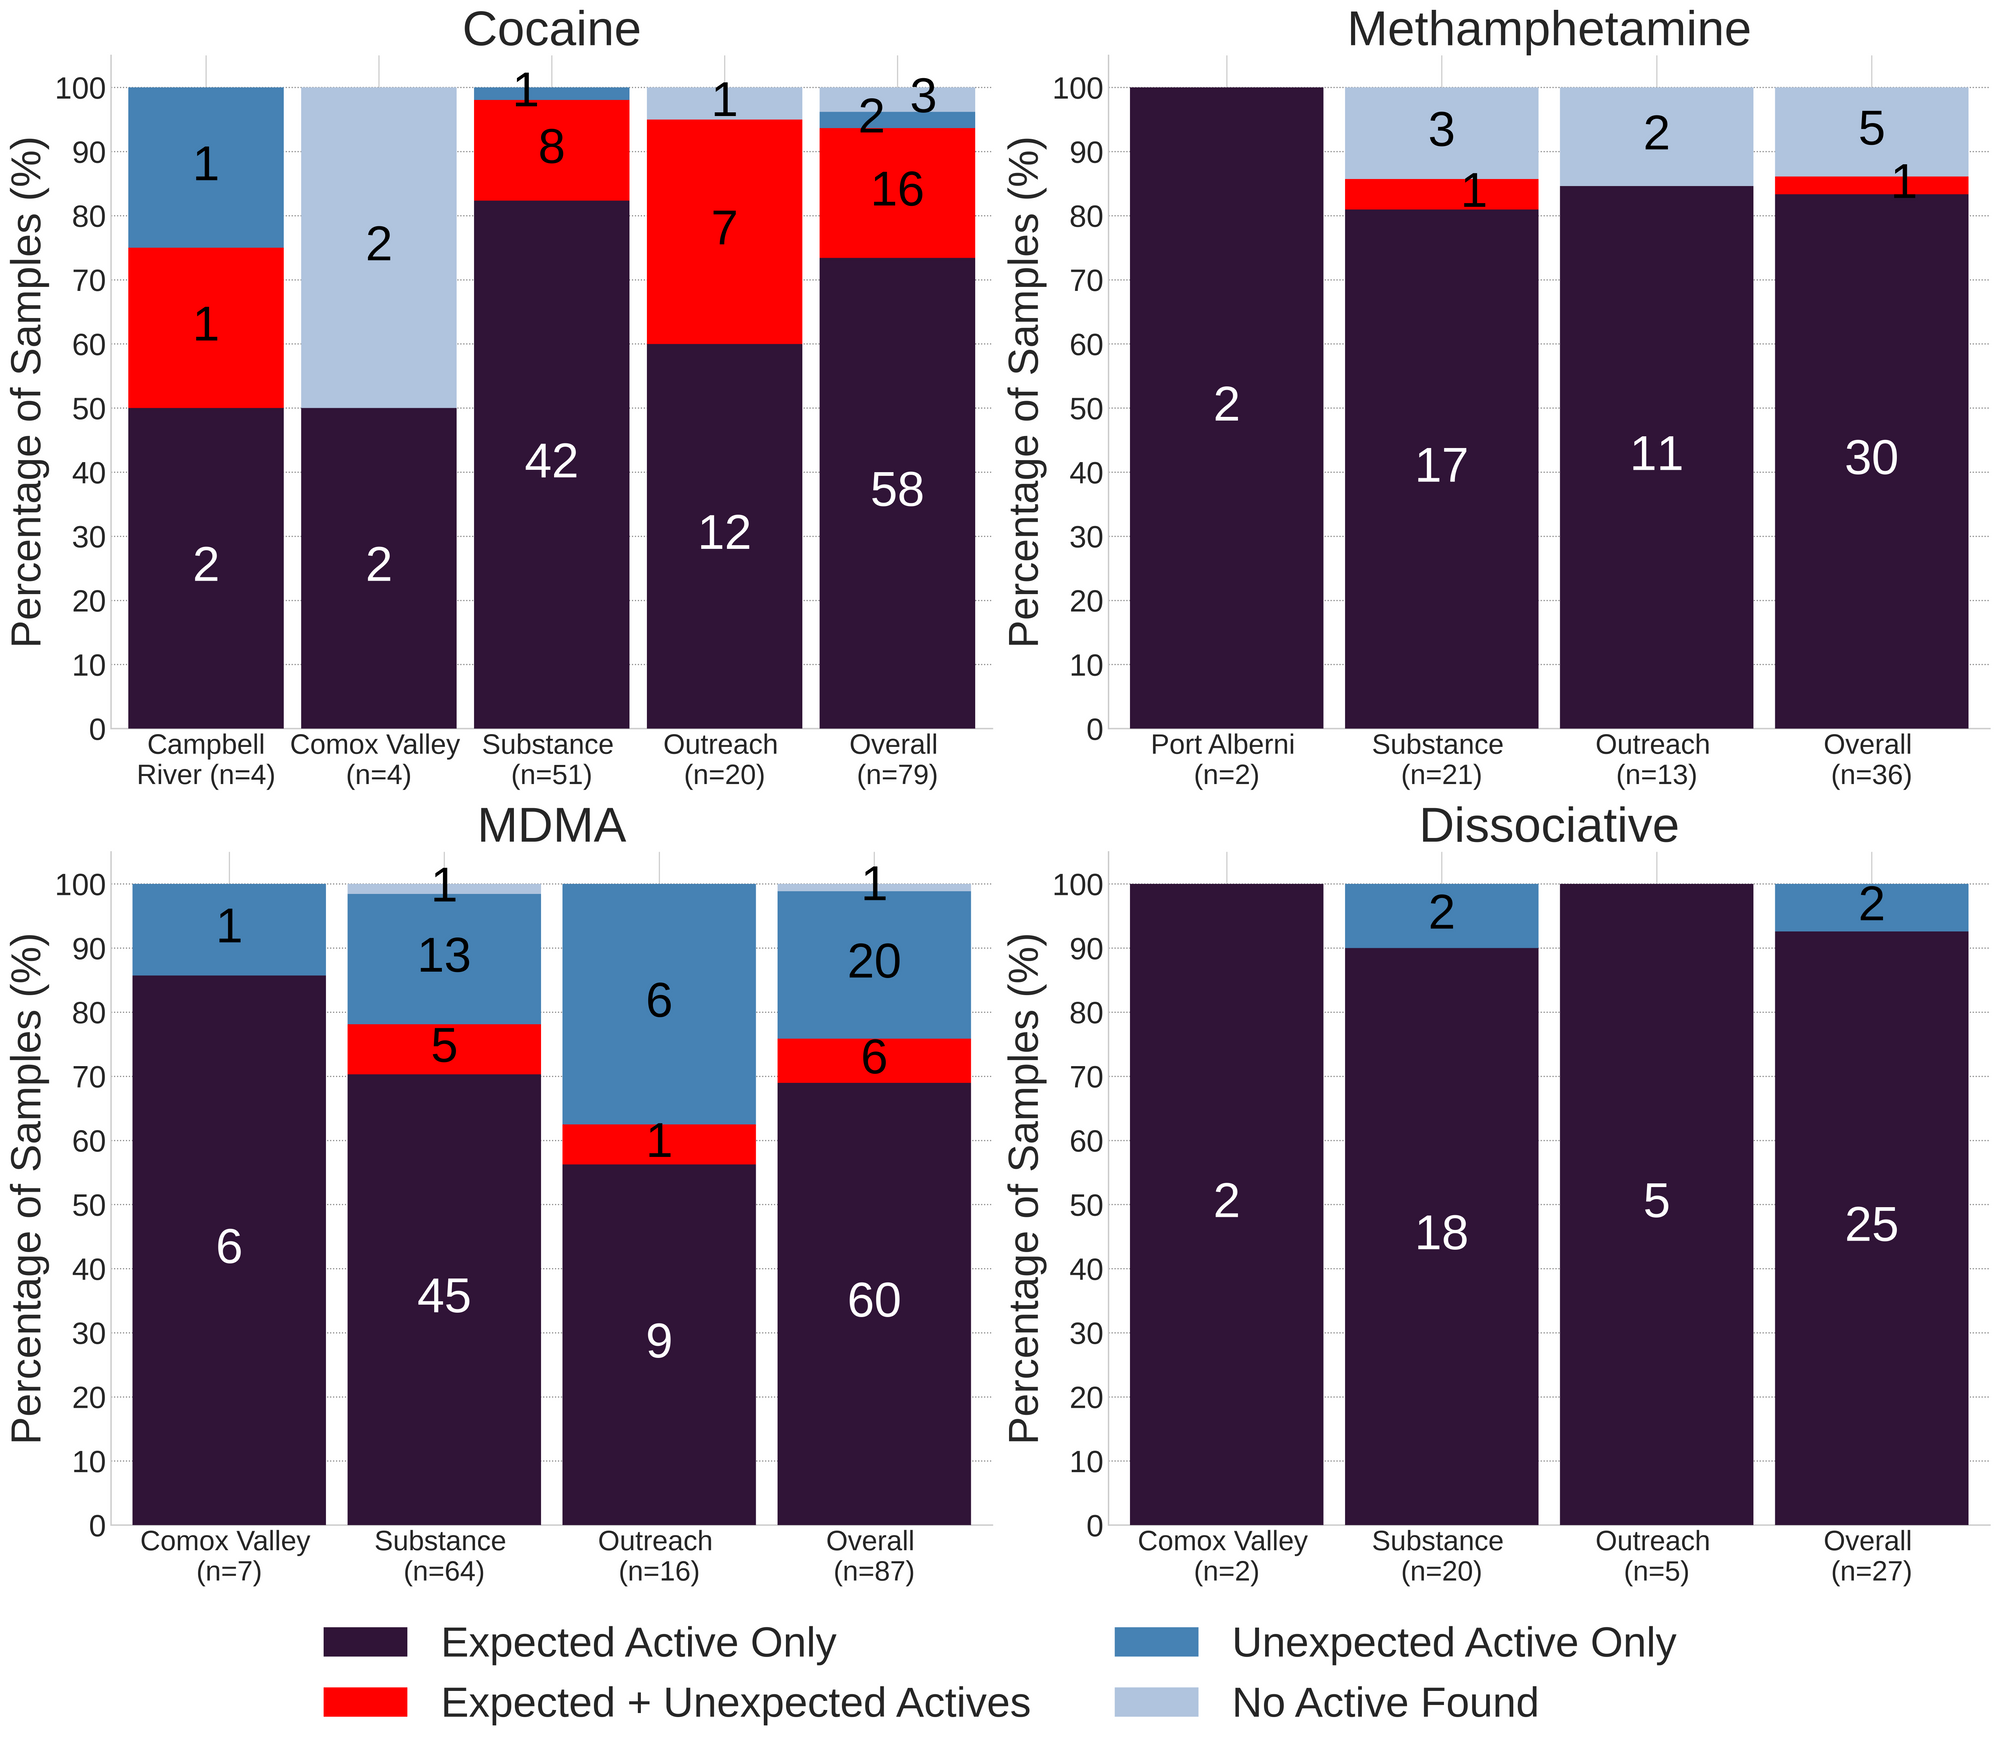
Meth is still mostly meth across the island: 83% (30/36) of expected methamphetamine samples checked in August, across all collection locations/methods, were found to be meth with no other active compounds detected. Within these samples, two were cut with MSM (dimethyl sulfone, an inactive compound and a common cutting agent found in meth) and another was cut with sugar. Only one sample checked in August was found to contain additional active compounds beyond meth; this sample was found to contain methamphetamine, 1% fentanyl, 0.3% bromazolam, and caffeine. Collected in Victoria, this sample was a mixture of crystalline shards and hot pink pebbles, with the translucent slivers being singularly side and the fluorescent crumbs containing the dayglo down.
The remaining 5 expected methamphetamine samples did not contain any meth: two samples were baggie residue too sparse for us to run any tests beyond strip tests (both negative for fentanyl), one sample was citric acid powder, another sample was just MSM, and the last sample was isopropylbenzylamine, an inactive intermediary used in the synthesis of methamphetamine that has similar physical properties to meth.
79 expected cocaine samples were checked in August with 73% (58/79) confirmed to be cocaine with no detectable active adulterants or cutting agents. 16 samples contained an active component in addition to cocaine, doubling the number of adulterated cocaine samples that we saw in July:
- Levamisole - 7 samples; an antihelminthic drug used to treat parasitic worm infections, commonly seen as a cut in cocaine
- 2 of these samples also contained lidocaine (a topical local anaesthetic)
- 1 sample additionally contained phenacetin (see below)
- 1 sample also contained procaine (a topical local anaesthetic)
- Phenacetin - 7 samples; “super buff” a tylenol-like drug, commonly seen as a cut in cocaine
- 1 sample additionally contained acetaminophen (tylenol) and benzocaine (a topical local anaesthetic)
- 1 sample was also found to contain levamisole (see above)
- Benzocaine - 4 samples; a topical local anaesthetic
- 1 sample additionally contained methamphetamine
- 1 sample was found to also contain phenacetin and acetaminophen (see above)
2 expected cocaine samples were found to contain no cocaine; one appeared to be a misidentified down sample containing fentanyl and methamphetamine, and the other appeared to be a crushed pill containing oxycodone and microcrystalline cellulose. The remaining three expected cocaine samples were baggies with trace amounts of residue too sparse for us to run any of our tests beyond the fentanyl strip test (which were all negative).
69% (60/87) of expected MDA/MDMA samples checked were confirmed to be the expected MDA/MDMA, with the MDMA-to-MDA mixup representing a majority of the remaining samples:
- 16 expected MDMA samples were found to just be MDA
- 1 expected MDA samples were found to be MDMA instead
- 6 samples were found to contain both MDMA and MDA
- 1 sample contained no MDMA and was instead found to be a mixture of undifferentiated cathinones
- 1 sample did not contain MDMA and instead was found to be ketamine and MSM (dimethyl sulfone, and inert cut)
- 1 sample did not contain MDMA and was found to be methamphetamine instead
- 1 sample was baggie residue too sparse for us to run any tests other strips (no fentanyl detected)
96% (25/26) expected ketamine samples checked were found to be ketamine with no other active compounds detected. The remaining sample was found to be MDMA instead of ketamine. Rounding out the dissociative class, one expected PCP sample was checked in August as well, but was found to contain rolicyclidine (PCPy) and diazepam/Valium instead. Rolicyclidine is reported to produce similar effects to PCP but with less stimulating effects. Compare Tripsit’s summaries of PCP and PCPy for more information.
We know what we are about to say may be shocking, but, believe it or not, some people use drugs at festivals. Breaking news for sure. Between the three music/arts events that we offered drug checking at in August (Phillips Brewing Backyard Implosion Explosion, Footwork Entertainment Summer Social, and Plant Based Productions Plants ’N Animals), we saw a handful of “party drugs”, with MDMA/MDA, cocaine, and ketamine representing the most common expected drug classes. Within these events, the levels of adulteration/misrepresentation seen in expected MDMA and cocaine samples were a bit higher than the levels seen for corresponding samples checked at our other service locations:
- 12 expected MDMA/MDA samples were checked at events:
- 50% (6/12) were simply as expected, compared to 72% (54/75) elsewhere
- 8% (1/12) contained the expected active plus an additional active (like finding MDMA and MDA in an expected MDMA sample), compared to 7% (5/75) elsewhere
- 42% (5/12) only contained an unexpected active (such as an expected MDMA sample only containing MDA), compared to 25% (19/75) elsewhere
- 11 expected cocaine samples were checked at events:
- 64% (7/11) were just cocaine as expected, compared to 75% (51/68) elsewhere
- 36% (4/11) contained cocaine and an additional active (phenacetin was found in 3 samples, levamisole and lidocaine in another), compared to 18% (12/68) elsewhere
All four expected ketamine samples checked at events were confirmed to just be ketamine. While the adulteration/misrepresentation levels do appear a bit higher at events, we caution any further conclusions, acknowledging the limitations of small sample statistics, the fact that not all samples checked at an event were purchased at the event, and that the checked sampled do not necessarily represent the total population of drug samples at the event overall. If you are a festival-going, drug-using, data nerd and want to help us evaluate the limitations listed above, or if you are simply curious about what’s in your baggie, we would love to check your samples!
Benzodiazepines (n=10)
70% (7/10) of the benzodiazepine samples checked in August came to our service in the form of pressed pills; the remaining three samples were white powders. Six of the seven pills were expected to be alprazolam (Xanax), and one was expected to be lorazepam (Ativan). The lorazepam was confirmed to be lorazepam, while only one of the pressed pills was confirmed to contain alprazolam. The five other pressed pills were found to contain a benzo or benzo-related drug other than alprazolam:
- Etizolam - 2 samples. Etizolam is ~2x weaker than alprazolam, though the concentration of each pill may be quite variable
- One sample additionally contained the benzo flubromazepam. Flubromazepam is ~5x weaker than alprazolam, but has a much longer duration, with effects lasting 12-18 hours
- Flualprazolam - 2 samples. Flualprazolam is ~2x stronger than alprazolam in terms of dosage but has a similar duration of effect (5-8 hours)
- Lorazepam - 1 sample. Though lorazepam/Ativan is a medically prescribed benzo, this particular pill came in the form of an illicit pressed Xanax bar. Lorazepam is comparable in both strength and duration to alprazolam
Within the three powder samples:
- One sample was confirmed to be bromazolam, as expected
- One sample was found to be benzocaine, rather than a benzodiazepine
- One sample was found to contain high concentration flubromazepam with 0.06% carfentanil and <0.1% fentanyl detected as well
Opioid-Down (n=246)
In this section we present results specific to the opioid-down supply, therefore they may differ from the highlighted findings above that are inclusive of all expected drug categories.
- 94% of expected opioid-down samples contained fentanyl (231/246)
- 10 (4%) samples contained heroin, with a median concentration >80% and a range of 13% to >80%:
- Six samples were just heroin (and related alkaloids like acetylmorphine (MAM) and acetylcodeine)
- Four samples additionally contained fentanyl ranging from 6% to 17%
- Three of these samples also contained benzodiazepines:
- Two samples contained >25% etizolam
- One sample contained 4% flubromazepam and 0.5% bromazolam
- Three of these samples also contained benzodiazepines:
- Six samples contained carfentanil, with a median concentration of 0.36% and a range of 0.04% to 1.19%
- 55% of expected opioid-down samples contained a benzodiazepine and/or etizolam (134/246)
- Xylazine was detected in 8% (20/208) of opioid-down samples, with a median concentration of 0.5% and a range of 0.1% to 5.0%
This August, 67% of all opioid-down samples checked contained an additional active to the expected fentanyl. Examining Fig 3. we can see that the down supply has remained consistently inconsistent:
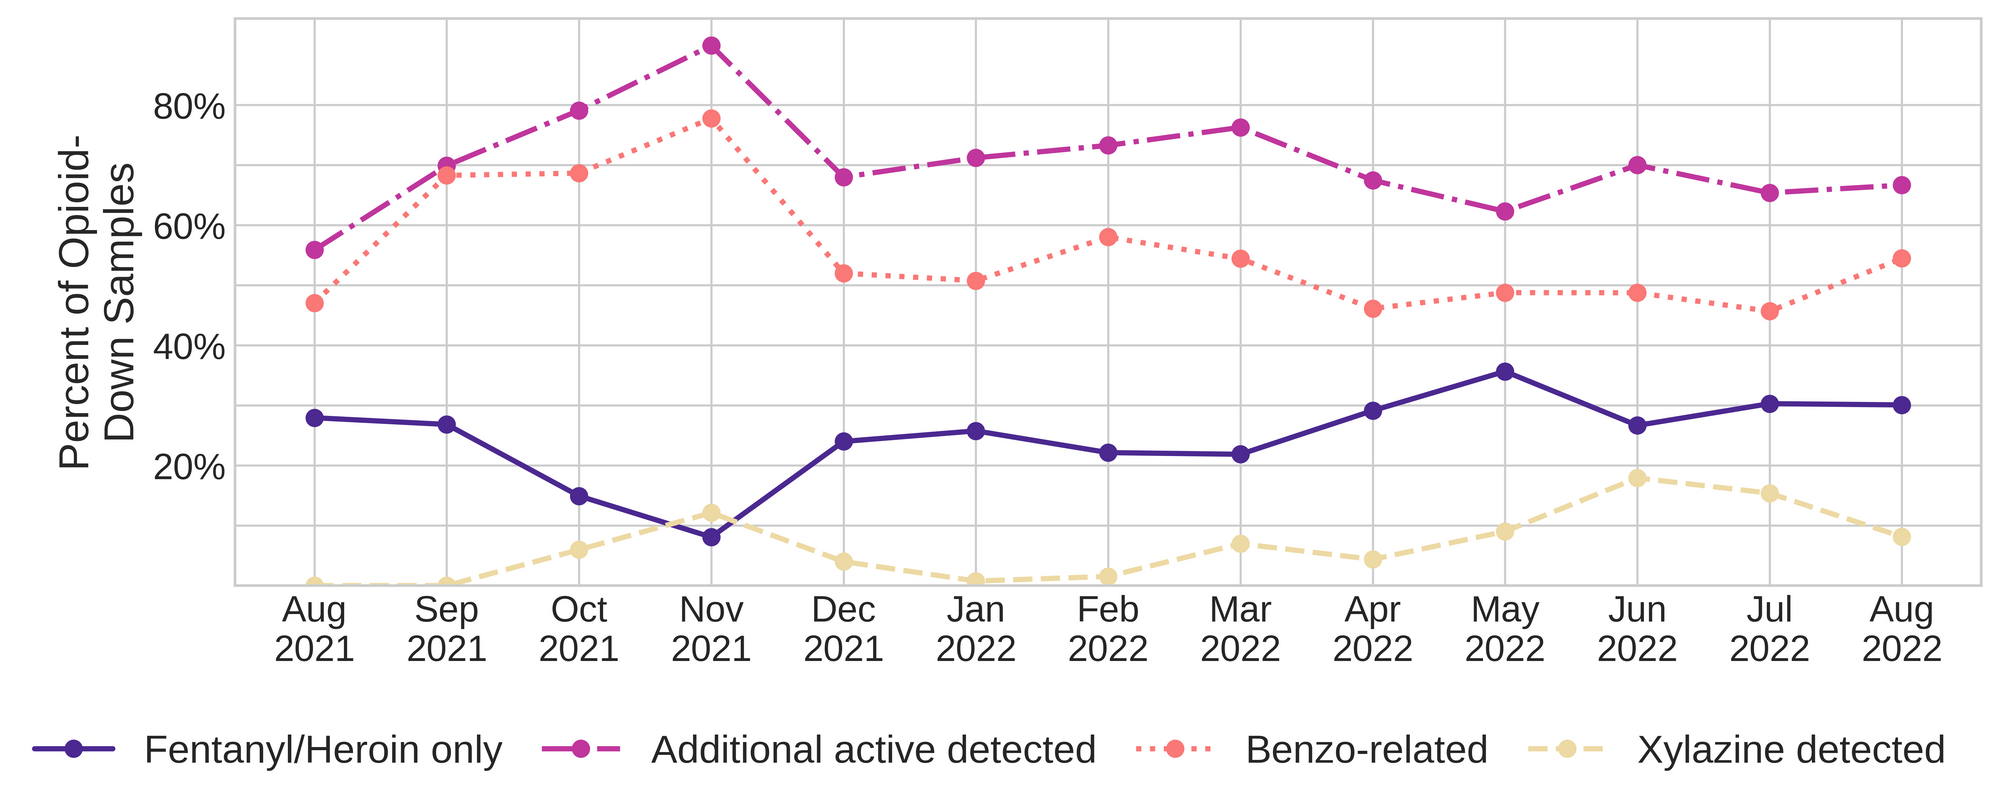
Benzo-related drugs remain the primary contributor to the additional actives found in expected opioid-down samples with 55% (134/246) of expected opioid-down samples checked containing a benzo-related drug.
As we saw in July, bromazolam has overtaken flubromazepam and etizolam as the most common benzo seen in the down supply. Bromazolam is a novel non-medical benzodiazepine with comparable strength and duration to alprazolam/Xanax, though it has limited study of use in humans. The percentage of down samples containing bromazolam has continued to increase: 24% of opioid-down samples contained bromazolam in August (60/246), 14% of down samples contained bromazolam in July (30/208), 6% of down samples contained bromazolam in June (15/240), and 8% in May (19/244). Alternatively, we could look at bromazolam’s contribution to benzo-positive down samples: 45% of benzo-positive down samples contained bromazolam in August (60/134), compared to 32% (30/95) in July, 13% (15/117) in June, and 16% (19/119) in May. Prior to May, we were unable to quantify/detect bromazolam on our mass spectrometer.
Unexpected fentanyl analogues like fluorofentanyl (39 samples), and the sedative xylazine (20 samples) represent a majority of the remaining adulterants, though scattered detections of other drugs are still found and can be reviewed in the pdf report at the end of this blog.
August 31st marked the annual observance of Overdose Awareness Day. Is there anything to say that hasn’t already been said? We are angry and we are devastated. The harmful and deadly impacts of prohibition, criminalization and the unregulated market continue. We continue to mourn the loss of our friends, families and community members. Those most impacted by the unregulated supply have been telling us what they need, yet nothing changes. Policies continue to be inadequate. Support your local drug user organisations. Support your local grassroots harm reduction initiatives. Show up in the ways they need you to show up. Support the people in your life who use drugs - listen to their knowledge and let them lead the way. And importantly, take care of yourself in whatever ways you are able.
Quantification for Expected Opioid-Down[1]
In August, we quantified fentanyl for 222 of the expected opioid-down samples containing fentanyl and found the median concentration to be 12.9%[2] with the average strength of fentanyl we normally see being around 15%. Though the median is a useful indicator, it doesn’t capture the volatility of fentanyl concentrations present in the opioid supply, as any one sample might be the lowest strength (0.1%) or the strongest (>80%[3]). Similarly, the concentration of bromazolam, our new benzo-representative, was across the board in expected opioid down samples, ranging from 0.1% to 45.7%, with a median of 2.0%.
2% bromazolam is roughly equivalent to 1 full 2mg Xanax bar worth of benzo in each “point” (100mg) of “the average down sample.” Considering some folks may use multiple points of down in a day, it is easy to see how benzodiazepine dependency can develop alongside opioid use. Safe supply initiatives and OAT/recovery programs that do not include options for people who use benzodiazepines would be insufficient for around 50% of the people who access our service to check their down. Without access to regulated benzos, people who use illicit “benzo-dope”, knowingly or not, are forced to continue to navigate the unregulated market to avoid the severe withdrawal symptoms associated with discontinuing benzo use. We hope that our monitoring of the unregulated opioid supply can help inform safe supply initiatives on the drugs, and dosages, that people should have access to.
Not all opioid down samples brought to our service can be quantified. This is primarily due to too limited sample collected for our instruments to report a reliable mass percentage. Nevertheless, qualitative detection is still possible. ↩︎
This number is specific to fentanyl quantified in opioid-down samples. The median concentration listed in the Key Findings at the beginning of this blog (12.6%) is inclusive of all samples checked, across all drug classes, that contained fentanyl. ↩︎
For samples that contain more than 80% fenanyl, or more than 25% etizolam by weight, our mass spectrometer is presently unable to reproducibly assign a concentration due to the upper limits of the calibration methods currently adopted. ↩︎

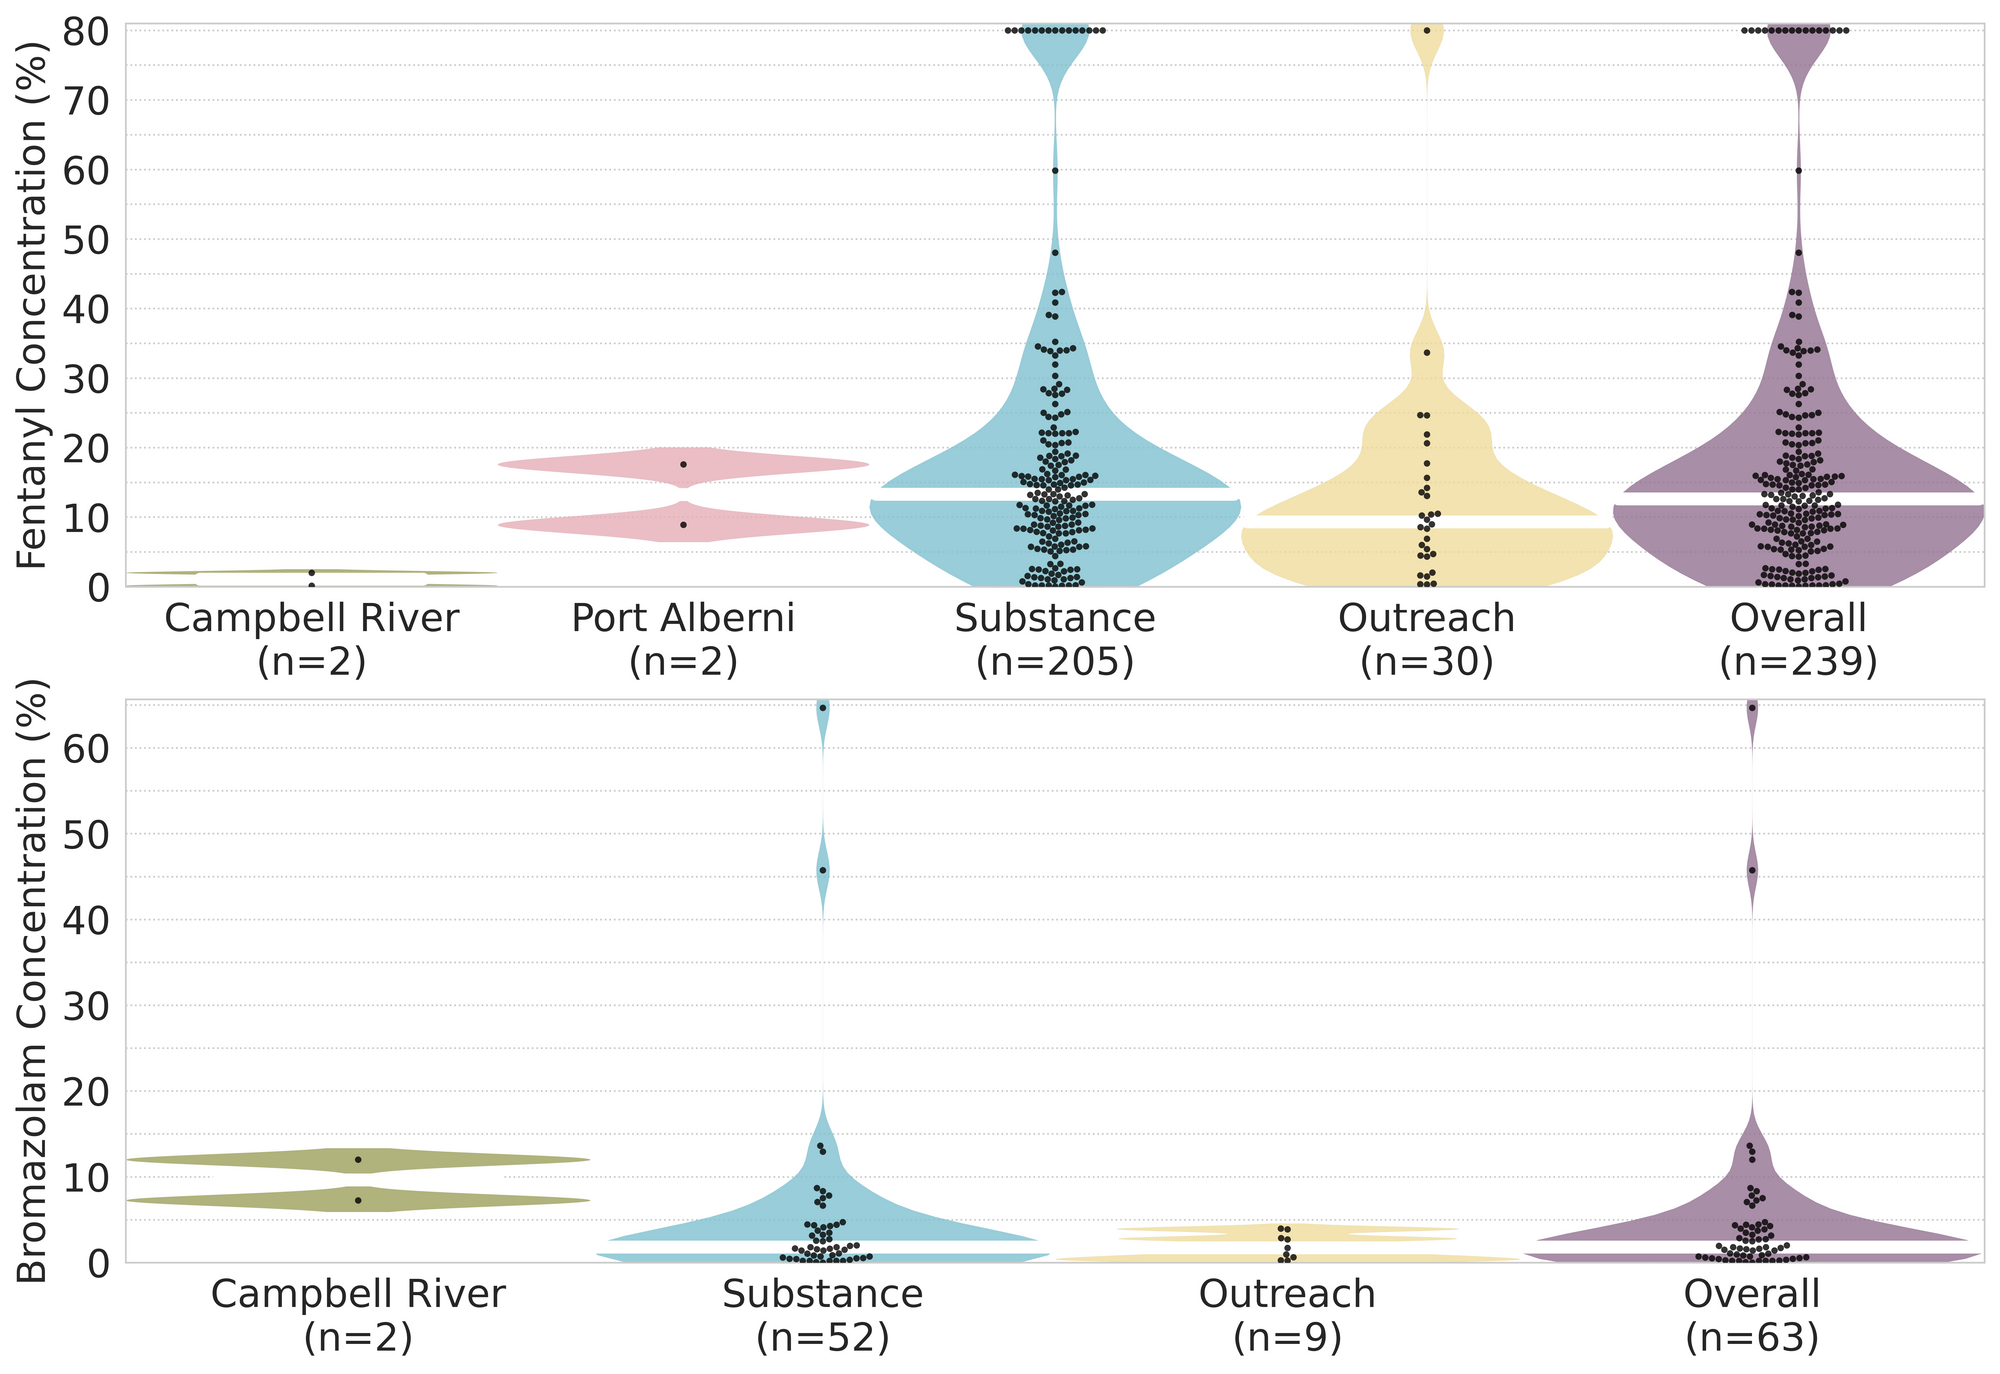
The fentanyl and bromazolam concentrations that we quantified in August, across all expected drug categories, are presented in Fig. 4. Black dots are individual samples, Horizontal white bars show the median concentrations of fentanyl and bromazolam quantified, the width of the shaded regions mirrors the number of samples at a given concentration.
Want to be notified when we release these reports? Join our mailing list to receive updates about when our reports are out. You can subscribe and unsubscribe yourself from this list at any time.
Check back literally right now for the September report!
As always, send us feedback at substance@uvic.ca for how we can continue to offer our drug checking results in a useful way.