September 2022 Monthly Report

In this blog post we discuss our September 2022 report and provide more information on how to interpret the results. The PDF report can be found at the end.
Key findings:
- The median fentanyl concentration found, across all expected drug categories, was 9.6%, with a maximum of over 80%
- Carfentanil was found in 11 samples, all expected opioid-down, with a median concentration of 0.48% and maximum concentration of 1.80%
- Benzodiazepines and/or etizolam were found in 47% of expected opioid-down samples
- The median concentration of bromazolam, the most common benzodiazepine found across all expected drug categories, was 1.9%, with a maximum of over 80%
- Xylazine, a veterinary sedative, was found in 13 (5%) of expected opioid-down samples with a median concentration of 4.2% and a maximum concentration of 18.1%
Insight for the September 2022 Monthly Report
September sang the swan song of summer and shepherded the fall season with a spirited start. Serving six communities (Victoria, Salt Spring Island, Nanaimo, Port Alberni, the Comox Valley, and Campbell River), a social scene (Rifflandia), and a sundry of other sites through envelope outreach, we surveyed 678 samples in September. 678 samples is an admirable number. Admirable to number nerds for obvious reasons, and admirable for us since we surpassed our previous sample-count-summit by sixty-some specimens. Similarly, there is something satisfying about the sequential series 6-7-8…Anyway, September kept us shuffling and we were seriously ecstatic about the service uptake across the Island.
This blog, and the associated pdf report, breakdown our sample counts into five categories:
-
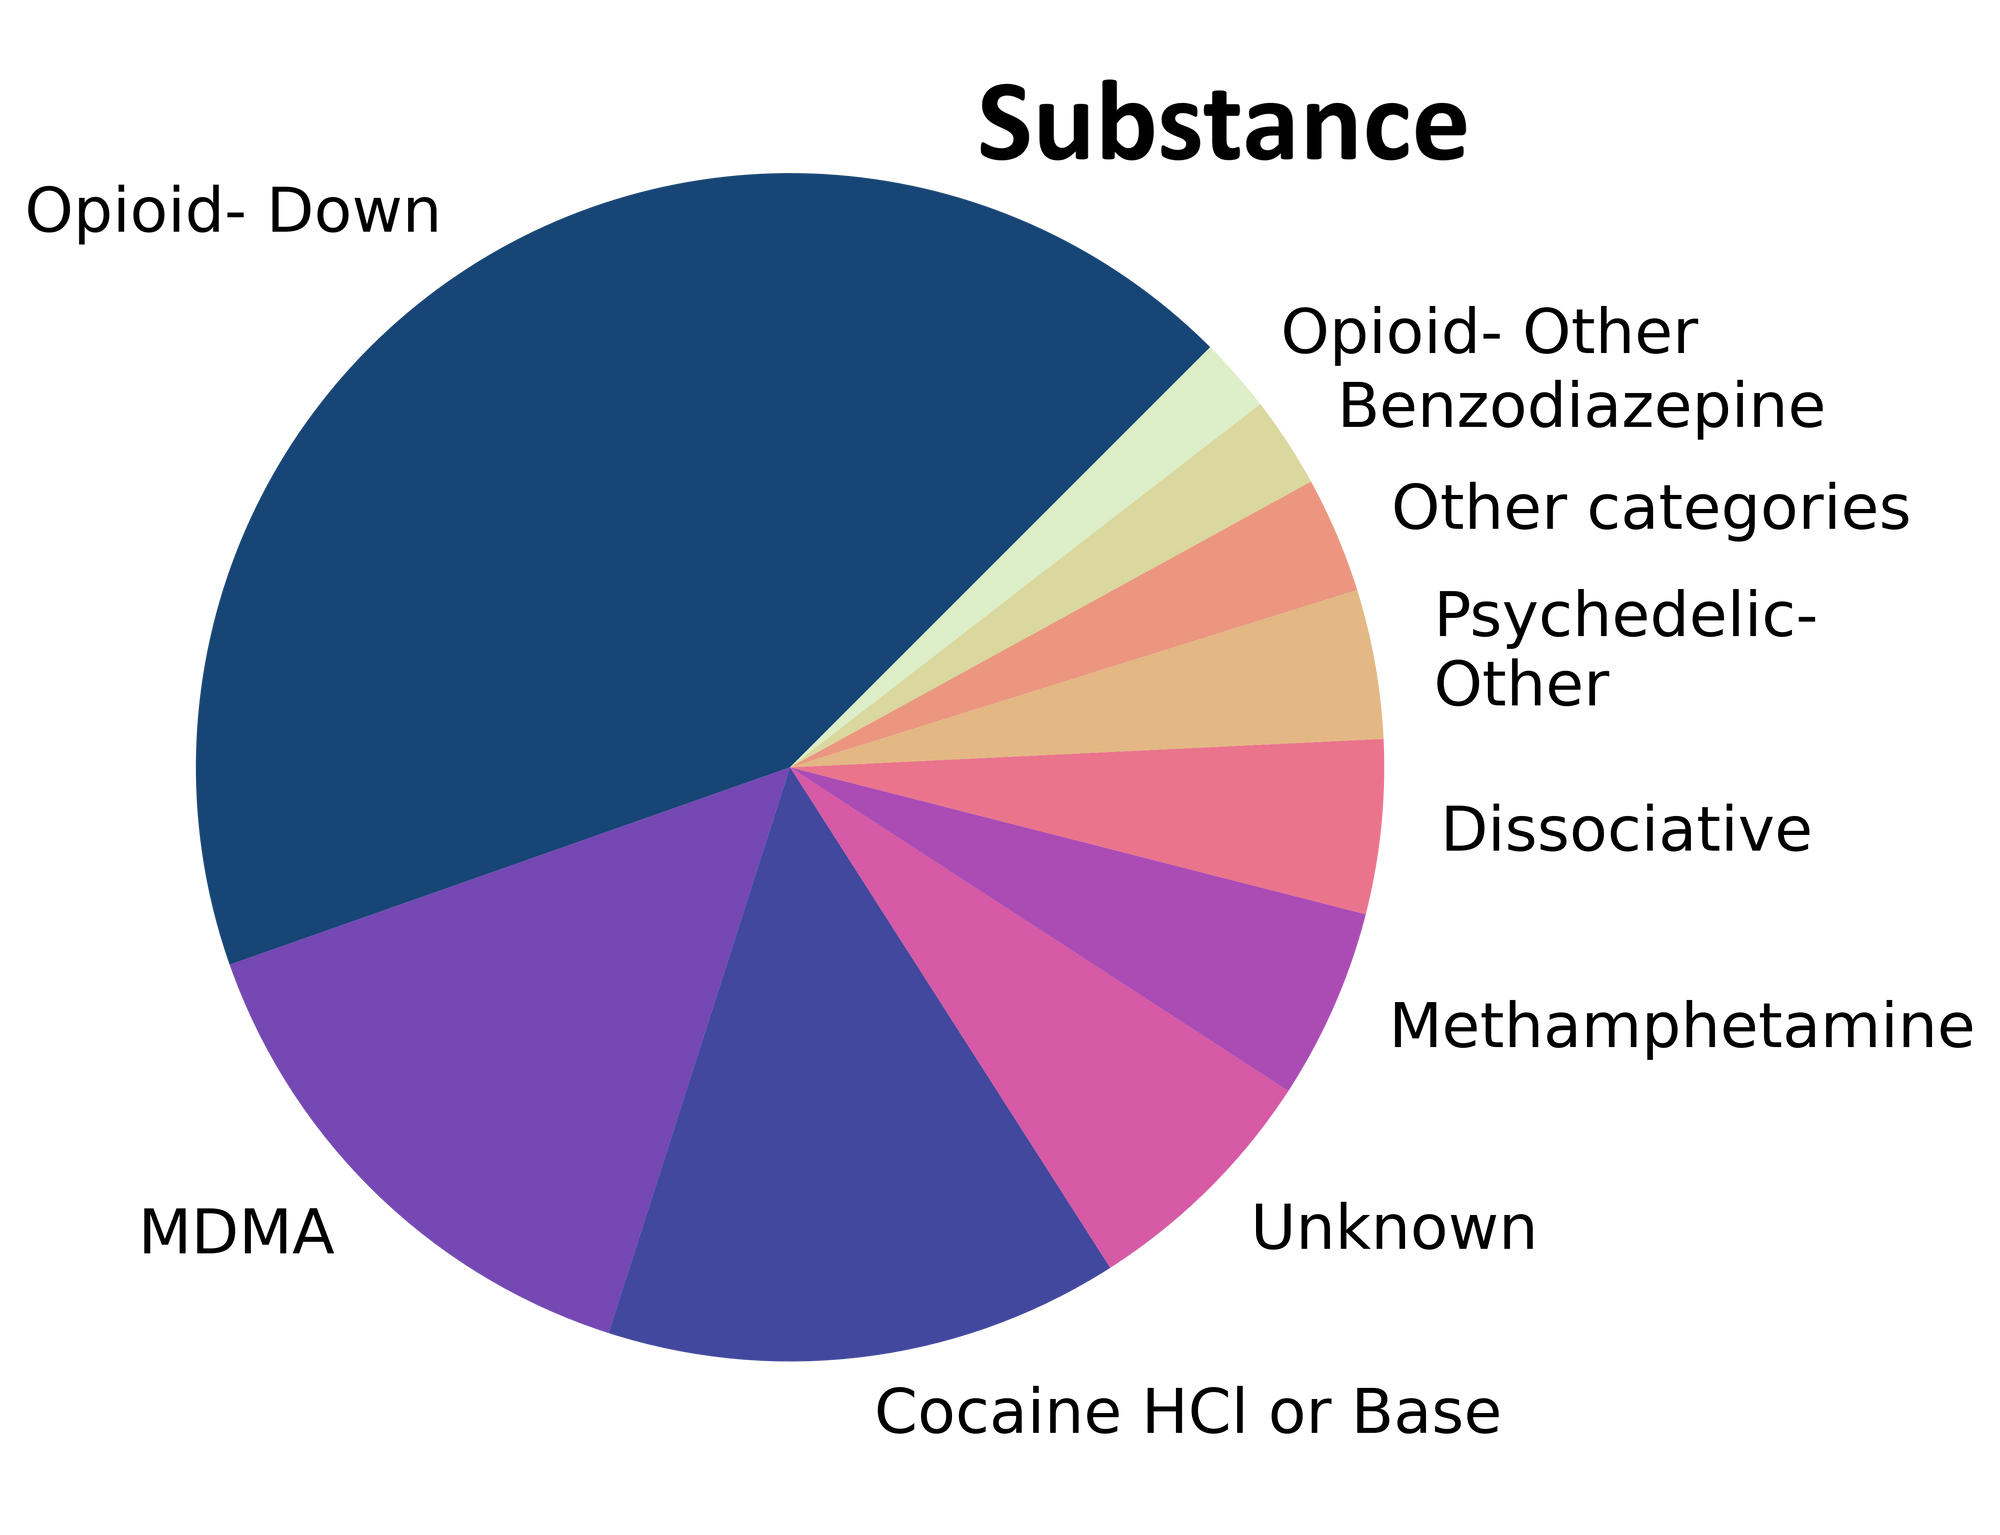
samples received through direct service provision in Victoria, where service users are bringing samples into the Substance storefront. These samples are labelled as “Substance” samples in the figures/tables of this blog post.
-
samples received through direct service provision in Campbell River, where service users are bringing samples to the Vancouver Island Mental Health Society (VIHMS). These samples are labelled as “Campbell River” samples in the figures/tables of this blog post.
-
samples received through direct service provision in the Comox Valley, where service users are bringing samples to AVI Health & Community Services in Courtenay, BC. These samples are labelled as “Comox Valley” samples in the figures/tables of this blog post.
-
samples received through direct service provision in Port Alberni, where service users are bringing samples into PASS’s OPS. These samples are labelled as “Port Alberni” samples in the figures/tables of this blog post.
-
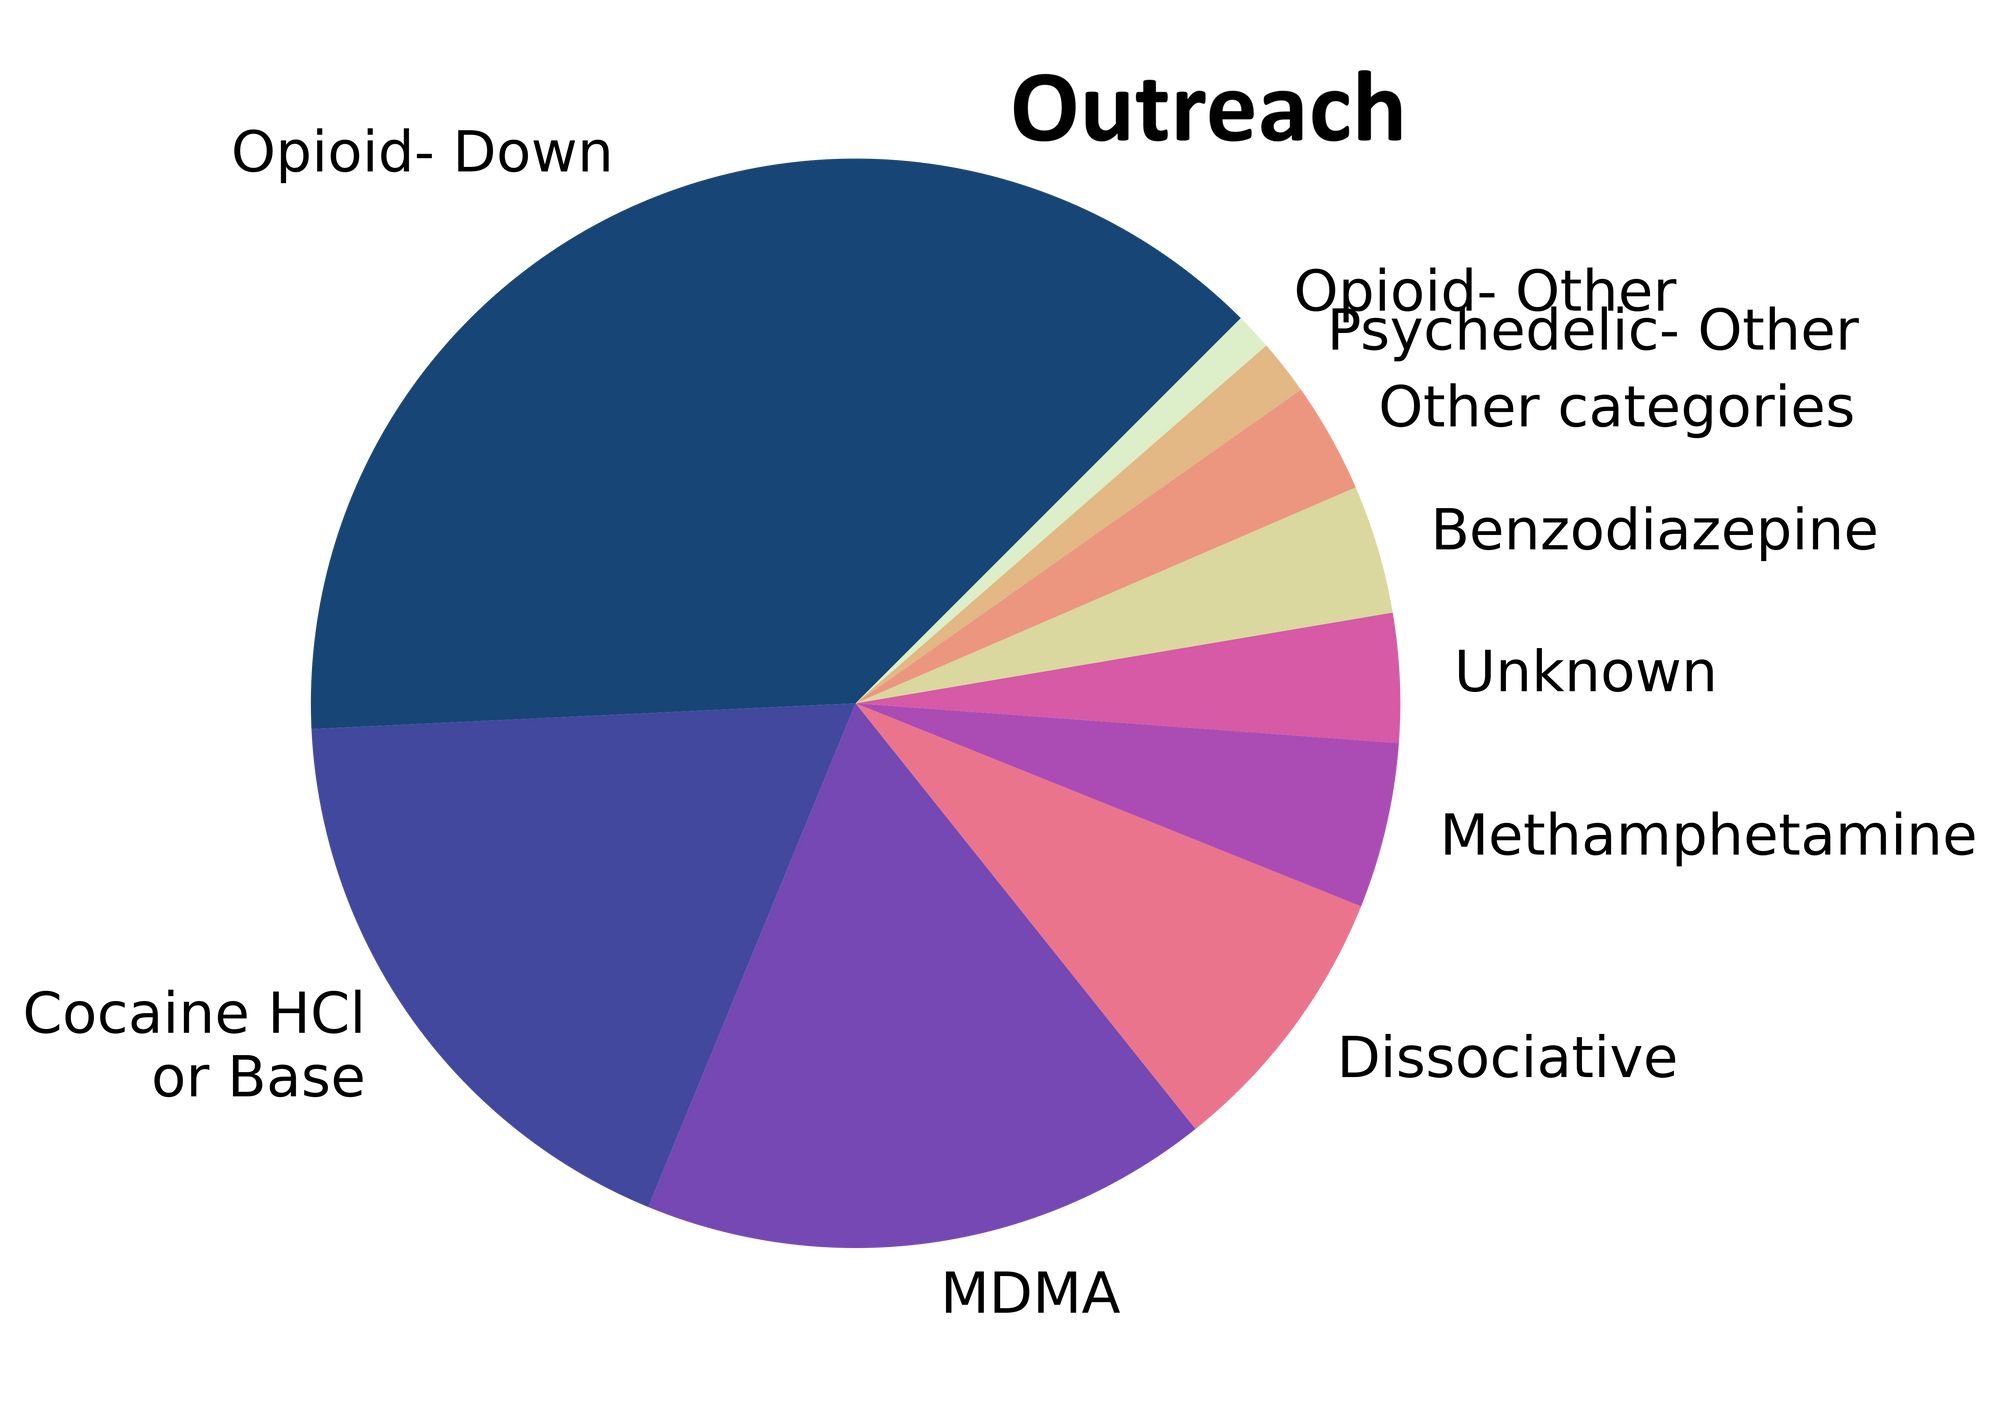
samples received through indirect service provision, where samples are being collected through no contact drop-off envelopes, mail-in envelopes, or are being collected by harm reduction workers and/or other community members at supported housing sites, at overdose prevention sites, and supervised consumption locations. September’s outreach data also includes samples collected during pop-up drug checking at the Rifflandia festival, with Salt Spring Island Community Services, and with the Nanaimo Area Network of Drug Users (NANDU). These samples are labelled as “Outreach” samples in the figures/tables herein.
Drug types
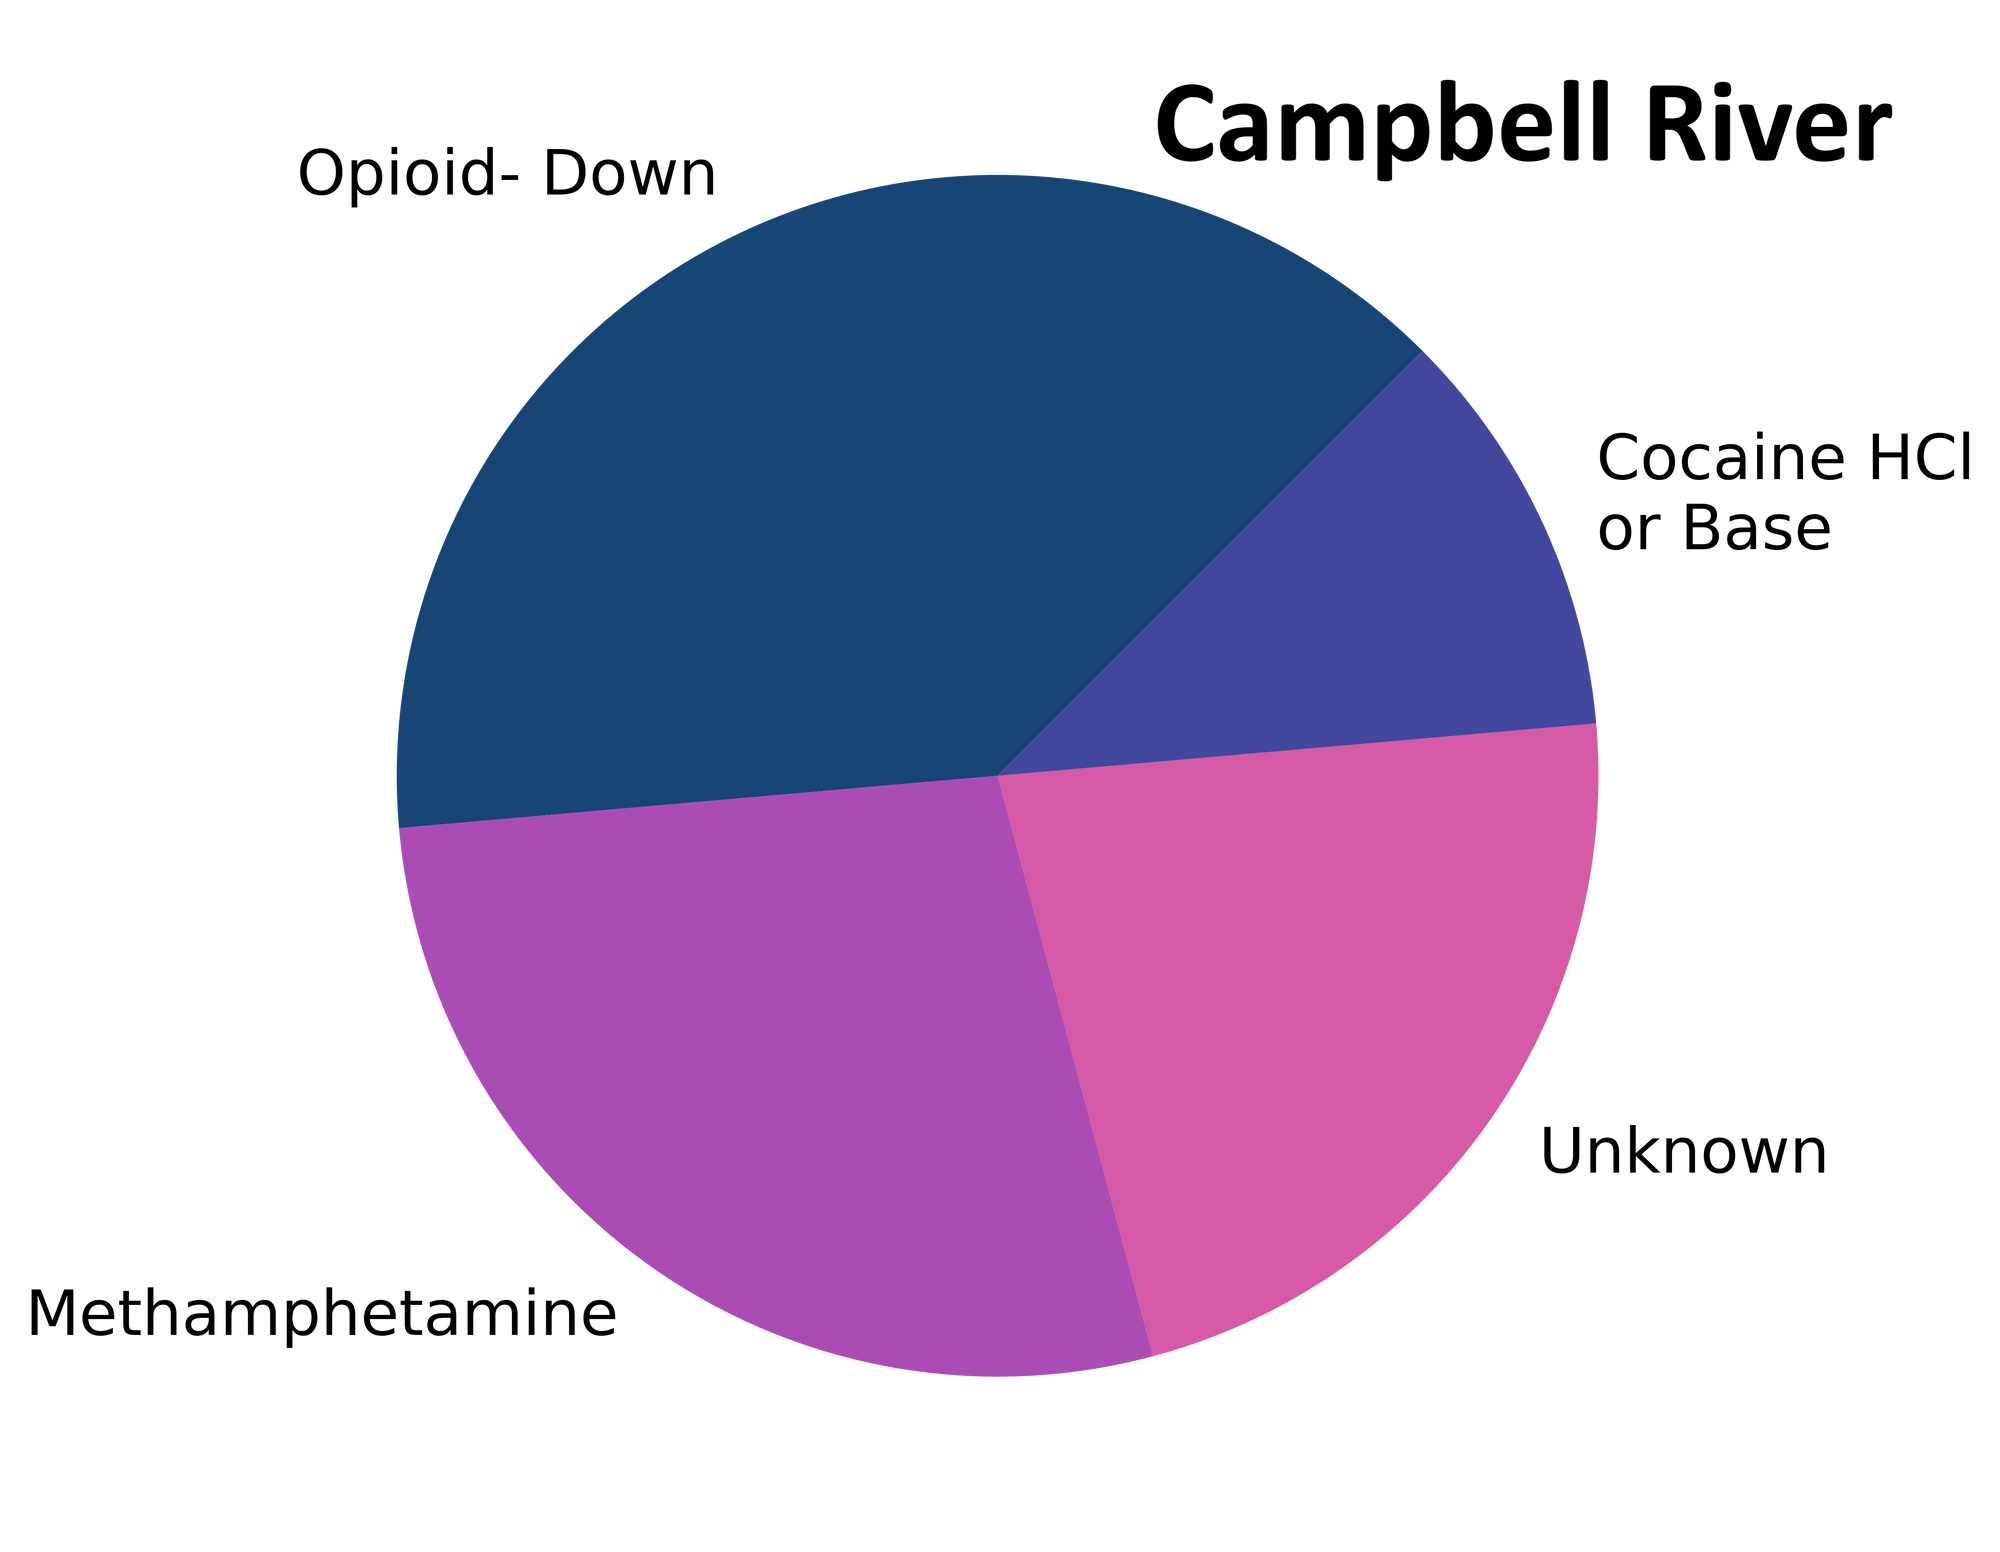
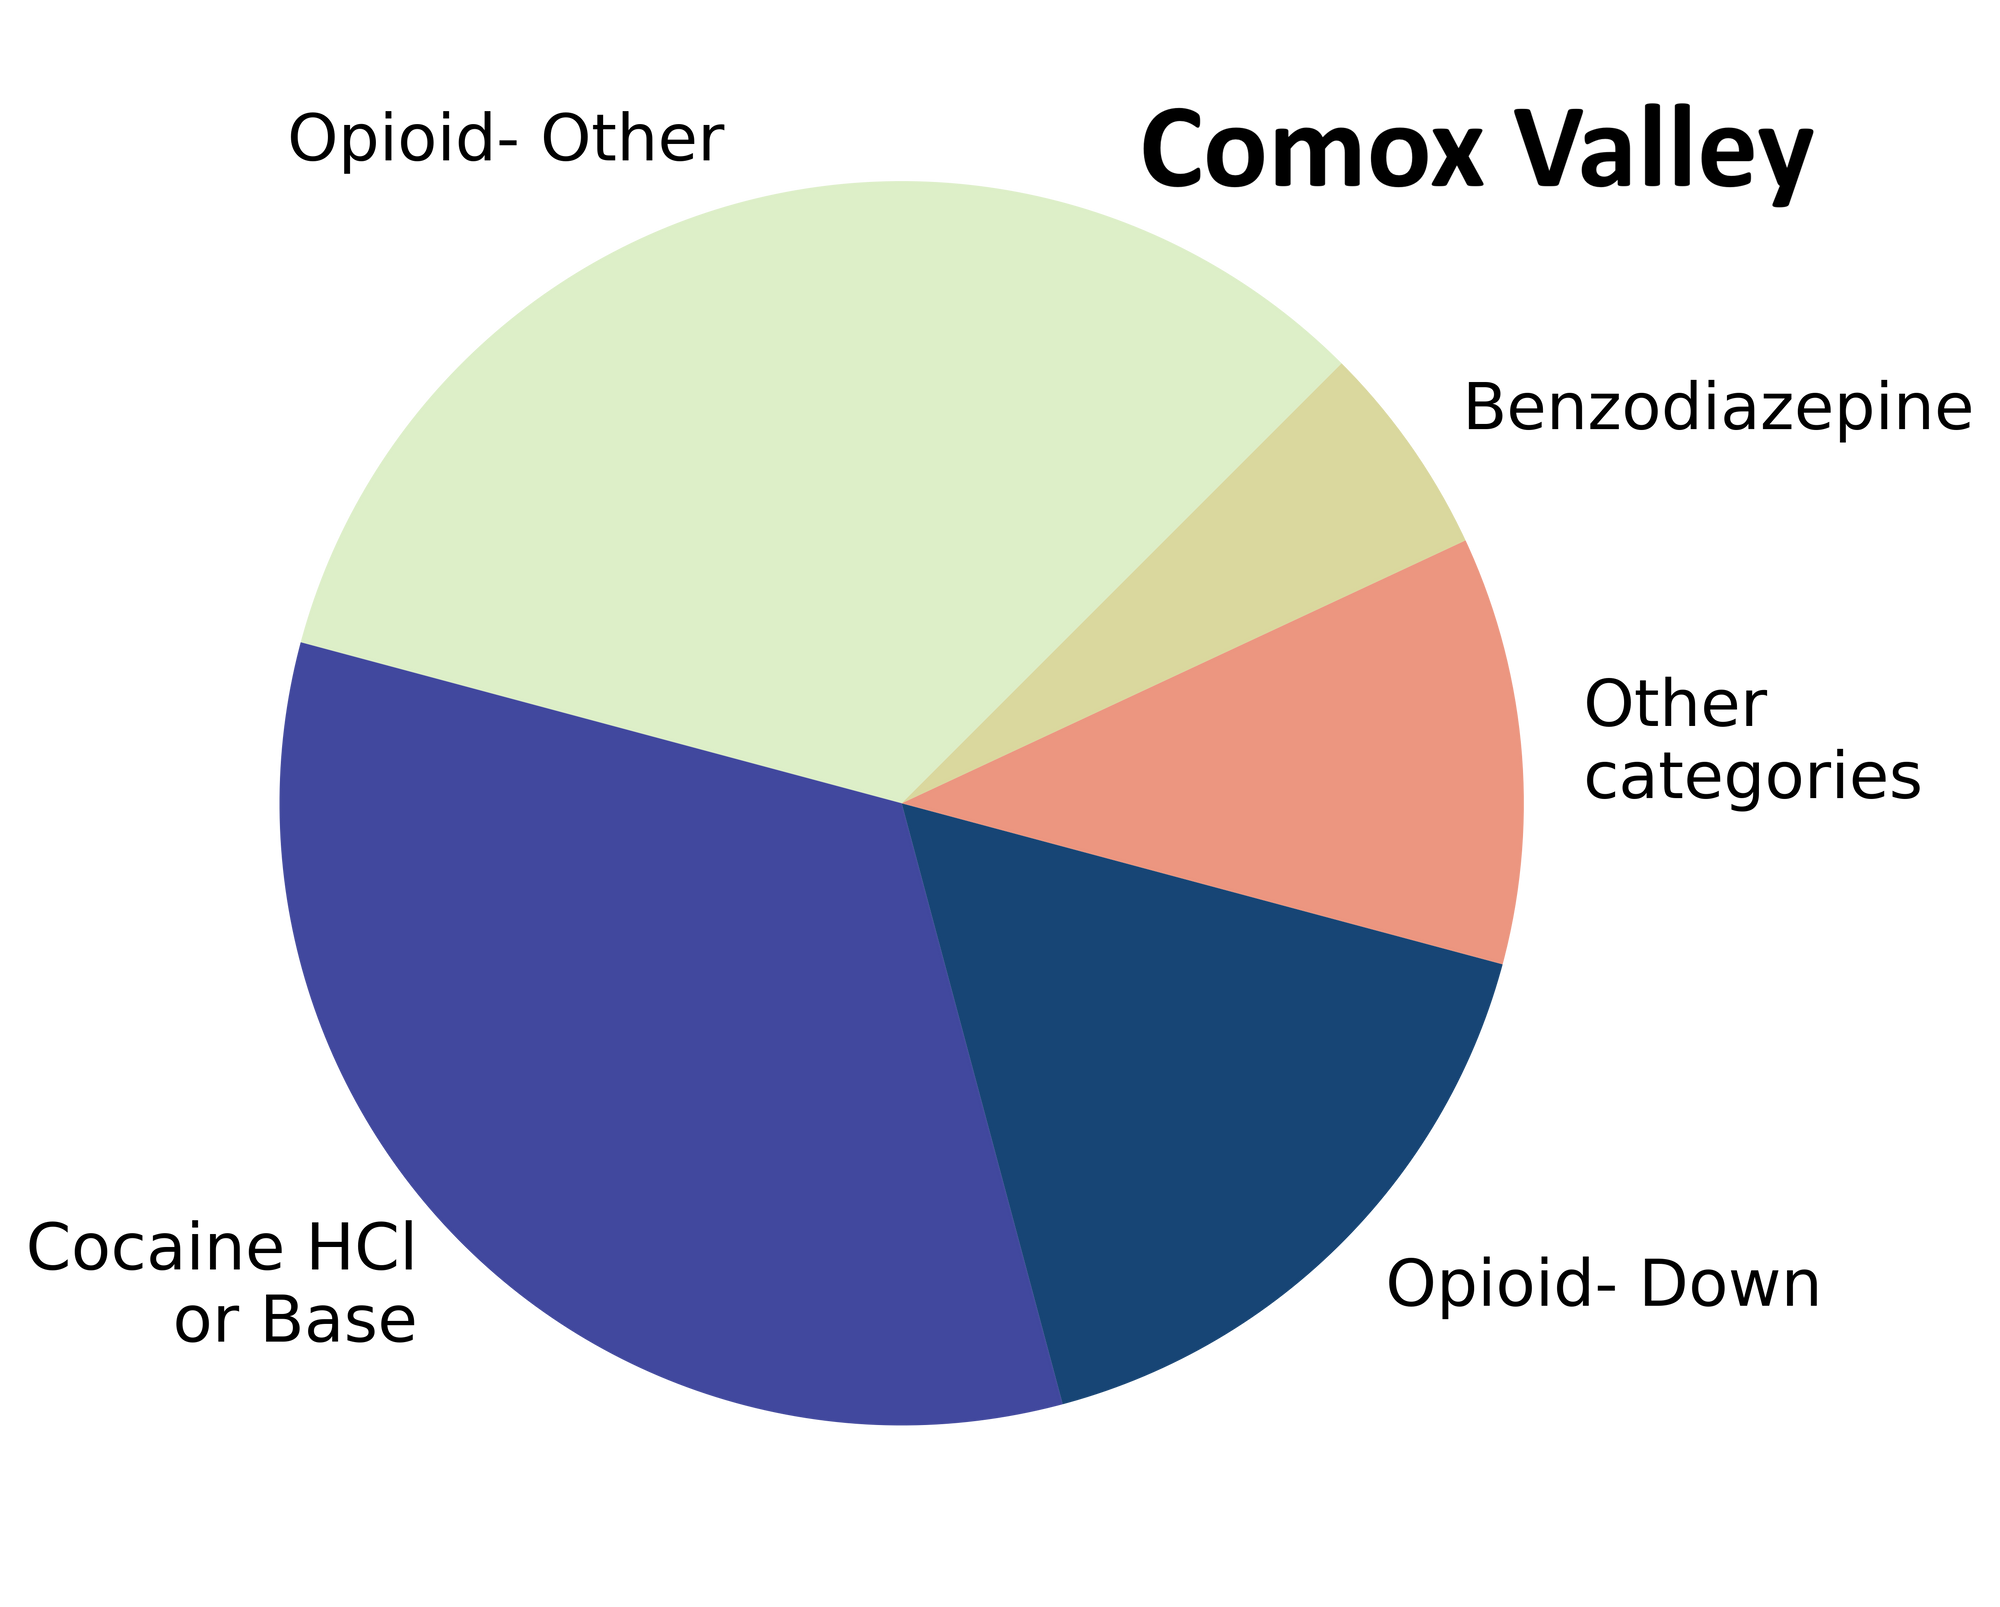
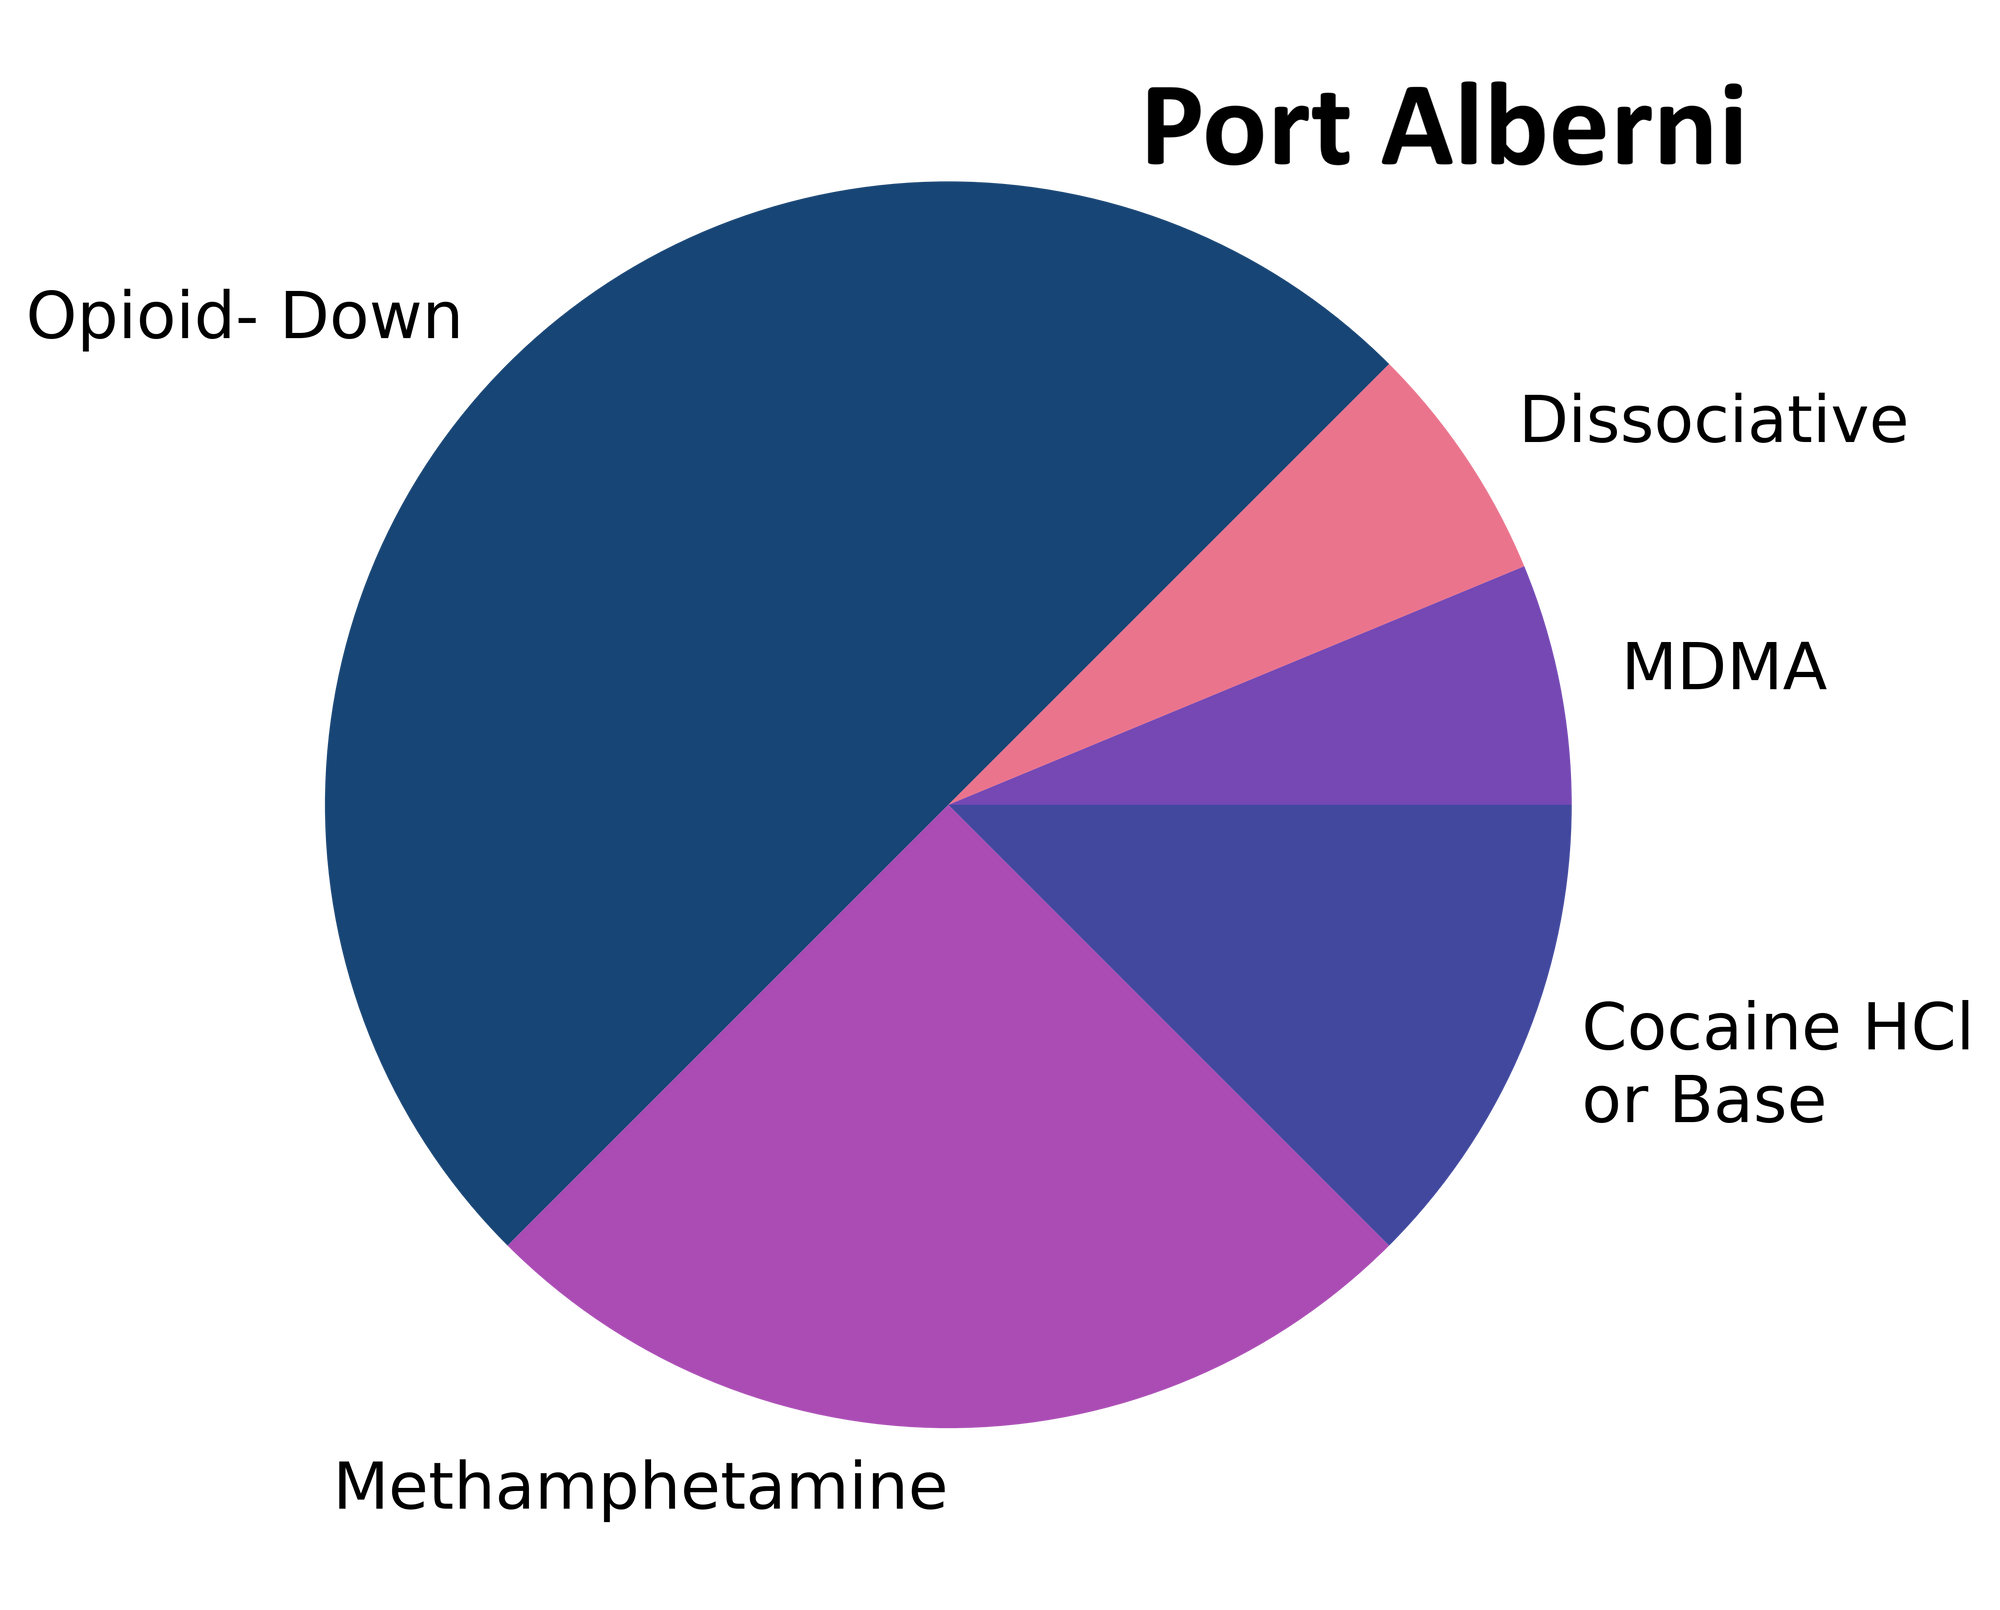
The scores of samples checked in September spanned the full suite of expected drug categories; Fig. 1 shows the prevalence of each expected drug category checked, split by sample collection location/method.

The synoptic scope on September’s supply
For a majority of samples checked, we confirm that the expected drug was indeed the only active and that no additional active compounds were present. The bar charts below highlight a few classes of drugs, differentiating samples when only the expected active was found from situations when other unexpected active components were detected.
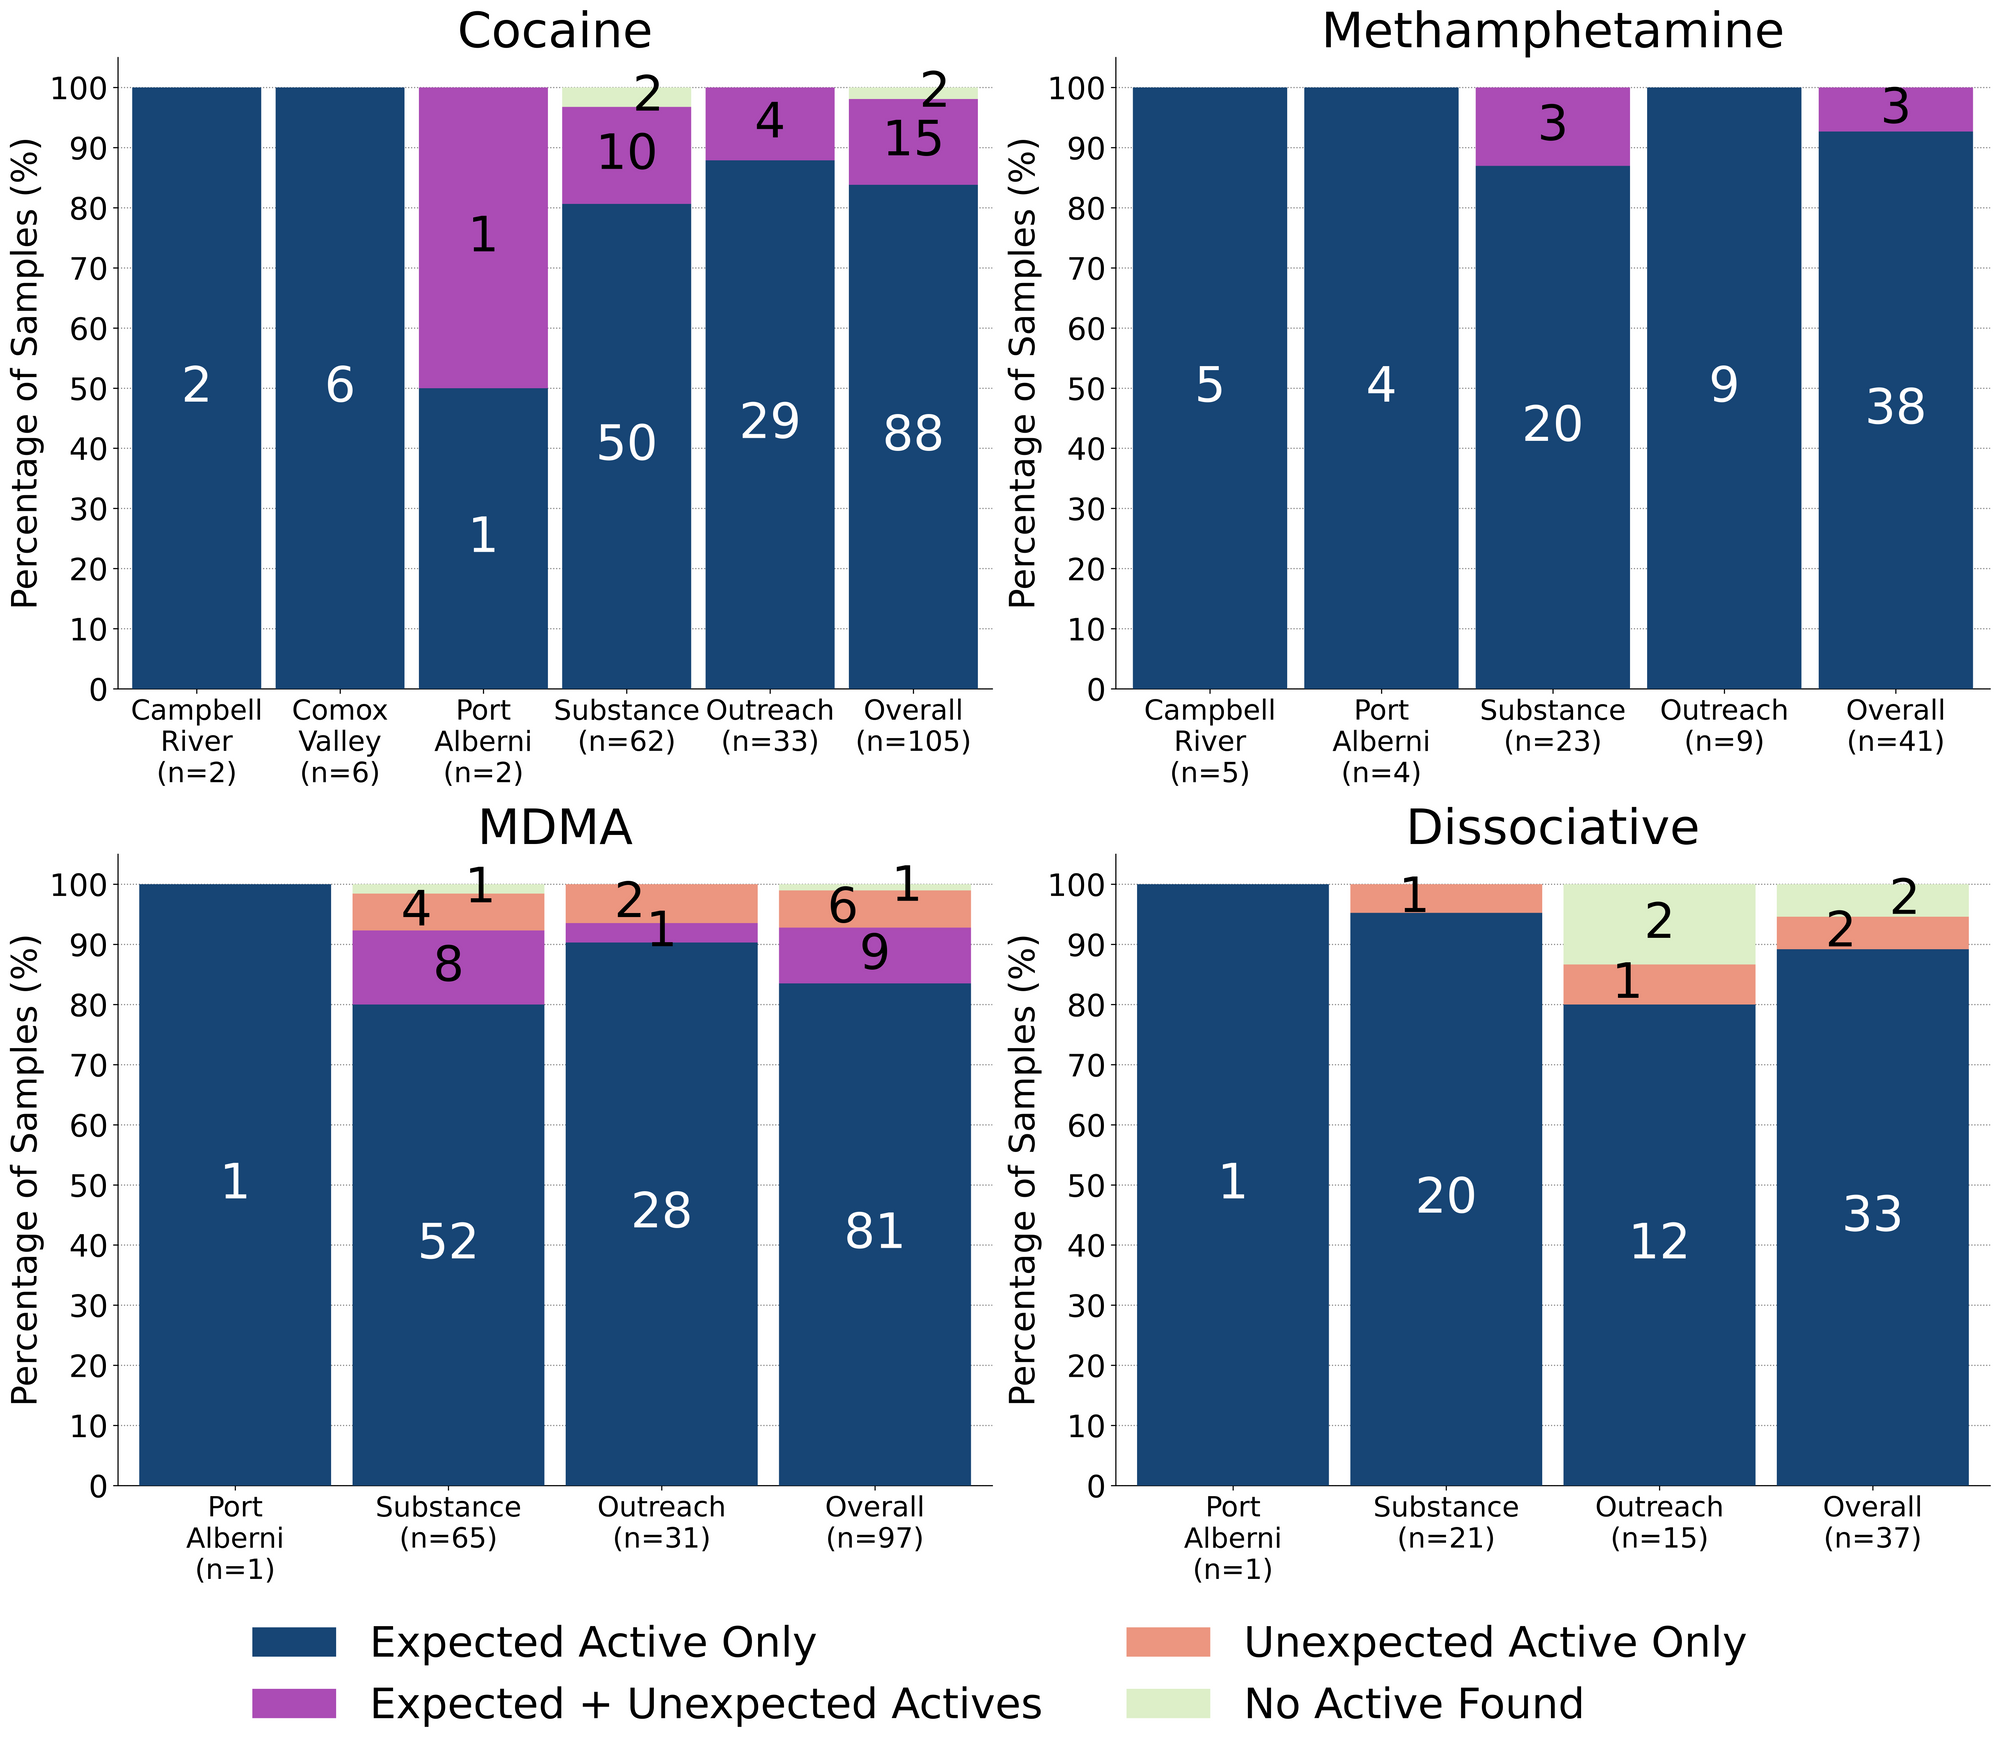
93% (38/41) of expected methamphetamine samples checked in September, across all collection locations/methods, were found to be meth with no other active compounds detected. Only one sample was found to be cut with MSM (dimethyl sulfone, an inactive compound and a common cutting agent found in meth) and another sample was cut with caffeine. Say the line, Bart! - Meth is (mostly) meth… - Yay! The remaining three samples were found to contain additional active compounds beyond meth; these samples were all collected in Victoria:
- One sample was found to contain around 40% methamphetamine and 60% MDA
- One sample was primarily methamphetamine with 3% amphetamine detected as well. This sample was recovered residue from a pipe
- One sample was found to contain around 60% meth and 10% fentanyl, with caffeine and microcrystalline cellulose as cutting agents. This sample was also pipe residue
84% (88/105) of expected cocaine samples checked were confirmed to be cocaine with no detectable active adulterants. Some inactive cuts were found within these samples:
- Baby powder/talc was detected in 2 samples. A sample from Nanaimo contained around 40% talc and another from Port Alberni contained around 10% talc)
- Creatine was detected in 1 sample that was checked at Rifflandia. This sample appeared to be around 75% cocaine and 25% creatine
15 samples contained an active component in addition to cocaine:
- Levamisole - 10 samples; an antihelminthic drug used to treat parasitic worm infections, commonly seen as a cut in cocaine
- 1 sample additionally contained phenacetin (see below)
- Phenacetin - 6 samples; “super buff” a tylenol-like drug, commonly seen as a cut in cocaine
- 1 sample was also found to contain levamisole (see above)
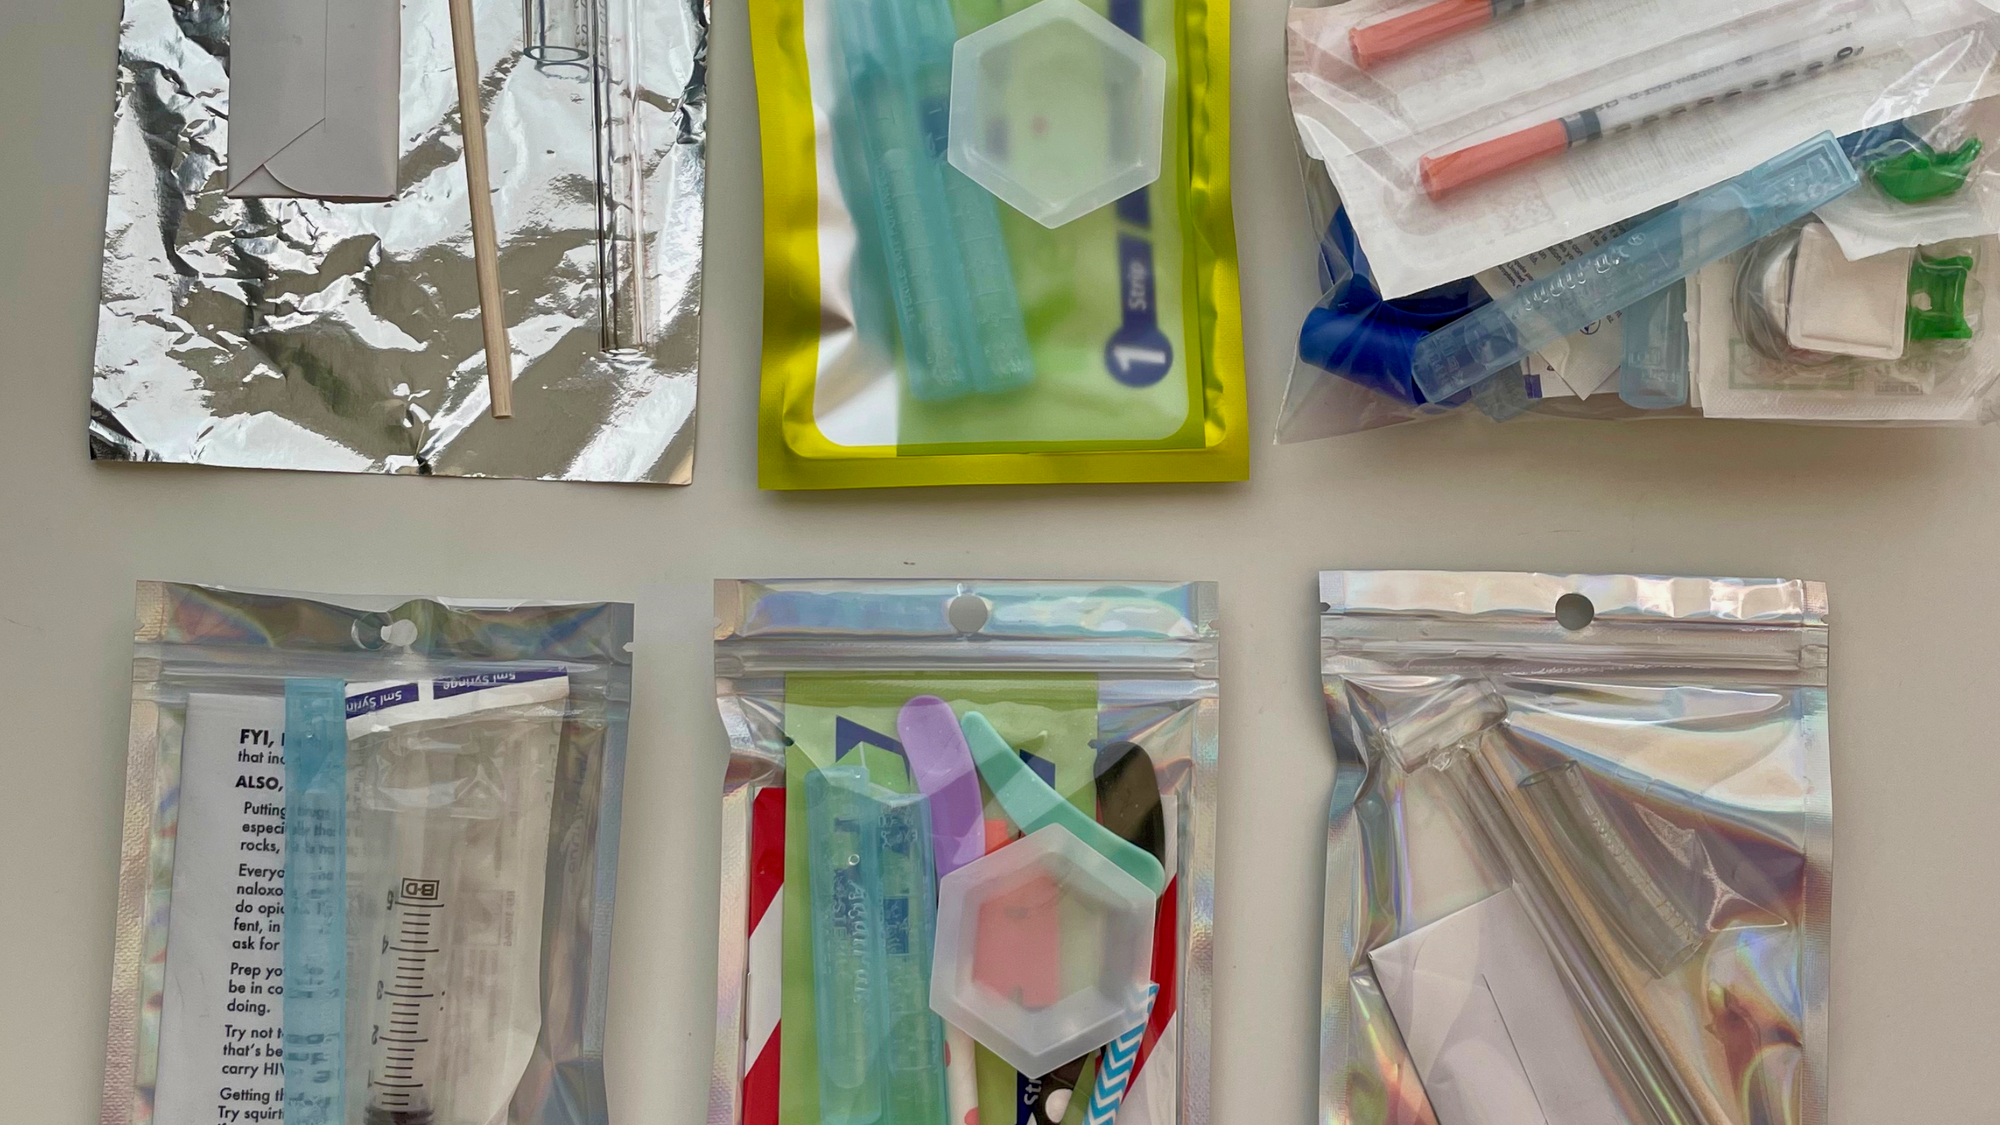
The remaining 2 expected cocaine samples were found to contain no cocaine: one sample was only baggie residue too sparse for us to run any of our tests beyond the fentanyl strip test (which was negative), and one sample from Victoria appeared to be ground/powdered glass. We can assure you that getting your stuff checked is less painful than snorting shards of glass and you can pick up a safer snorting kit when you stop by.
84% (81/97) of expected MDA/MDMA samples checked were confirmed to be the expected MDA/MDMA, with the MDMA-to-MDA mixup representing a majority of the remaining samples:
- 5 expected MDMA samples were found to just be MDA
- 1 expected MDA samples were found to be MDMA instead
- 8 samples were found to contain both MDMA and MDA
- 1 expected MDMA sample from Victoria contained MDMA and around 15% ketamine
- 1 sample collected in Victoria did not contain MDMA and instead was found to be MSM (dimethyl sulfone, and inert cut)
89% (33/37) expected ketamine samples checked were confirmed to be ketamine with no other active compounds detected. One sample collected in Victoria was found to be cocaine HCl, rather than ketamine, and two of the five expected ketamine samples that were checked during our Rifflandia pop-up did not contain any ketamine; one sample was found to be MDMA, and the other was just sodium bicarbonate (baking soda). The remaining expected ketamine sample was found to be monosodium glutamate (MSG) instead. Baggie mix ups happen, especially with similar looking compounds; we hope this ketamine-to-MSG swap was solved and did not result in some savoury flavours being substituted with a Michelin Star rated K-hole.
Benzodiazepines (n=19)
74% (14/19) of the benzodiazepine samples checked in September came to our service in the form of pressed pills; the remaining five samples were powders. 12 of the 14 pills were expected to be alprazolam (Xanax), one was expected to be diazepam (Valium), and one was expected to be nitrazolam. The diazepam and nitrazolam were confirmed to be diazepam and nitrazolam, while only one of the expected alprazolam/Xanax tablets was confirmed to contain alprazolam. The 11 other pressed pills were found to contain a benzo or benzo-related drug other than alprazolam:
- Bromazolam - 6 samples. Bromazolam is comparable in both strength and duration to alprazolam. While bromazolam has been the most common benzo found within the local opioid-down supply since July, this is the first time we have found bromazolam in pressed counterfeit Xanax pills
- Flualprazolam - 3 samples. Flualprazolam is ~2x stronger than alprazolam in terms of dosage but has a similar duration of effect (5-8 hours)
- Etizolam - 1 sample. Etizolam is ~2x weaker than alprazolam in terms of dosage but has a similar duration of effect (5-8 hours)
- Undifferentiated benzodiazepine - 2 samples. These samples tested positive for benzos via the immunoassay strip test, but we could not identify which benzo was present with our other instruments
Within the five powder samples:
- One unknown benzo powder was found to be etizolam
- One sample was found to be bromazolam powder, as expected
- One expected alprazolam powder was found to be flualprazolam
- One sample, a dark teal powder collected in Victoria, was found to contain 2% etizolam, 1% fentanyl, 0.2% xylazine, and caffeine
- One sample, a light blue powder collected in the Comox Valley, was found to contain etizolam, fentanyl, caffeine, and erythritol, though we were unable to quantify these compounds with the PS-MS
Opioid-Down (n=278)
In this section we present results specific to the opioid-down supply, therefore they may differ from the highlighted findings above that are inclusive of all expected drug categories.
- 91% of expected opioid-down samples contained fentanyl (252/278)
- 18 (6%) samples contained heroin, with a median concentration >80% and a range of 11% to >80%:
- 15 samples were just heroin (and related alkaloids like acetylmorphine (MAM) and acetylcodeine)
- Three samples additionally contained fentanyl at 0.2%, 2%, and 14%. These three samples contained heroin at 11%, 14%, and 14%, and fluorofentanyl at 3%, 5%, and 18%, respectively. No benzos were detected in any of these samples.
- 11 samples contained carfentanil, with a median concentration of 0.48% and a range of 0.01% to 1.80%
- 47% of expected opioid-down samples contained a benzodiazepine and/or etizolam (131/278)
- Xylazine was detected in 5% (13/278) of opioid-down samples, with a median concentration of 4.2% and a range of 0.1% to 18.1%
This September, 71% of all opioid-down samples checked contained an additional active to the expected fentanyl. Examining Fig 3. we can see that the down supply has remained consistently inconsistent:
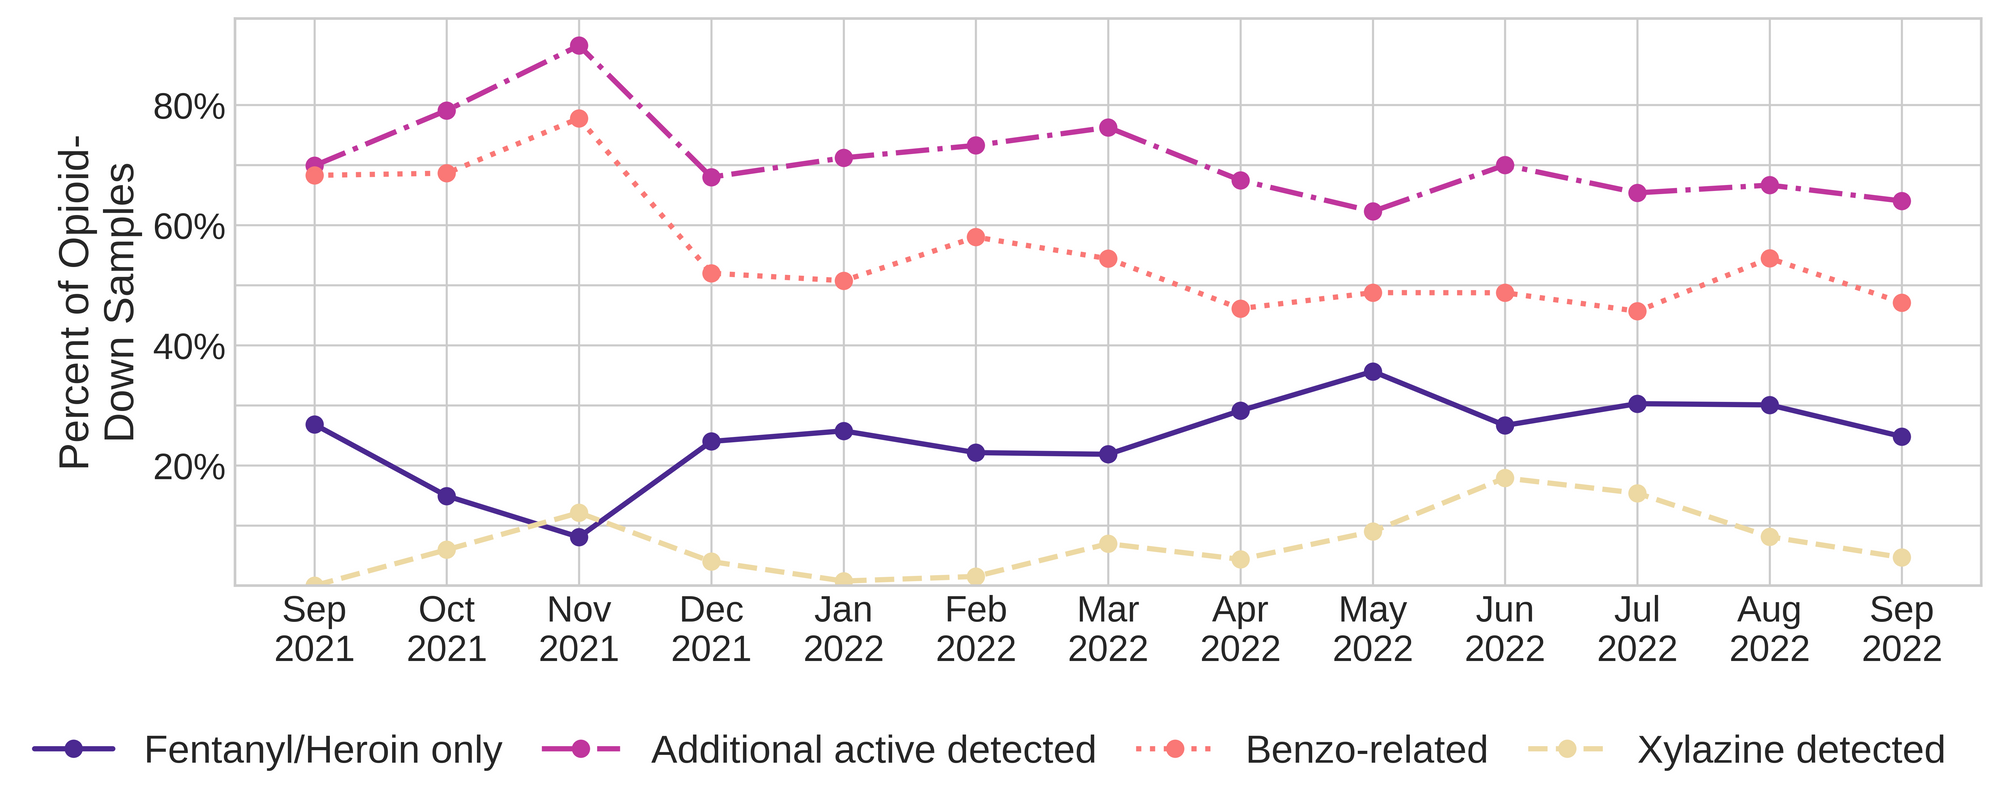
Benzo-related drugs remain the primary contributor to the additional actives found in expected opioid-down samples with 47% (131/278) of expected opioid-down samples checked containing a benzo-related drug.
Bromazolam continues to be the most common benzo seen in the down supply, and the percentage of down samples containing bromazolam continues to increase: 25% of opioid-down samples contained bromazolam in September (69/278), 24% (60/246) in August, 14% (30/208) in July, 6% (15/240) in June, and 8% (19/244) in May. Alternatively, we could look at bromazolam’s contribution to benzo-positive down samples: 53% of benzo-positive down samples contained bromazolam in September (69/131), compared to 45% in August (60/134), 32% (30/95) in July, 13% (15/117) in June, and 16% (19/119) in May. Prior to May, we were unable to quantify/detect bromazolam on our mass spectrometer.
Unexpected fentanyl analogues like fluorofentanyl (76 samples), and the sedative xylazine (13 samples) represent a majority of the remaining adulterants, though scattered detections of other drugs are still found and can be reviewed in the pdf report at the end of this blog.
Quantification for Expected Opioid-Down[1]
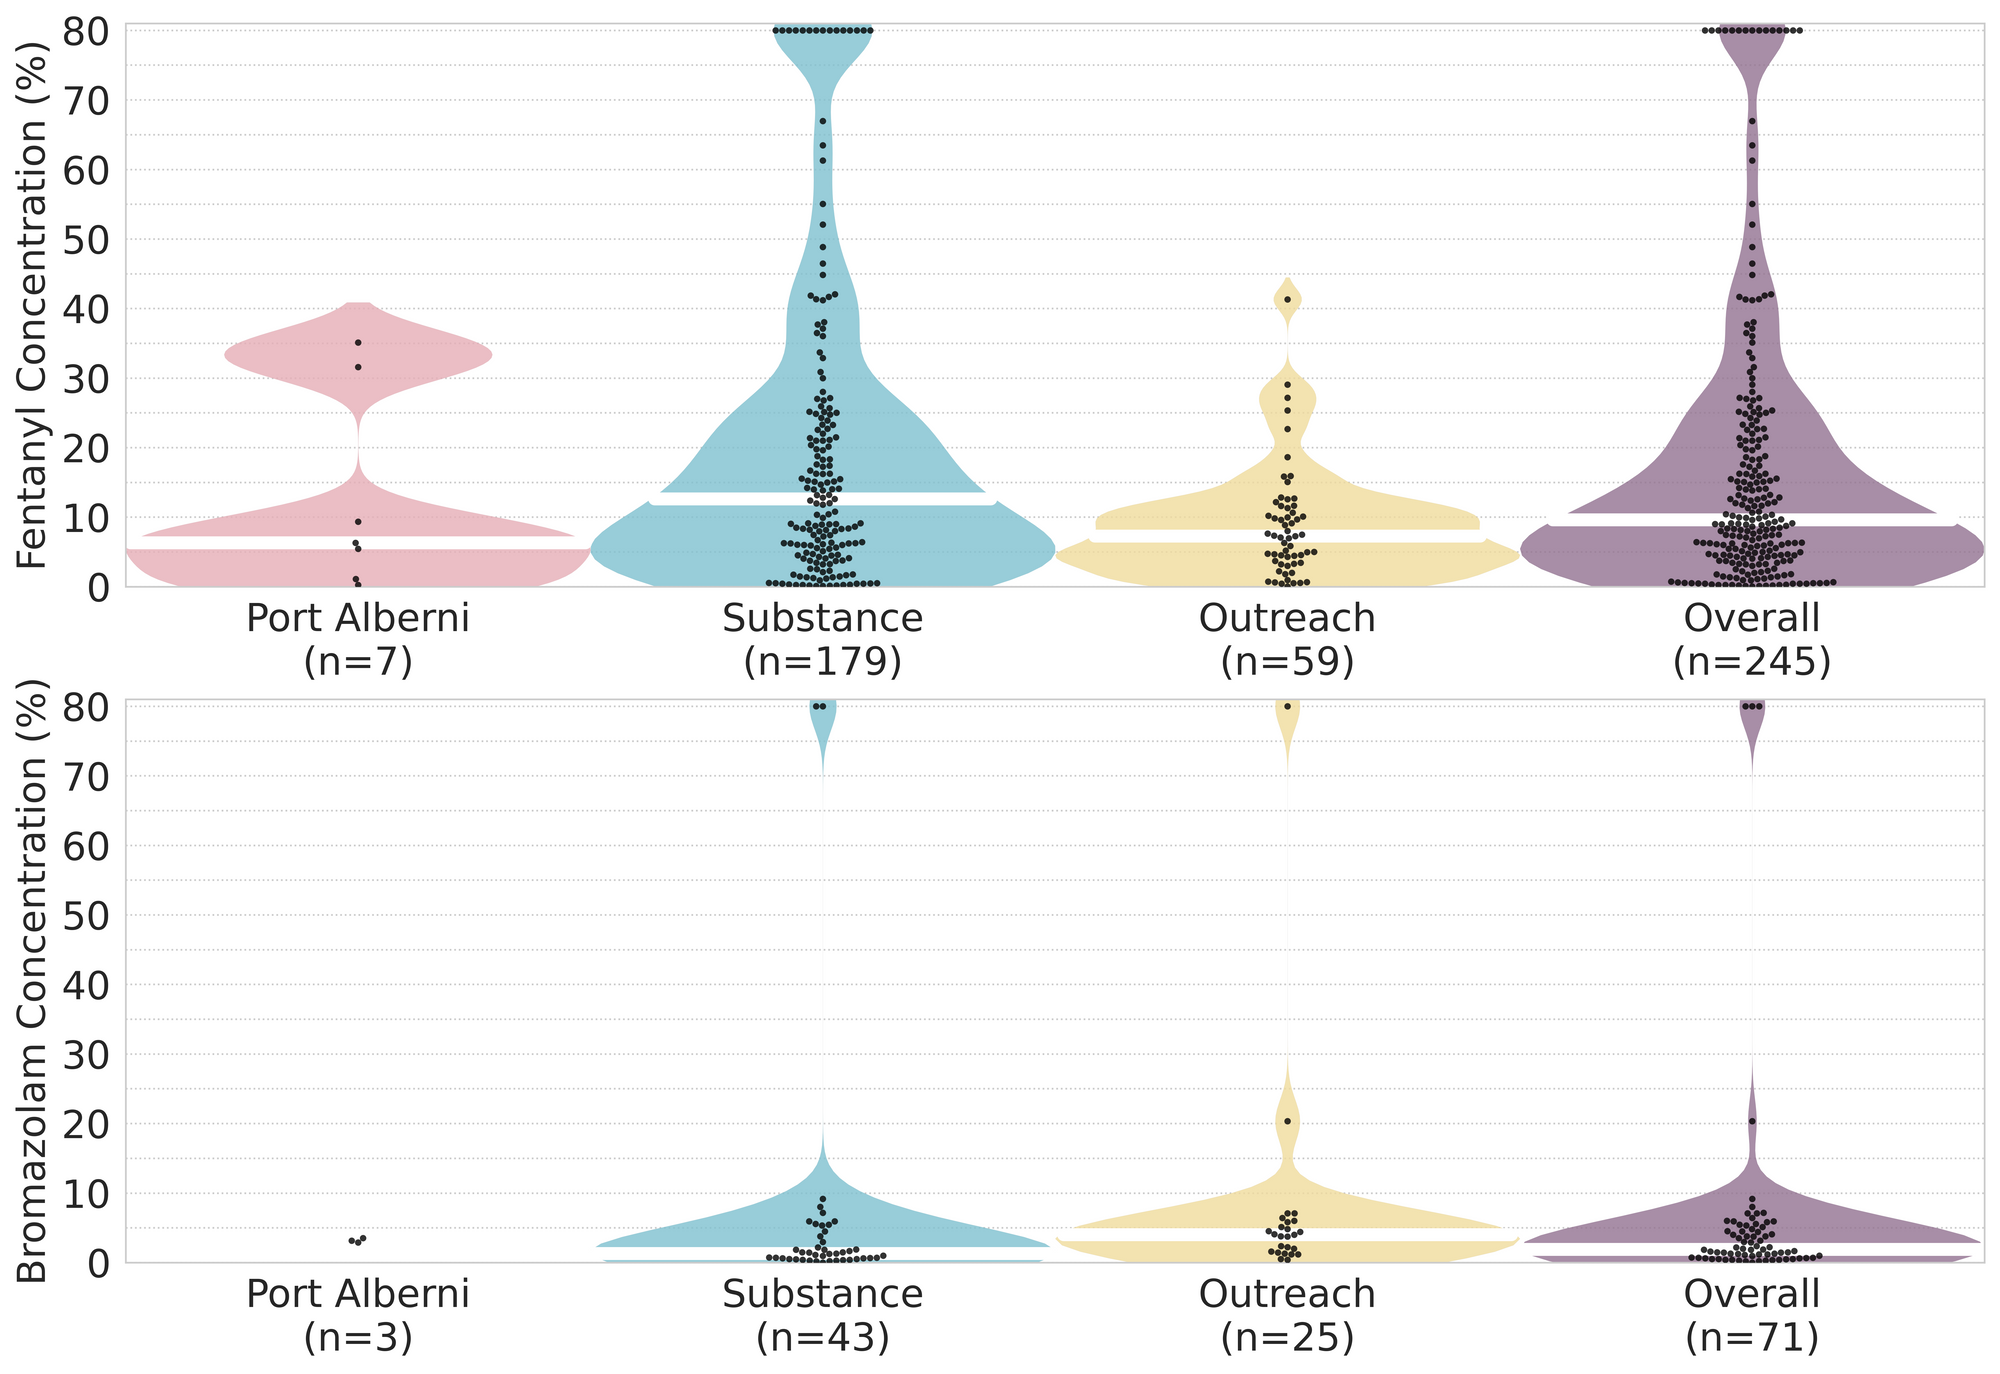
In September, we quantified fentanyl for 245 of the expected opioid-down samples containing fentanyl and found the median concentration to be 9.7%[2] with the average strength of fentanyl we normally see being around 15%. This is a small dip in the median compared to previous months which were closer to 13%. Though the median is a useful indicator, it doesn’t capture the volatility of fentanyl concentrations present in the opioid supply, as any one sample might be the lowest strength (0.1%) or the strongest (>80%[3]). Similarly, the concentration of bromazolam, our ongoing benzo-representative, was across the board in expected opioid down samples, ranging from 0.1% to >80%[3:1] , with a median of 2.2%.
Not all opioid down samples brought to our service can be quantified. This is primarily due to too limited sample collected for our instruments to report a reliable mass percentage. Nevertheless, qualitative detection is still possible. ↩︎
This number is specific to fentanyl quantified in opioid-down samples. The median concentration listed in the Key Findings at the beginning of this blog (9.69%) is inclusive of all samples checked, across all drug classes, that contained fentanyl. ↩︎
For samples that contain more than 80% fenanyl, or more than 25% etizolam by weight, our mass spectrometer is presently unable to reproducibly assign a concentration due to the upper limits of the calibration methods currently adopted. ↩︎ ↩︎

The fentanyl and bromazolam concentrations that we quantified in September, across all expected drug categories, are presented in Fig. 4. Black dots are individual samples, Horizontal white bars show the median concentrations of fentanyl and bromazolam quantified, the width of the shaded regions mirrors the number of samples at a given concentration.
Want to be notified when we release these reports? Join our mailing list to receive updates about when our reports are out. You can subscribe and unsubscribe yourself from this list at any time.
Check back next month for the October report!
As always, send us feedback at substance@uvic.ca for how we can continue to offer our drug checking results in a useful way.