July 2022 Monthly Report

In this blog post we discuss our July 2022 report and provide more information on how to interpret the results. The PDF report can be found at the end.
Key findings:
- The median fentanyl concentration found, across all expected drug categories, was 11.7%, with a maximum of over 80%
- Carfentanil was found in 5 (2%) expected opioid-down samples, with a median concentration of 0.22% and maximum concentration of 0.41%
- Benzodiazepines and/or etizolam were found in 46% of expected opioid-down samples
- The maximum concentration of etizolam found was >25%, in an expected opioid-down sample
- Xylazine, a veterinary sedative, was found in 32 (15%) of expected opioid-down samples with a median concentration of 1.0% and a maximum concentration of 15.8%
Insight for the July 2022 Monthly Report
July, the dog days of summer. While the phrase is suggestive of hot and lethargic doldrums, here at Substance July was neither hot (thanks to a new AC unit that kept us and the community cool) nor lethargic (considering we were busy checking 575 samples between Victoria, Port Alberni, and Campbell River), nor dull with all the people (and pups) that came into our service site for snacks and water. Instead, July was as bright and lively as the star that the“dog days” are named after.
This blog, and the associated pdf report, breakdown our sample counts into four categories:
-
samples received through direct service provision in Victoria, where service users are bringing samples into the Substance storefront. These samples are labelled as “Substance” samples in the figures/tables of this blog post
-
samples received through direct service provision in Port Alberni, where service users are bringing samples into PASS’s OPS. These samples are labelled as “Port Alberni” samples in the figures/tables of this blog post.
-
samples received through direct service provision in Campbell River, where service users are bringing samples to the Vancouver Island Mental Health Society (VIHMS). These samples are labelled as “Campbell River” samples in the figures/tables of this blog post.
-
samples received through indirect service provision, where samples are being collected through no contact drop-off envelopes, mail-in envelopes, or are being collected by harm reduction workers and/or other community members at supported housing sites, at overdose prevention sites, and supervised consumption locations. These samples are labelled as “Outreach” samples in the figures/tables herein.
Drug types
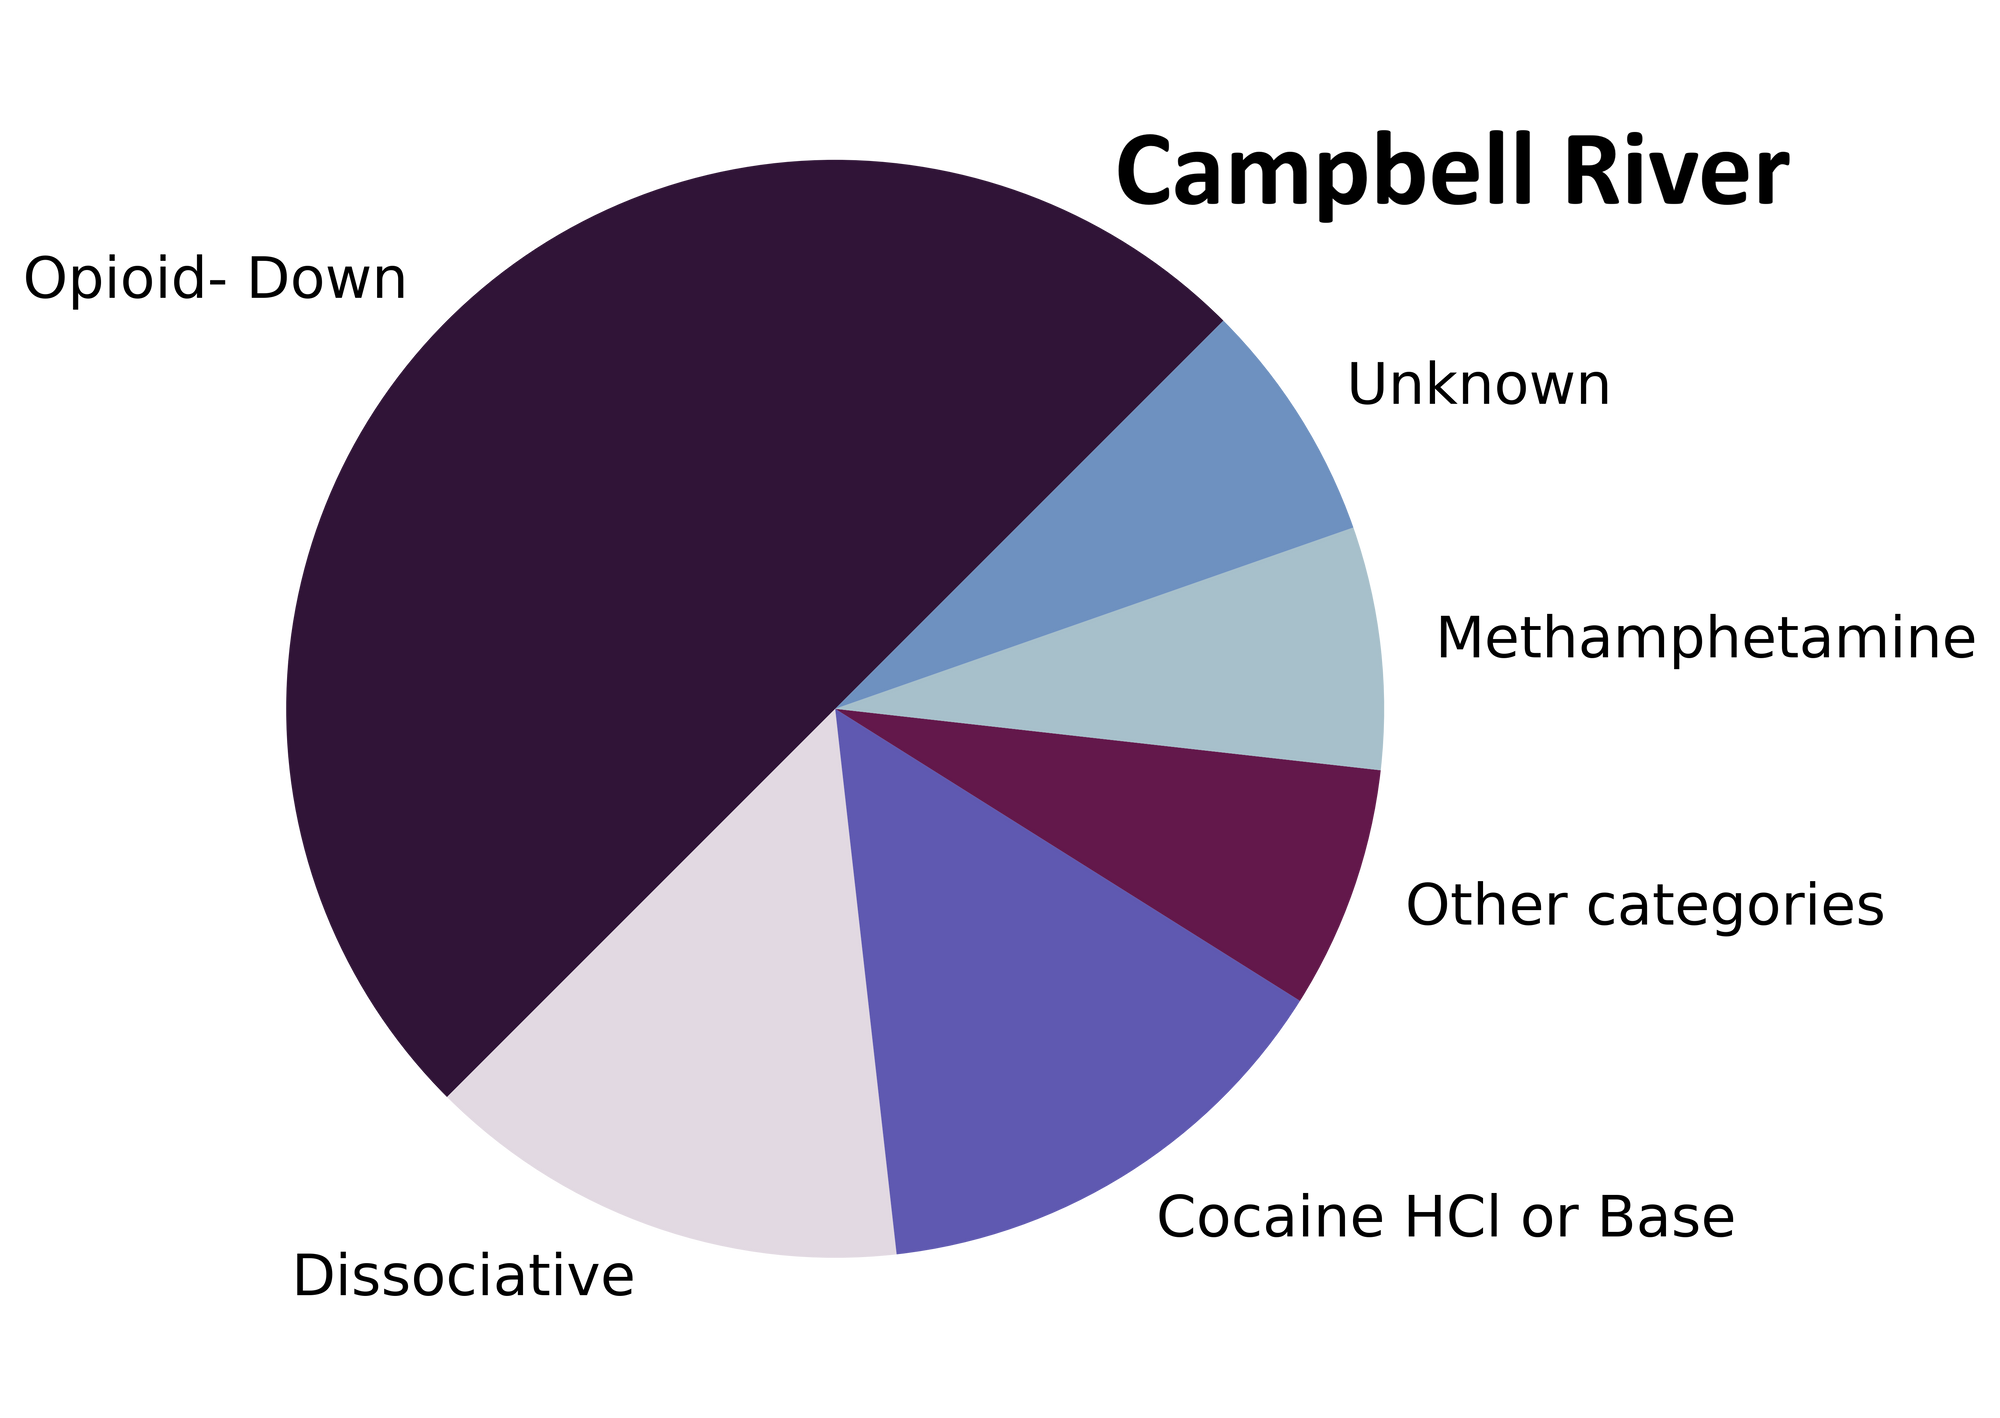
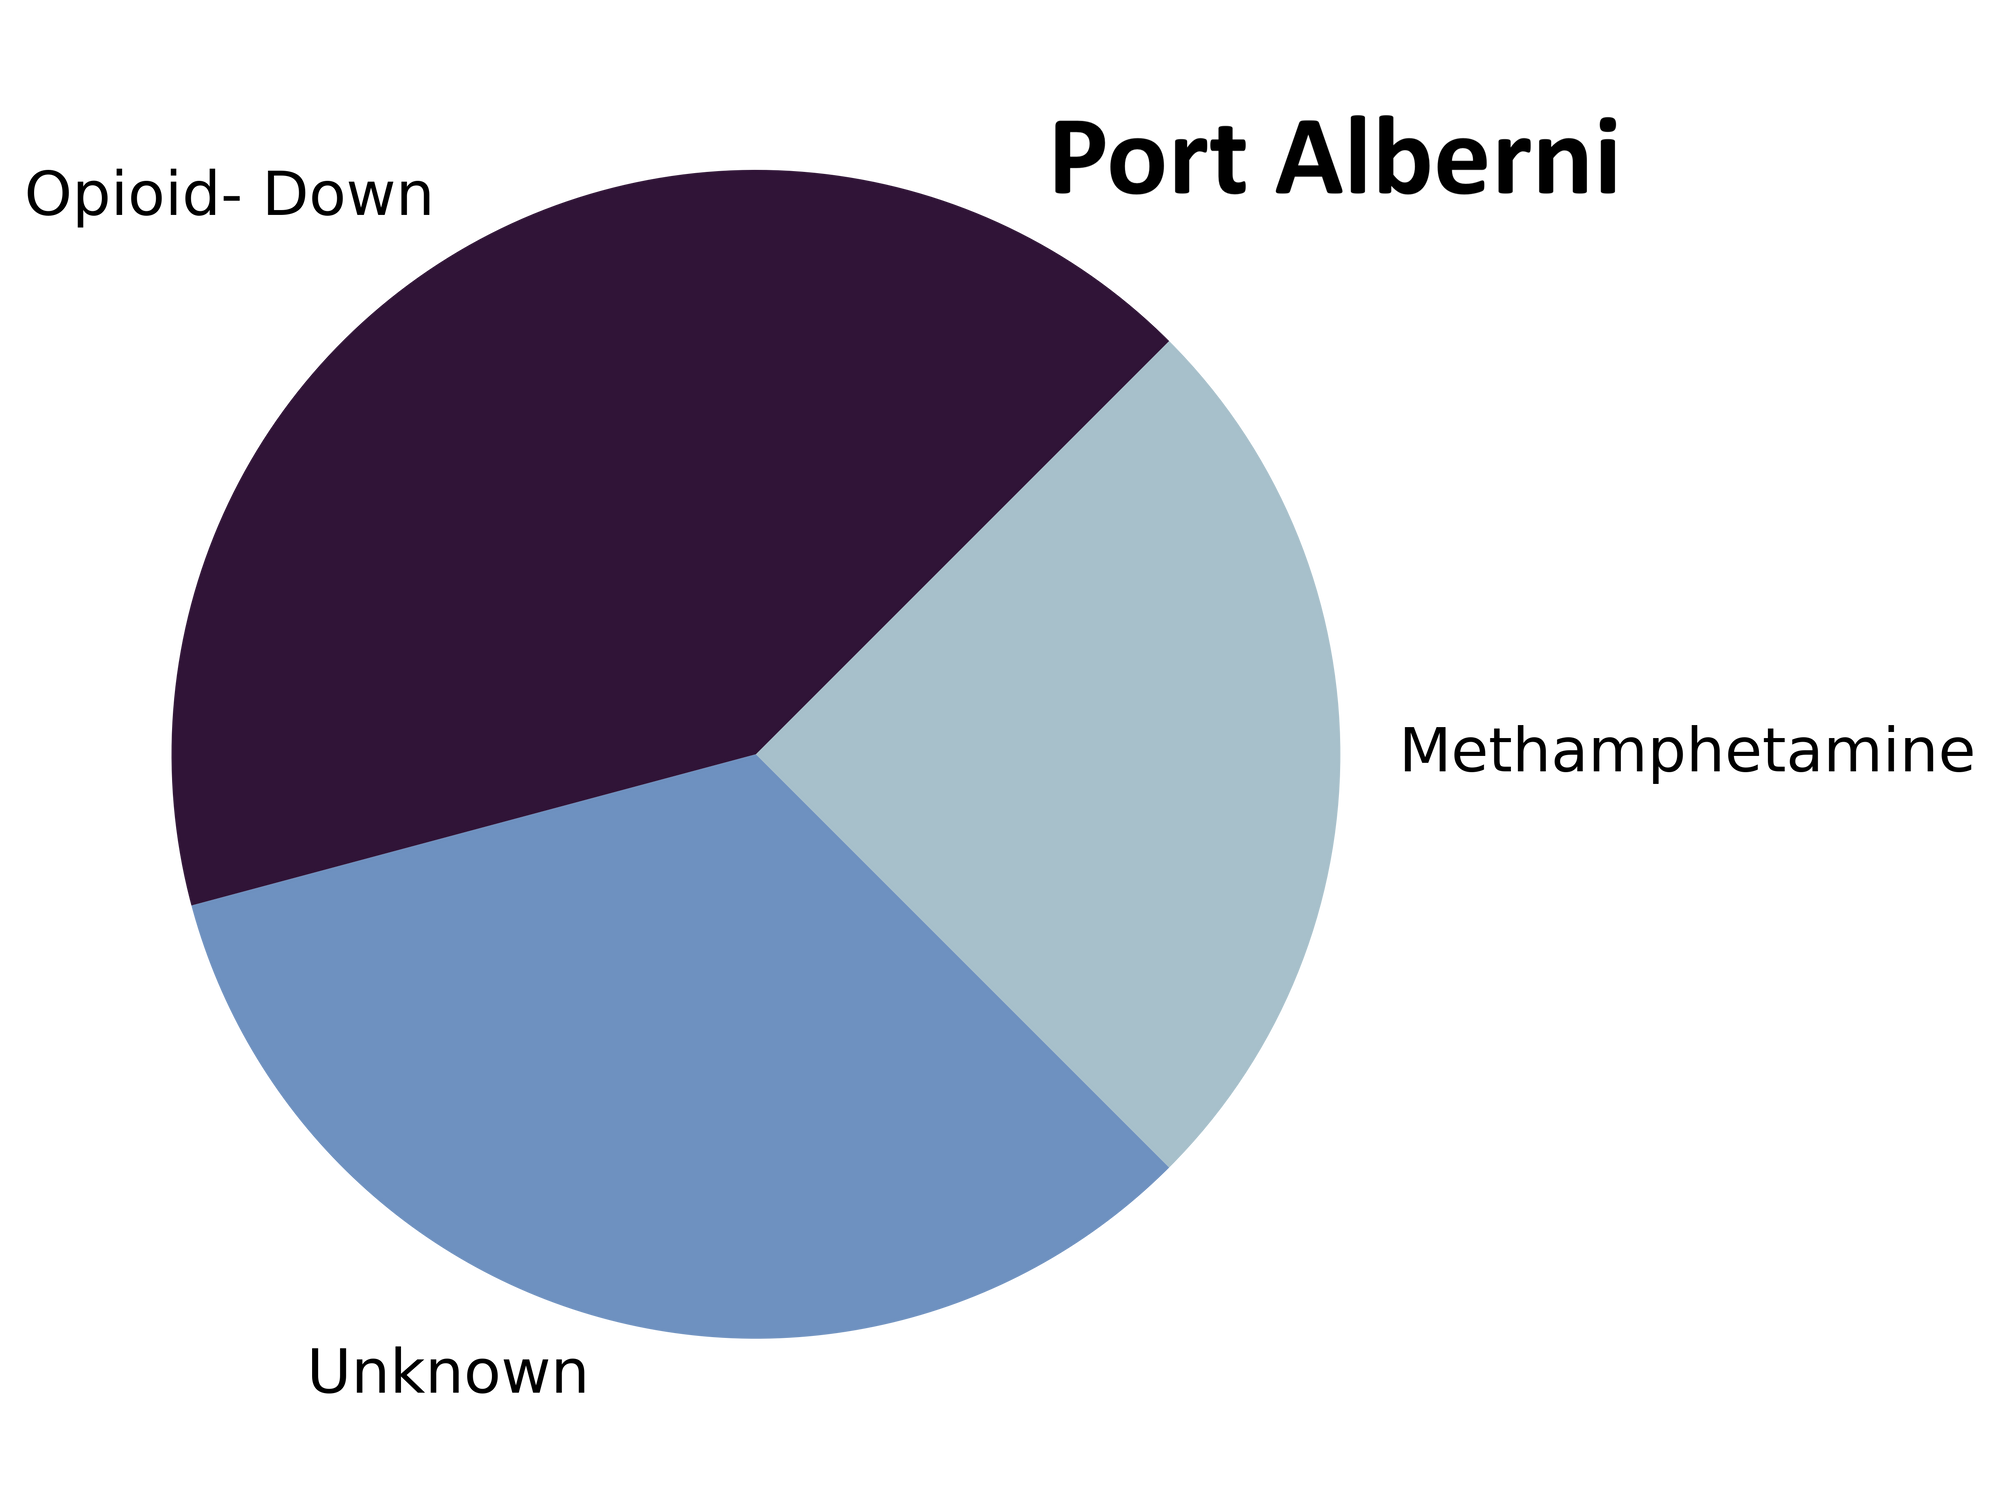
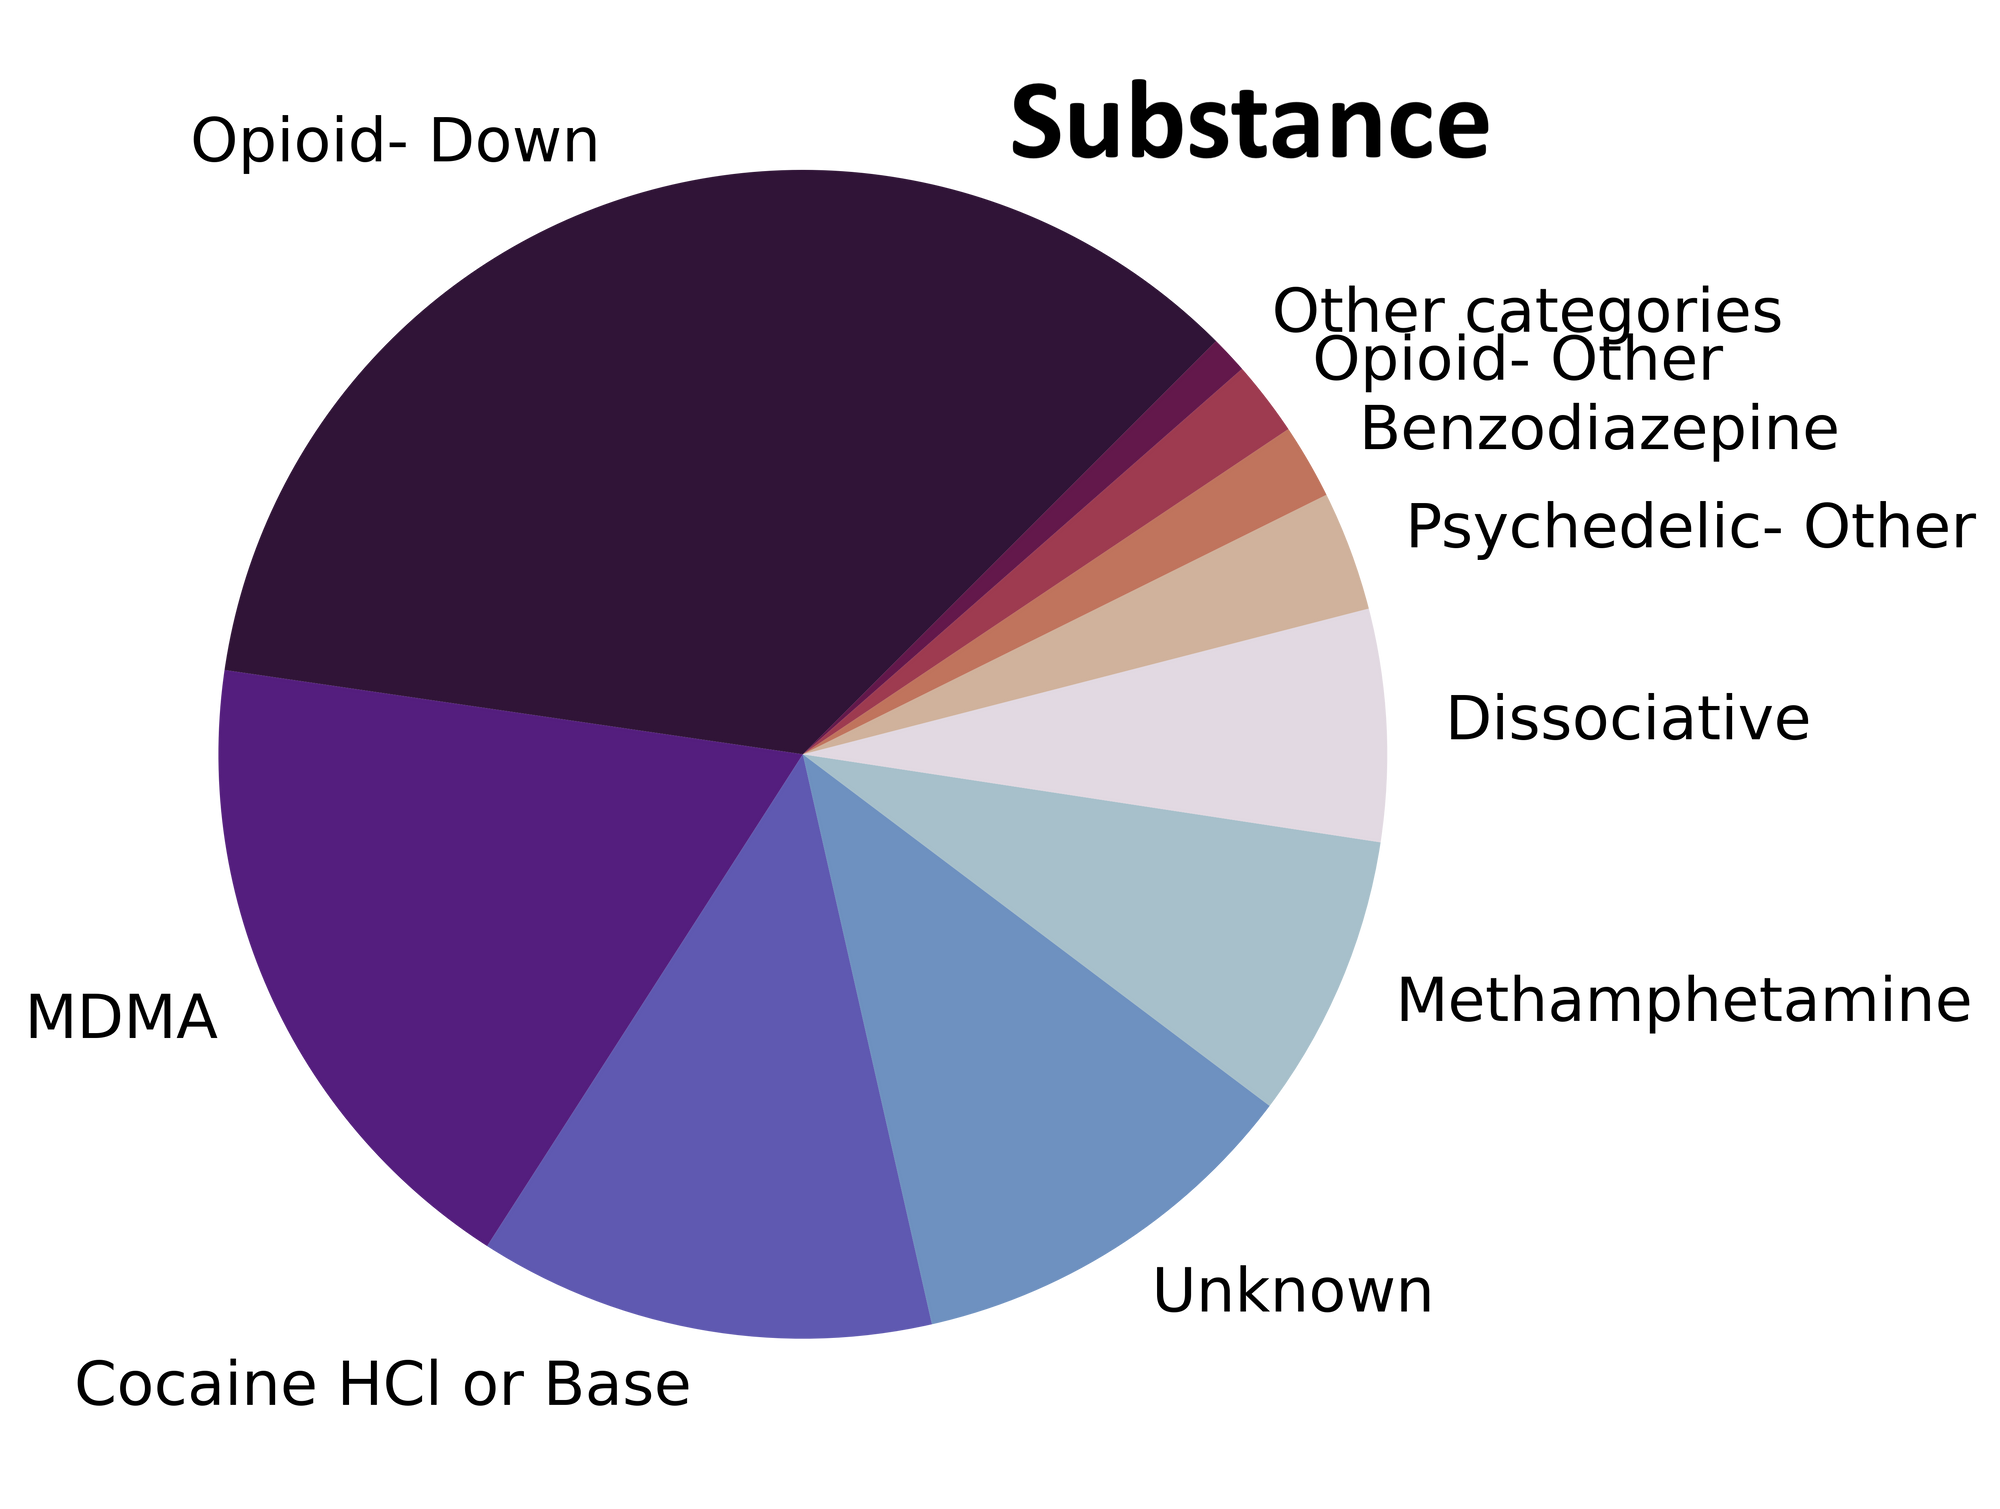
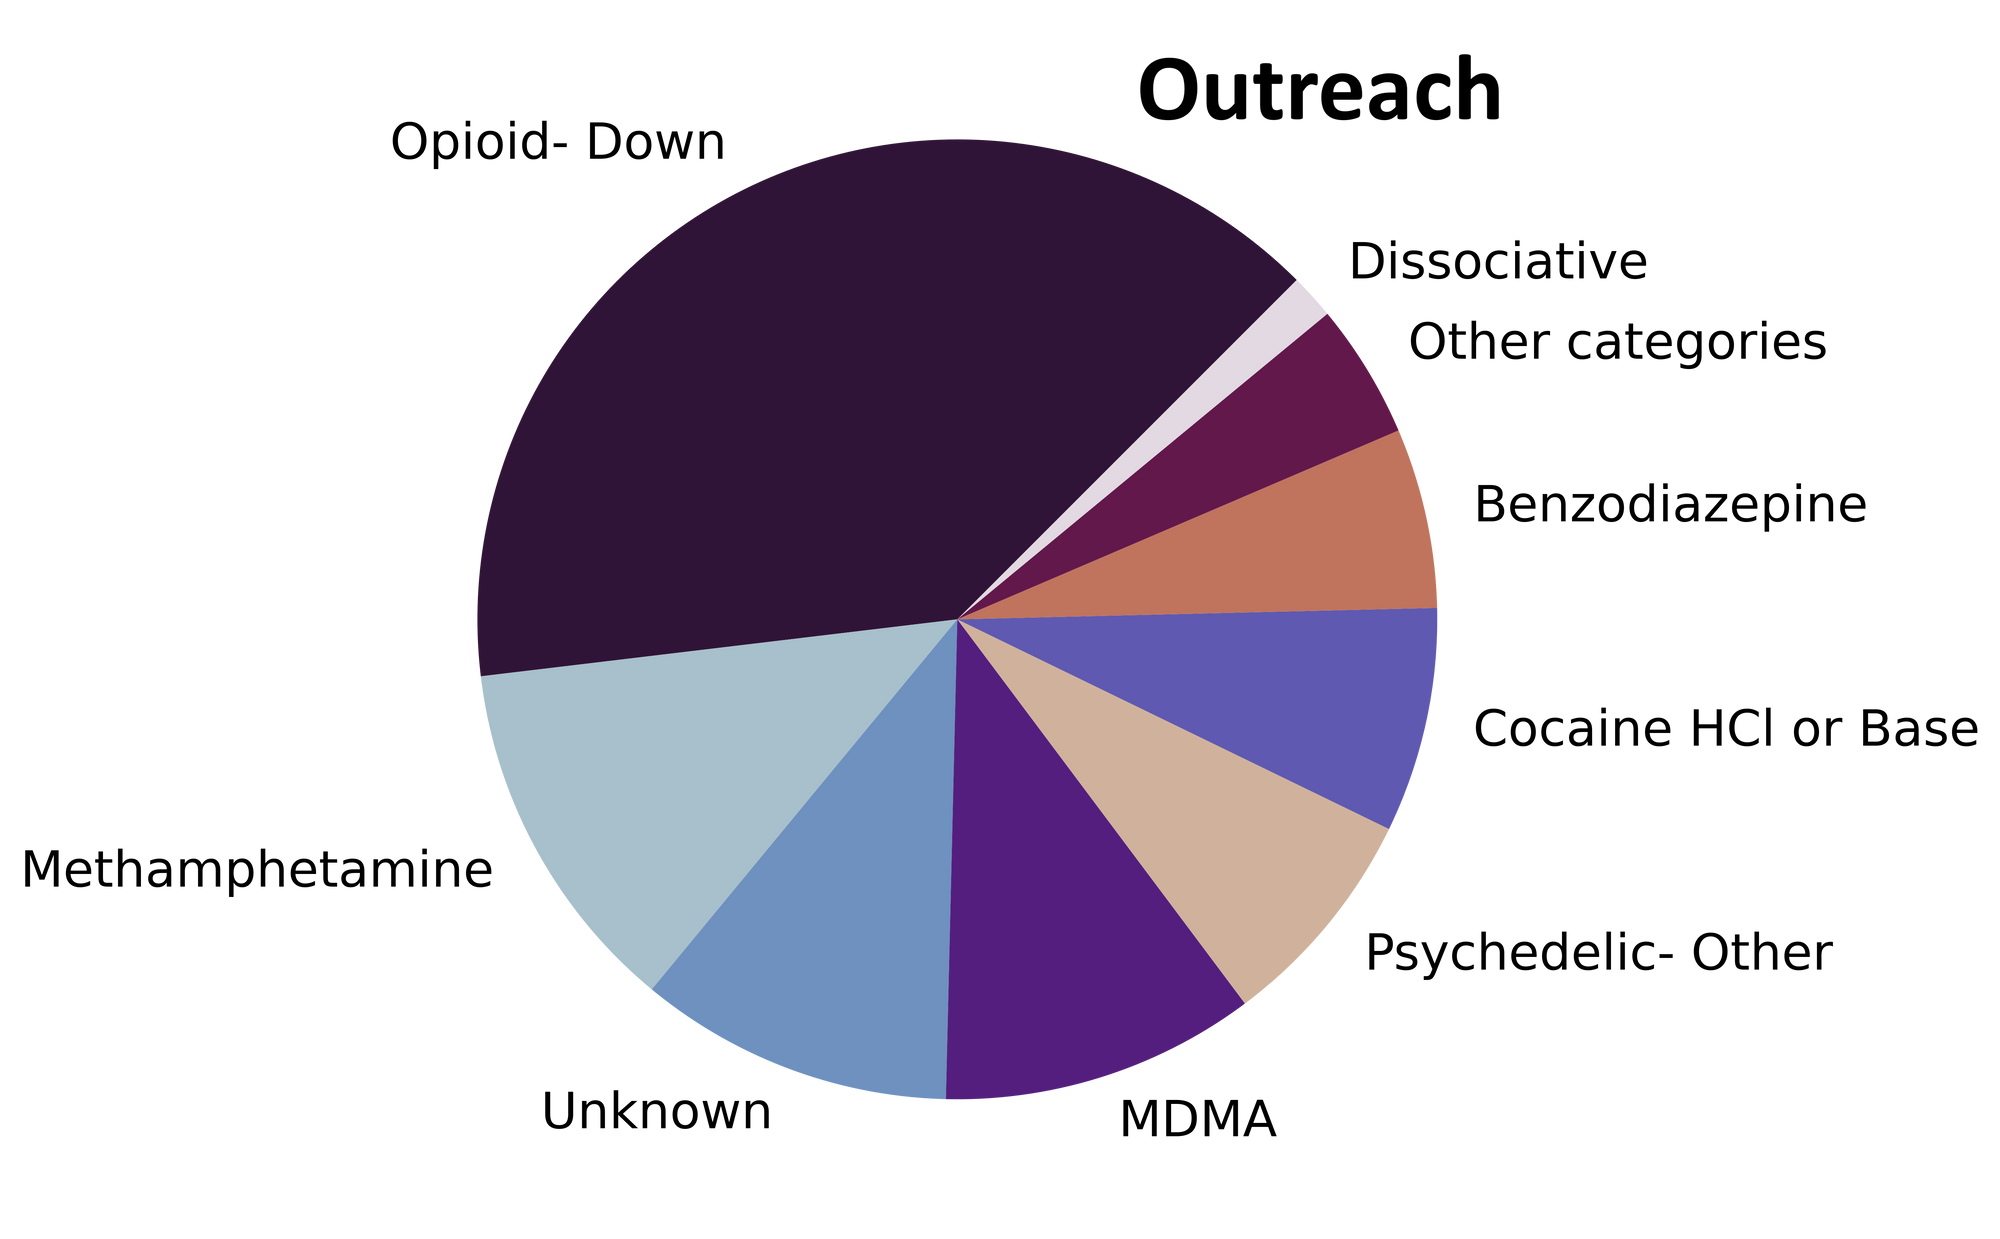
The monsoon of samples that stormed through our doors in July carried everything from mescaline to morphine. Fig. 1 shows the prevalence of each expected drug category checked, split by sample collection location/method.

The monthly monocomponent and mixture makeup monologue
For a majority of samples checked, we confirm that the expected drug was indeed the only active and that no additional active compounds were present. The bar charts below highlight a few classes of drugs, differentiating samples when only the expected active was found from situations when other unexpected active components were detected.
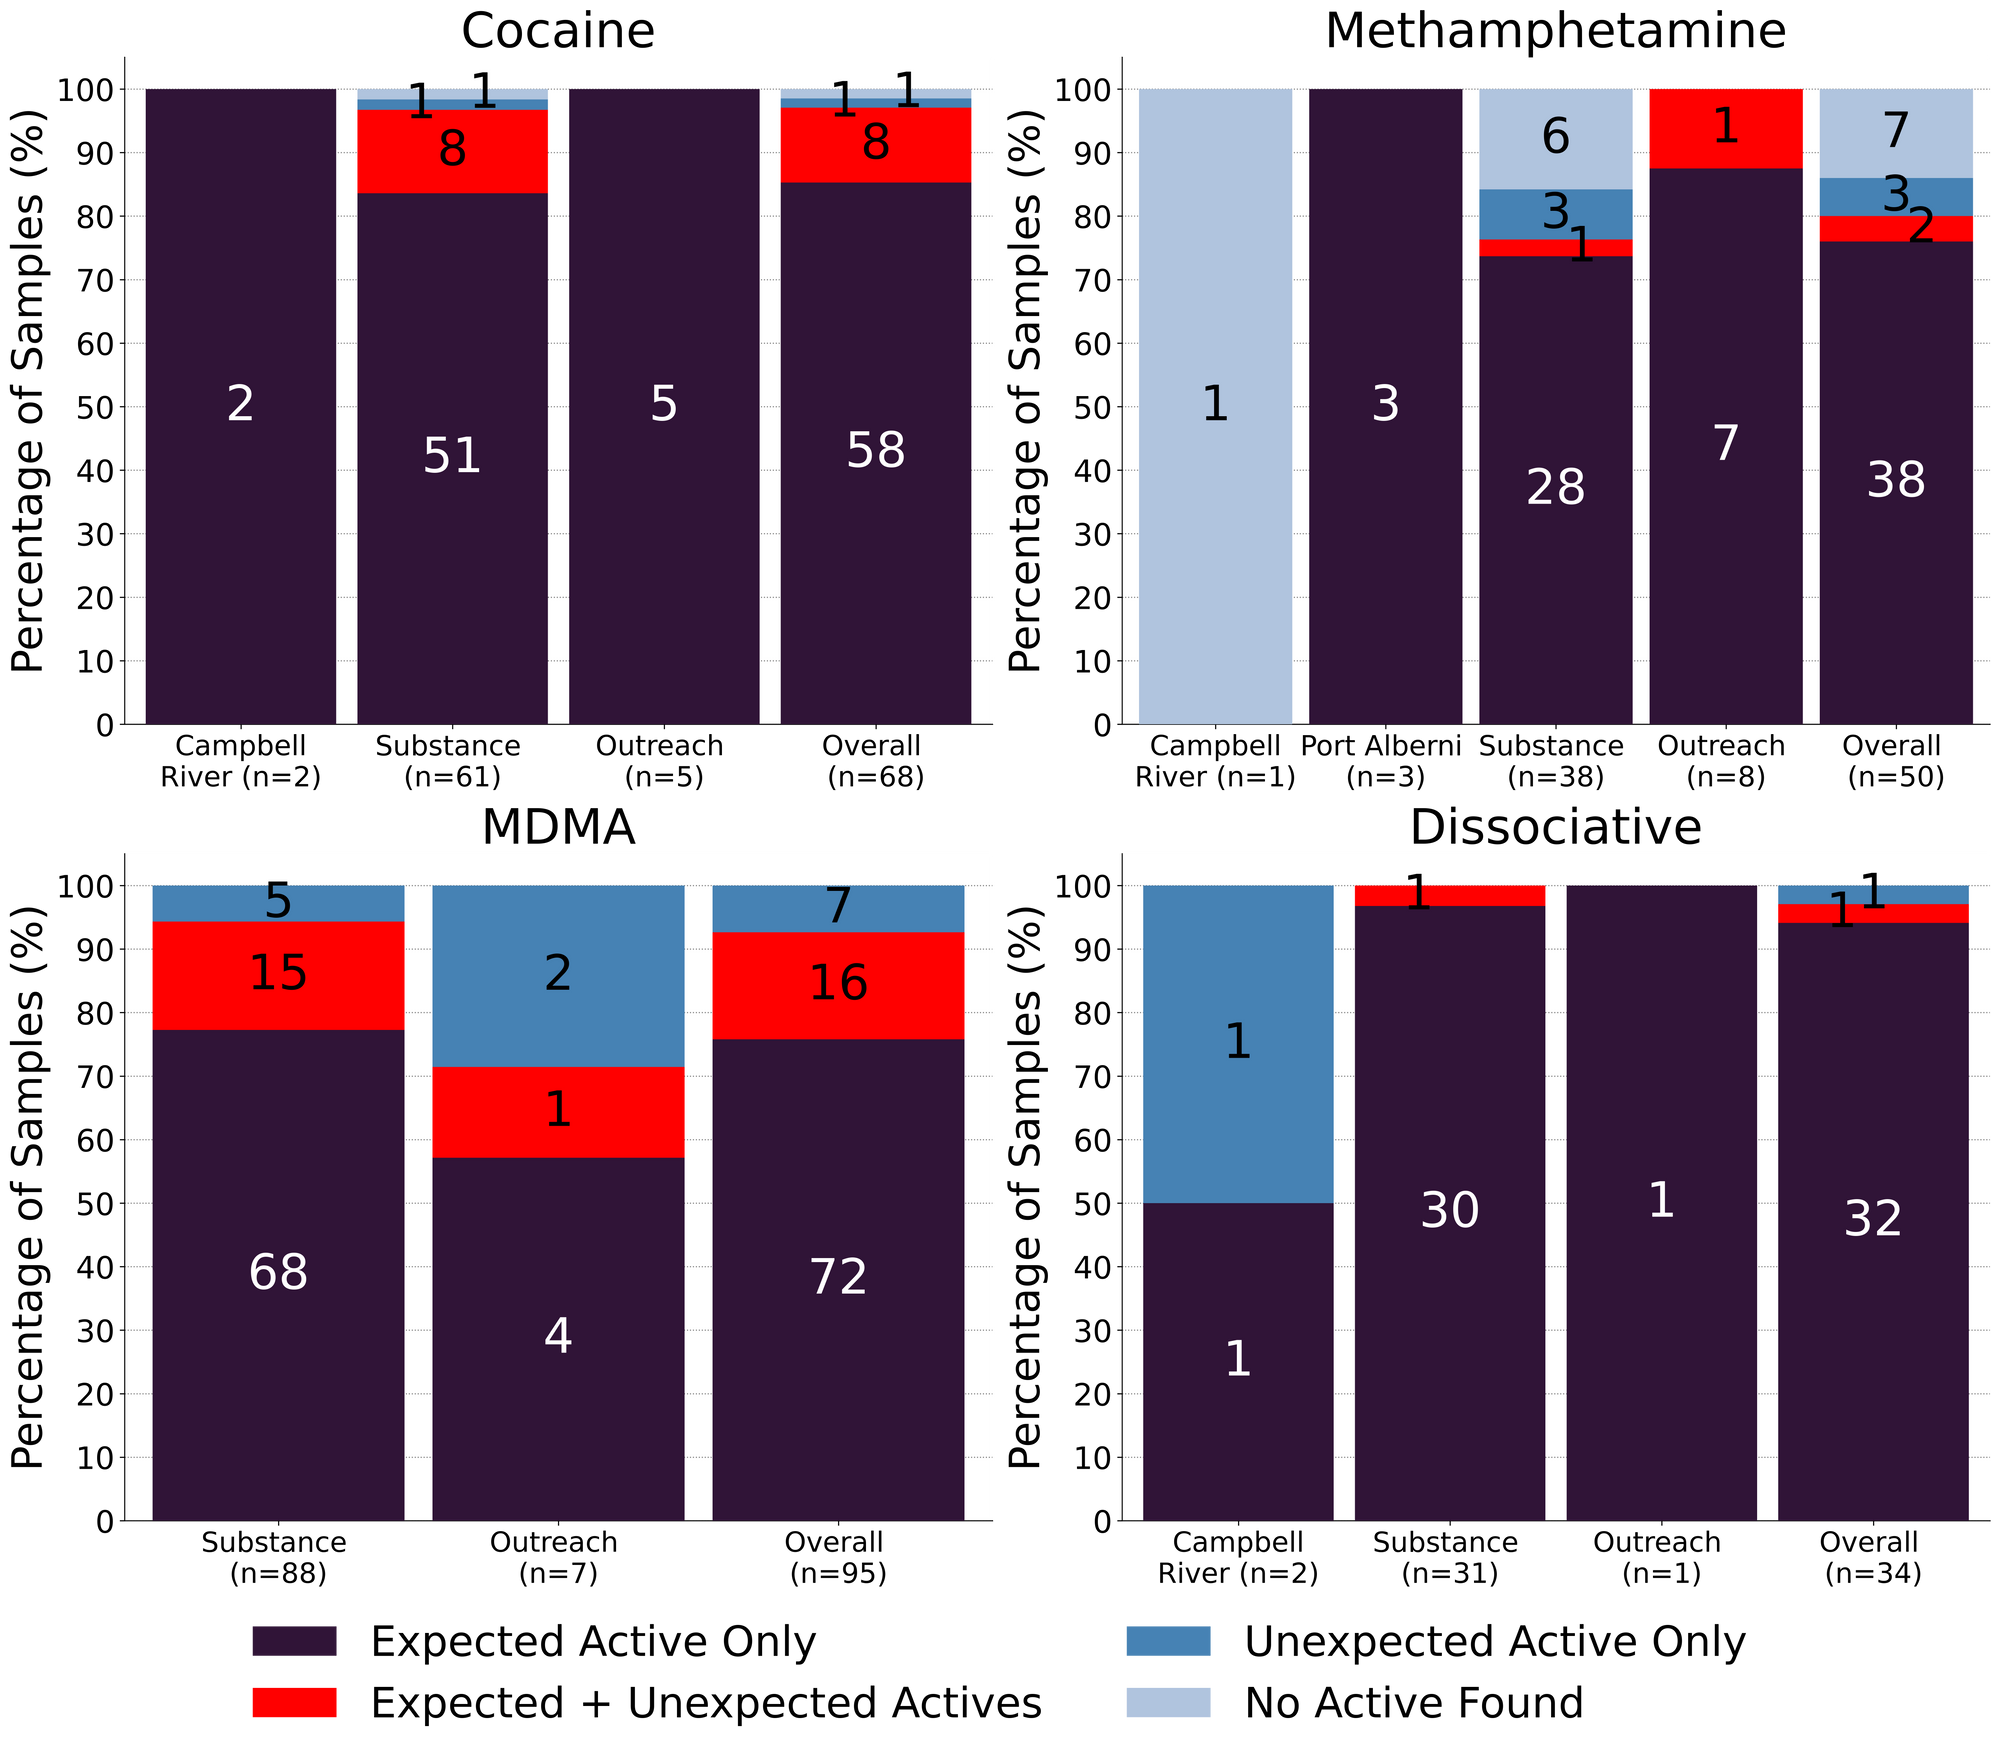
Meth is still mostly meth though our mantra may be losing momentum: 76% (38/50) of expected methamphetamine samples checked in July, across all collection locations/methods, were found to be meth with no other active compounds detected. Within these samples, only one was cut with MSM (dimethyl sulfone, an inactive compound and a common cutting agent found in meth). 2 samples were found to contain methamphetamine in addition to another active compound:
- 1 sample contained meth and trace amounts of fentanyl (<0.1%, only detected via strip test but not via mass spectrometry)
- 1 sample contained meth and 0.7% etizolam, an uncommon find in side samples
The remaining 10 expected methamphetamine samples did not contain any meth: two samples were baggie residue too sparse for us to run any tests beyond strip tests (both were positive for fentanyl), one sample was a misrepresented cocaine sample, another sample was just sugar, one sample was sodium bicarbonate, and the remaining 5 samples were baggie residue that we could only run strip tests on (all were negative for fentanyl).
Snow storms in July: 68 expected cocaine samples were checked in July. 85% (58/68) were confirmed to be cocaine with no detectable active adulterants or cutting agents. 8 samples contained an active component in addition to cocaine:
- Levamisole - 5 samples; an antihelminthic drug used to treat parasitic worm infections, commonly seen as a cut in cocaine
- Phenacetin - 2 samples; “super buff” a tylenol-like drug, commonly seen as a cut in cocaine
- Benzocaine - 1 sample; a topical local anaesthetic
1 expected cocaine samples were found to contain no cocaine and instead appeared to be a misidentified down sample containing fentanyl, fluorofentanyl, bromazolam, xylazine, and cocaine. Baggie mix ups happen and we are always happy to provide clarity! The remaining expected cocaine sample was a baggy with trace amounts of residue too sparse for us to run any of our tests beyond the fentanyl strip test (which was negative).
76% (72/95) of expected MDA/MDMA samples checked were confirmed to be the expected MDA/MDMA, with the MDMA-to-MDA mixup representing a majority of the remaining samples:
- 4 expected MDMA samples were found to just be MDA
- 1 expected MDA samples were found to be MDMA instead
- 12 samples were found to contain both MDMA and MDA
- One of which also contained methamphetamine
- 1 sample contained both MDMA (~60%) and ketamine (~40%)
- 1 sample was found to contain MDMA and 1.5% levamisole (a cut more commonly found in cocaine)
- 1 sample contained no MDMA and was instead found to be diphenhydramine (Benadryl)
- 1 sample did not contain MDMA and instead was found to be a misrepresented down sample containing fentanyl, flubromazepam, and caffeine.
94% (32/34) expected ketamine samples checked were found to be ketamine with no other active compounds detected, however 1 sample was cut with MSM and another was cut with inositol (a sugar). One sample was found to contain both ketamine and methamphetamine and the remaining sample did not contain any ketamine and was found to be methamphetamine instead.
Benzodiazepines (n=14)
93% (13/14) of the benzodiazepine samples checked in July came to our service in the form of pressed pills that were expected to be alprazolam (Xanax). Only one of the pressed pills was confirmed to contain alprazolam. The 12 other pressed pills were found to contain a benzo or benzo-related drug other than alprazolam:
- Etizolam - 7 samples. Etizolam is ~2x weaker than alprazolam, though the concentration of each pill may be quite variable
- One sample additionally contained the benzo adinazolam. Adinazolam is ~10x weaker than alprazolam and has a shorter duration of effect
- Flualprazolam - 3 samples. Flualprazolam is ~2x stronger than alprazolam in terms of dosage but has a similar duration of effect (5-8 hours)
- Undifferentiated benzodiazepine - 2 samples. We could not confirm the identity of the benzo present in this sample, though the benzo strip was positive
One sample came to us in the form of a mustard yellow chunk and was found to contain etizolam and creatine with trace amounts of adinazolam and fentanyl detected as well. Adinazolam is ~10x weaker than alprazolam and has a shorter duration of effect.
Opioid-Down (n=208)
In this section we present results specific to the opioid-down supply, therefore they may differ from the highlighted findings above that are inclusive of all expected drug categories.
- 95% of expected opioid-down samples contained fentanyl (197/208)
- 5 (2%) samples contained heroin:
- Two samples were just heroin (and related alkaloids like acetylmorphine (MAM) and acetylcodeine)
- Three samples additionally contained fentanyl ranging from trace amounts (0.1%) to 10% to 20%
- Five samples contained carfentanil, with a median concentration of 0.22% and a range of 0.10% to 0.41%
- 46% of expected opioid-down samples contained a benzo and/or etizolam (95/208)
- Xylazine was detected in 15% (31/208) of opioid-down samples, with a median concentration of 1.1% and a range of 0.1% to 15.8%
This July, 65% of all opioid-down samples checked contained an additional active to the expected fentanyl. Examining Fig 3. we can see that the down supply has remained consistently inconsistent:
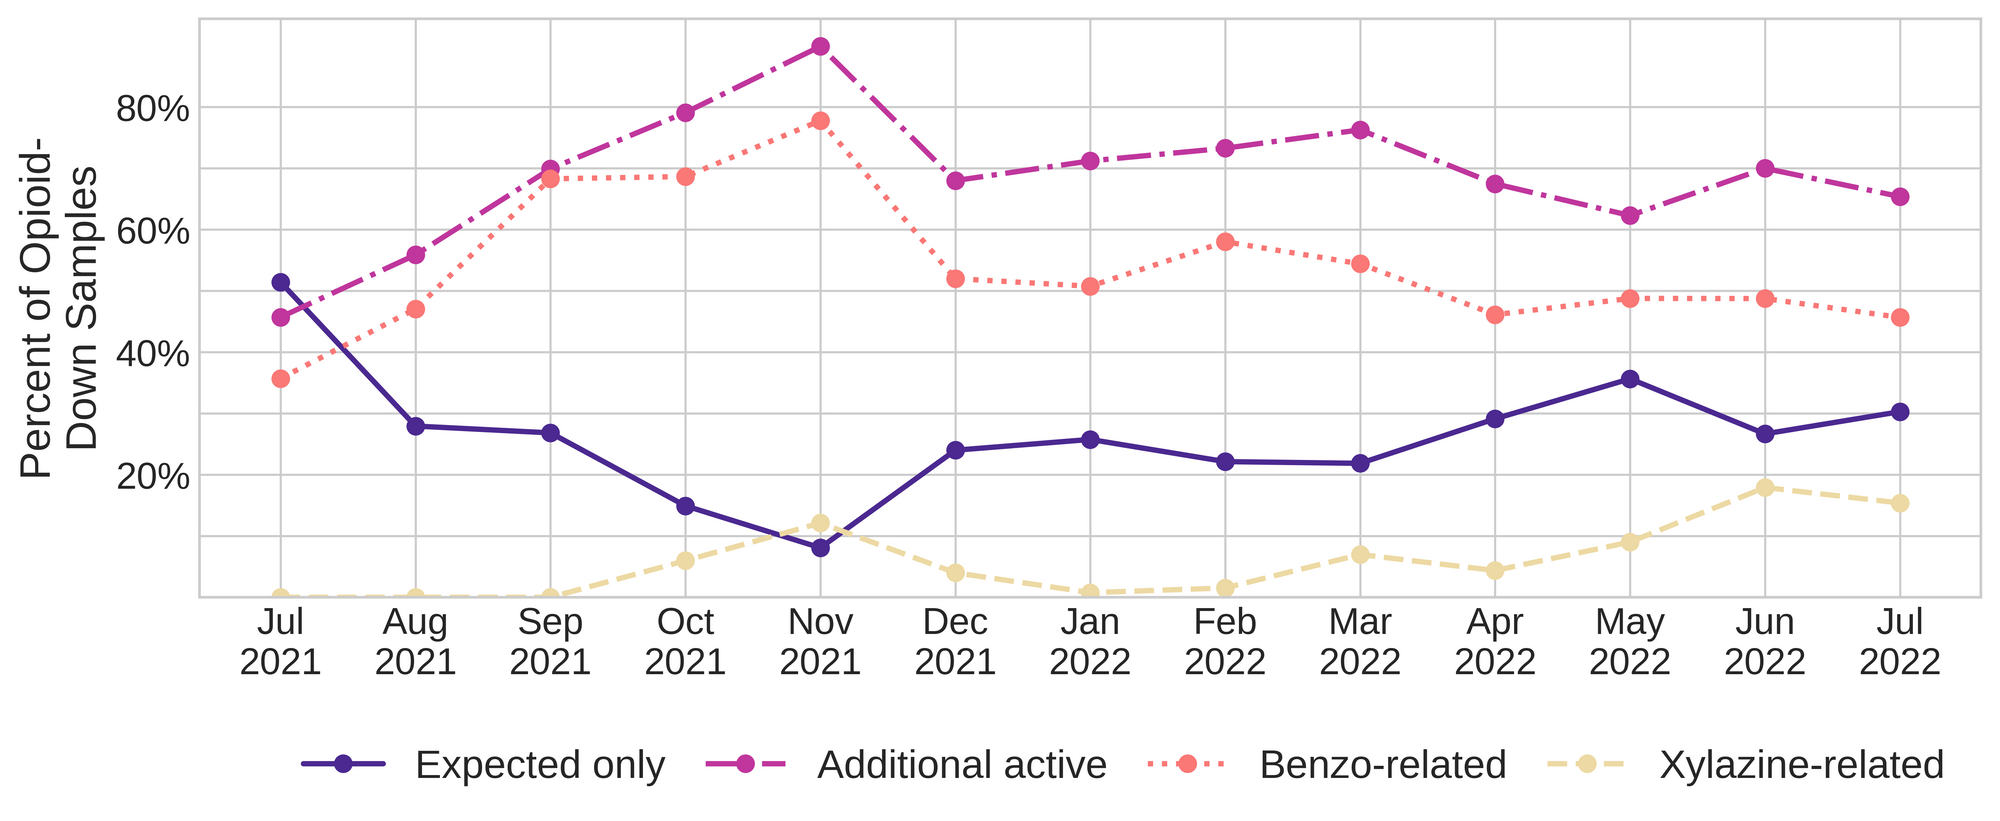
Benzo-related drugs remain the primary contributor to the additional actives found in expected opioid-down samples with 46% (95/208) of expected opioid-down samples checked containing a benzo-related drug.
Notably, bromazolam has overtaken flubromazepam and etizolam as the most common benzo seen in the down supply. Bromazolam is a novel non-medical benzodiazepine with comparable strength and duration to alprazolam/Xanax, though it has limited study of use in humans. The percentage of down samples containing bromazolam has been increasing this year: 14% of opioid-down samples contained bromazolam in July (30/208), whereas only 6% of down samples contained bromazolam in June (15/240), and 8% in May (19/244). Prior to May, we were unable to quantify/detect bromazolam on our mass spectrometer so our data is limited. Interestingly, we detect very little bromazolam in the benzodiazepine supply (bromazolam was found in one expected benzo powder sample in June) and we have not detected bromazolam in any pressed pills/counterfeit Xanax bars since when we began screening for bromazolam in May.
Unexpected fentanyl analogues like fluorofentanyl (37 samples), and the sedative xylazine (31 samples) represent a majority of the remaining adulterants, though scattered detections of other drugs are occur regularly and can be reviewed in the pdf report at the end of this blog.
Humans have been using drugs for many millennia and will continue to do so for many more; it’s irrational and harmful to think that policy focused on exclusively abstinence and/or punishment is going to positively affect community health or our collective relationship with drugs.
Instead, if we are aiming to maximise human wellness and resolve the ongoing drug poisoning crisis, we need to acknowledge that substances are going to continue to be used, support people who who drugs and their autonomy, eradicate the stigma around drug use, and we should be working to minimise the harms that are caused when people don’t know what substances (or how much of them) are present in their daily dose.
Drug checking is one option that can provide some clarity on this last point, but it is an incomplete solution as drug checking does not address the fact that many people who use drugs are still subject to an unregulated and unpredictable market.
Rather than staring aimlessly, looking for solutions in their morning cup of coffee full of beans regulated by food quality specifications, pondering potential solutions as they swirl wine glasses full of alcohol with a known ABV, or reflecting on the problem as they stare at themselves in their mirrored medicine cabinets full of pharmaceuticals with accurate Health Canada approved labels, policy makers could listen to people who use drugs who have been pointing to real remedies for decades: accessible safer supply and decriminalisation of all drugs.
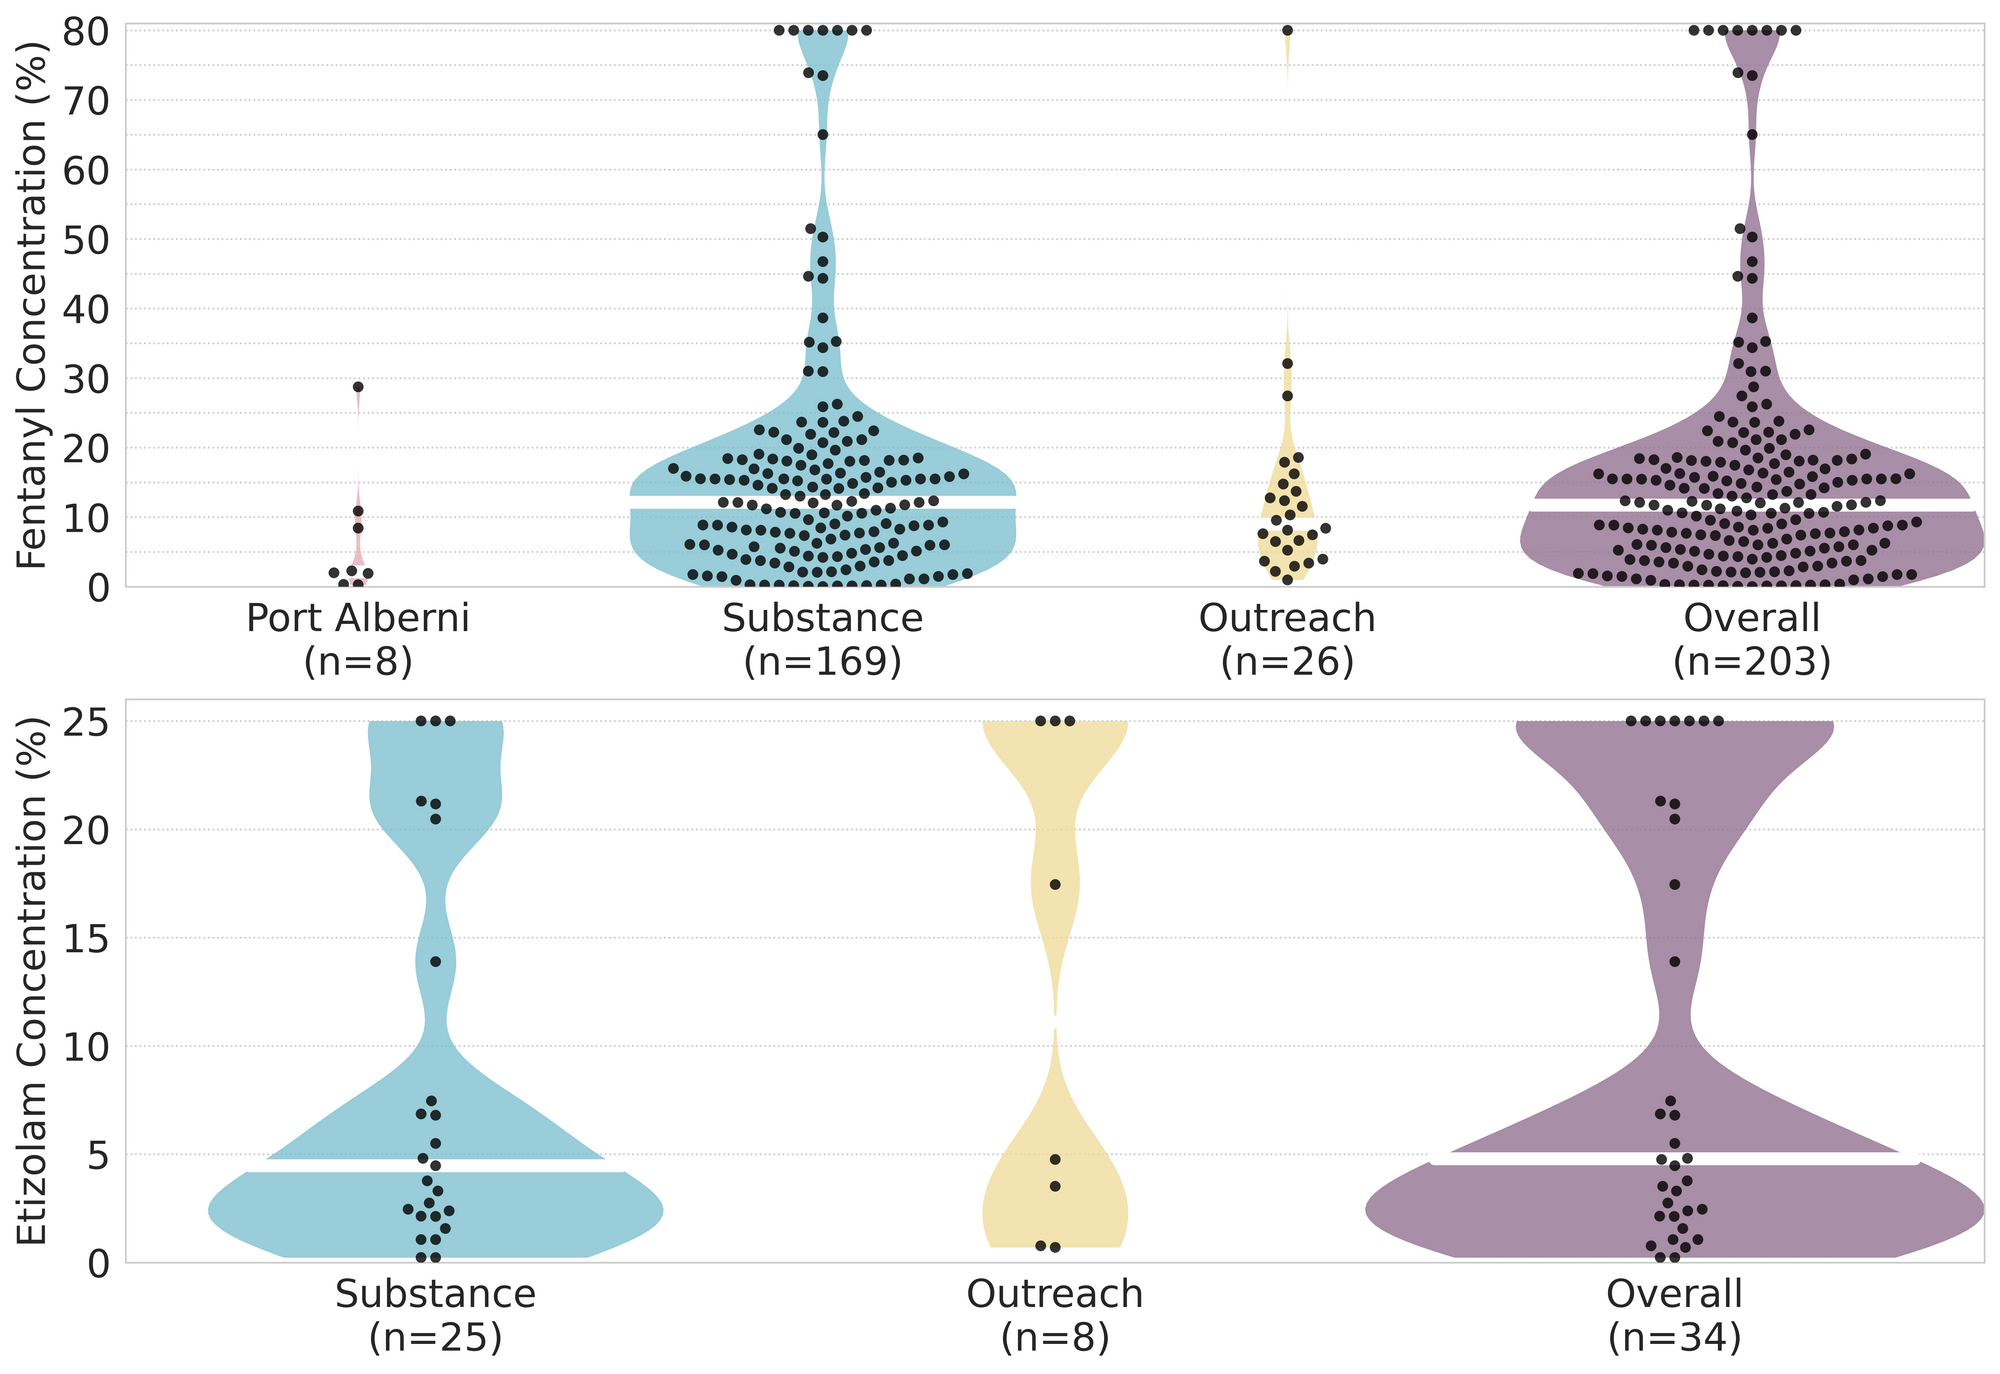
Quantification for Expected Opioid-Down[1]
In July, we quantified fentanyl for 171 of the expected opioid-down samples containing fentanyl and found the median concentration to be 12.3%[2] with the average strength of fentanyl we normally see being around 15%. Though the median is a useful indicator, it doesn’t capture the volatility of fentanyl concentrations present in the opioid supply, as any one sample might be the lowest strength (0.1%) or the strongest (>80%[3]). Similarly, the concentration of etizolam, our ongoing benzo-representative, was across the board in expected opioid down samples, ranging from 0.2% to >25%[3:1], with a median of 4.8%.
Not all opioid down samples brought to our service can be quantified. This is primarily due to too limited sample collected for our instruments to report a reliable mass percentage. Nevertheless, qualitative detection is still possible. ↩︎
This number is specific to fentanyl quantified in opioid-down samples. The median concentration listed in the Key Findings at the beginning of this blog (11.9%) is inclusive of all samples checked, across all drug classes, that contained fentanyl. ↩︎
For samples that contain more than 80% fenanyl, or more than 25% etizolam by weight, our mass spectrometer is presently unable to reproducibly assign a concentration due to the upper limits of the calibration methods currently adopted. ↩︎ ↩︎

The fentanyl and etizolam concentrations that we quantified in down samples checked in July are presented in Fig. 4. Black dots are individual opioid-down samples, Horizontal white bars show the median concentrations of fentanyl and etizolam quantified, the width of the shaded regions mirrors the number of samples at a given concentration.
Want to be notified when we release these reports? Join our mailing list to receive updates about when our reports are out. You can subscribe and unsubscribe yourself from this list at any time.
Check back next month for the August report!
As always, send us feedback at substance@uvic.ca for how we can continue to offer our drug checking results in a useful way.