May 2022 Monthly Report

In this blog post we discuss our May 2022 report and provide more information on how to interpret the results. The PDF report can be found at the end.
Key findings:
- Carfentanil was found in six expected opioid-down samples, with a maximum concentration of 0.58%
- 97% of expected opioid-down samples contained fentanyl
- The median fentanyl concentration found across all samples was 11.8%, with a maximum of over 80%
- Benzodiazepines and/or etizolam were found in 48.8% of expected opioid-down samples
- The maximum concentration of etizolam found was >25%, in an expected opioid-down sample
- We can now quantify additional benzodiazepines including adinazolam, bromazolam, flubromazepam, and meclonazepam
Insight for the May 2022 Monthly Report
As the saying goes, periods of sporadic precipitation in April may indeed prompt some angiosperms to produce reproductive organs in May, but considering it rains here on the island in more than just April, and that many flowering plants have already bloomed before May rolls around, the resident poets at the Vancouver Island Drug Checking Project have adapted the proverb to be more relevant to our own experiences in May:
April’s and every month prior samples where the benzodiazepine strip test was positive but we could not identify which benzo was present with previous methods bring May’s quantification of flubromazepam and a handful of other benzos, thanks to an updated target list on the paper-spray mass spectrometer
A timeless classic if you ask us. Abhorrent aphorisms aside, the adage is authentic: in May we added four new benzodiazepines to our targeted method on the PS-MS. They are listed below in the table, with alprazolam (Xanax) and diazepam (Valium) included for reference:

As part of the targeted method, we now screen every sample run on the PS-MS for these compounds, with quantification possible down to ~0.1%. The ability to rapidly add new compounds into a quantitative method, based on changes seen within the drug supply, is a testament to the versatility of the PS-MS and a tremendous thank you is extended to Armin Satchi at Vancouver Island University for his exquisite work in this adaptation.
May also celebrated the transition of Port Alberni Shelter Society’s Overdose Prevention Site (PASS’s OPS) from an occasional pop-up drug checking site to a permanent fixture within the Vancouver Island Drug Checking Project, as part of our distributed drug checking model. The Port Alberni OPS drug checking site continues to sustain efforts to scale up drug checking services to meet the needs of diverse communities across Vancouver Island. The introduction of drug checking services in Port Alberni will mean greater access to harm reduction interventions that not only support individuals in mitigating risks within the unregulated drug market, but also support the community in making sense of regional drug supply trends. We are encouraged by our ongoing collaboration with PASS and are continuing to seek partnerships across the Island to expand and provide critical harm reduction services. As a final note, we couldn’t possibly write this blog post without acknowledging the incredible work of Lexi, Robyn, Wes and others from the PASS who have tirelessly worked to secure and implement drug checking services in Port Alberni.
As before, this blog, and the associated pdf report, breakdown our sample counts into three categories:
-
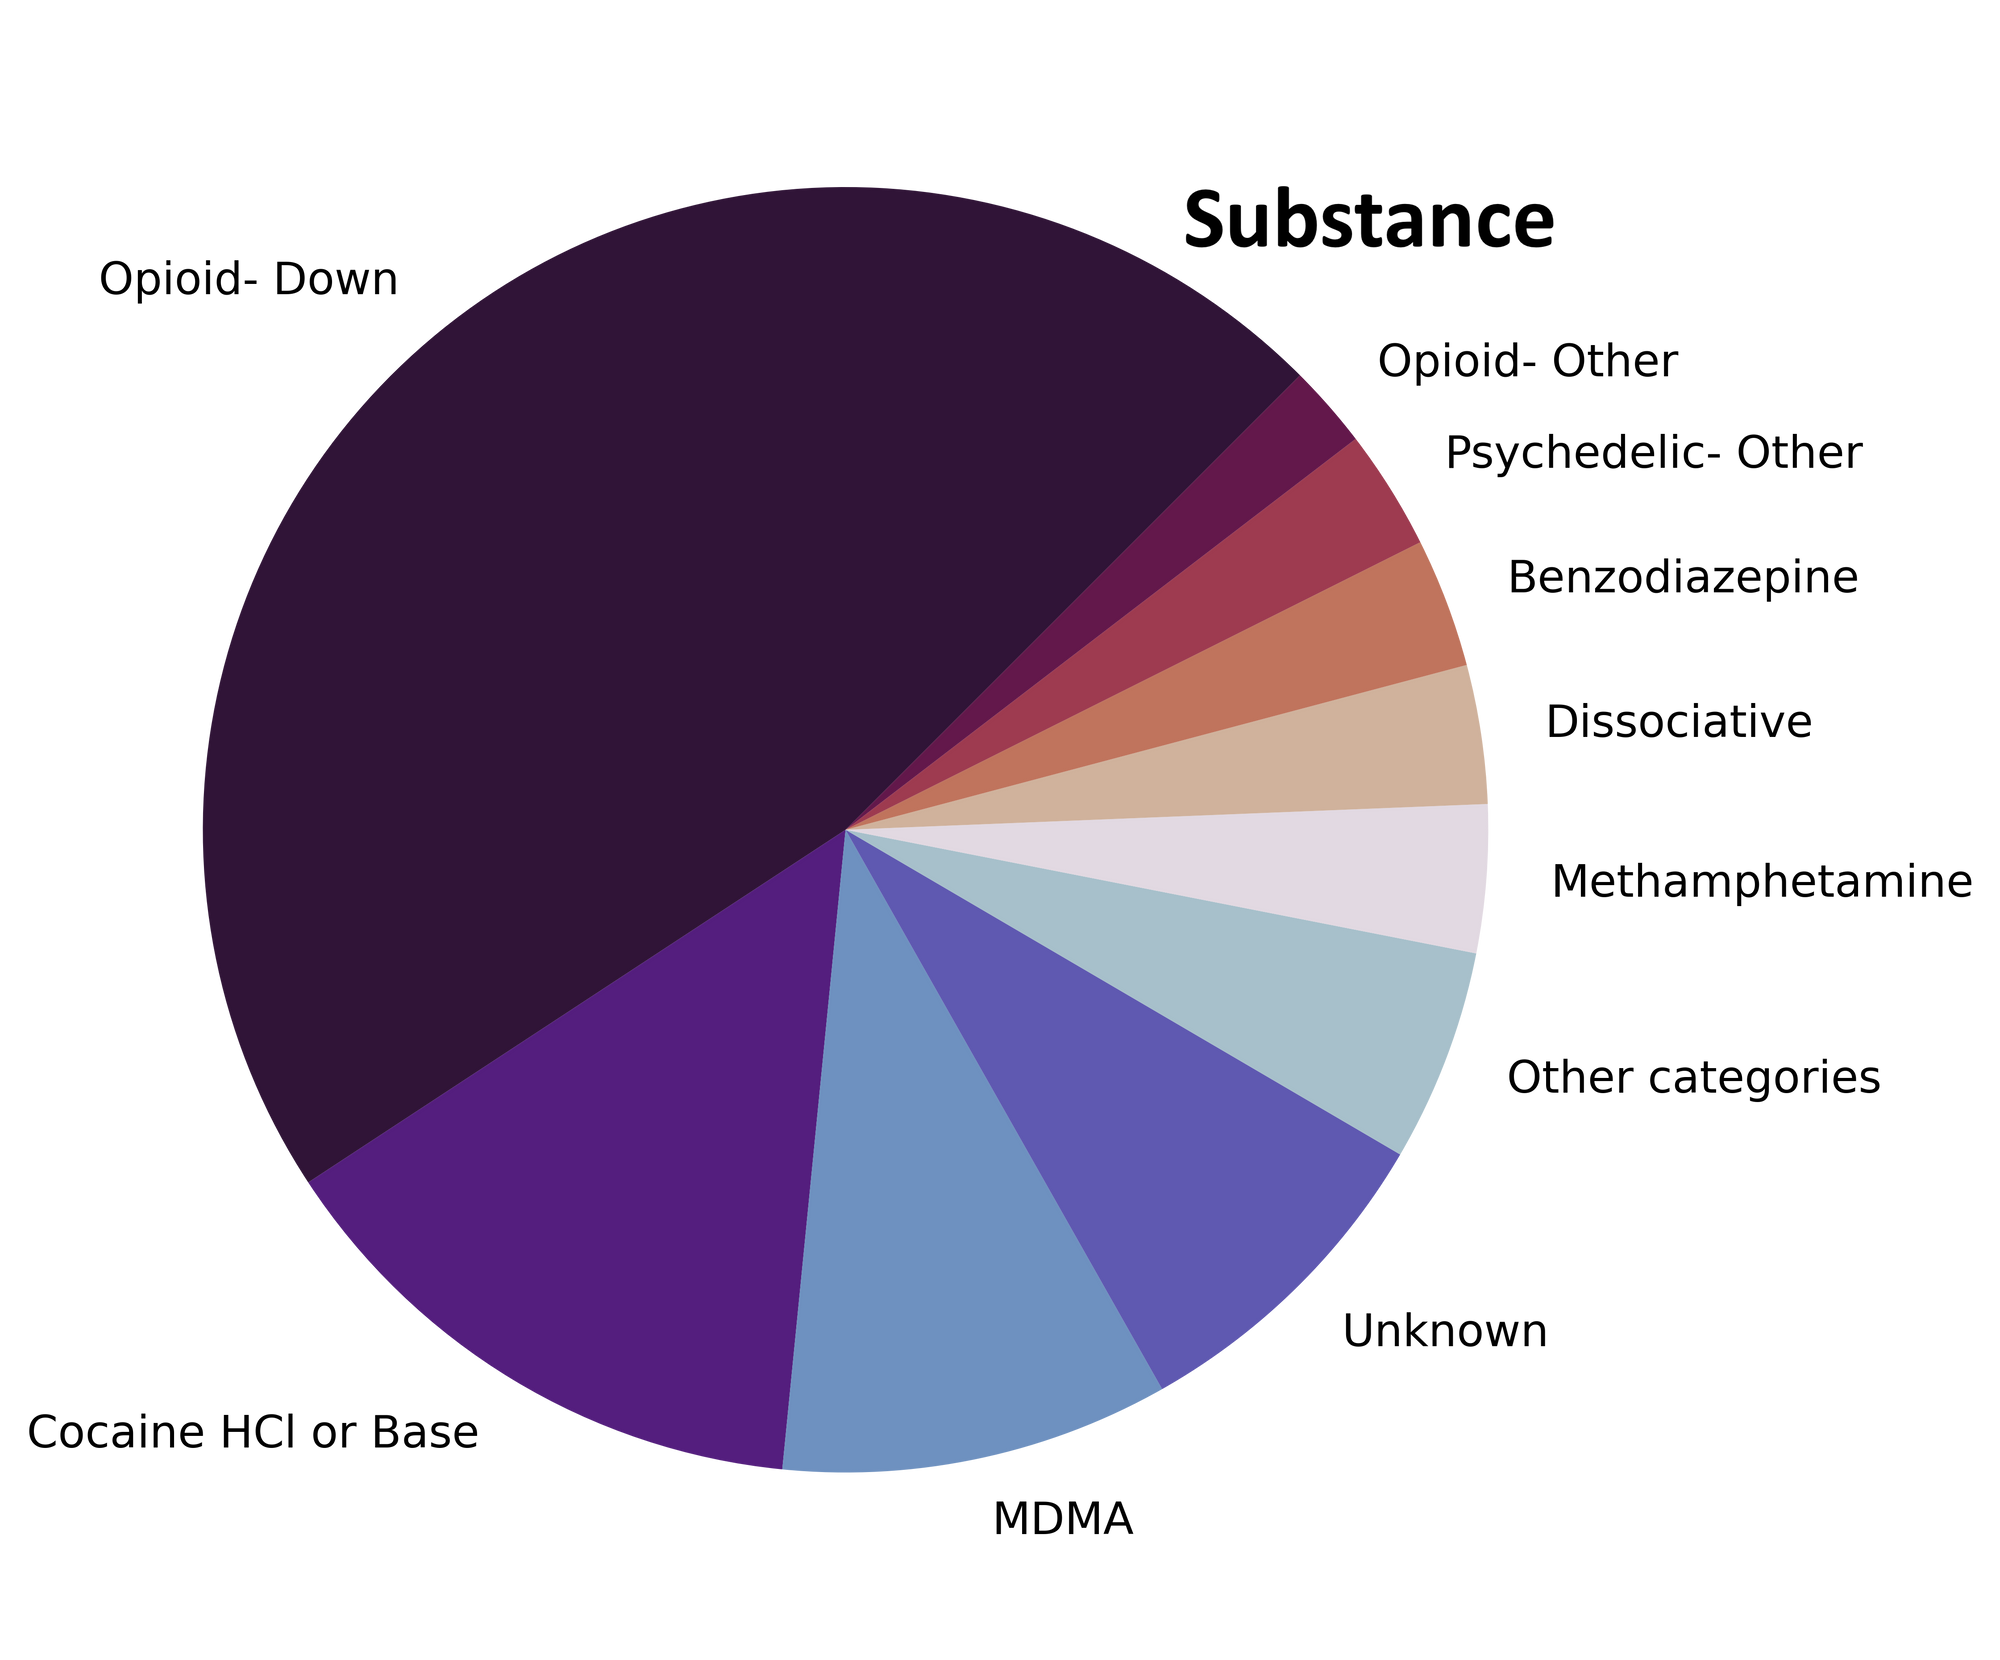
samples received through direct service provision in Victoria, where service users are bringing samples into the Substance storefront. These samples are labelled as “Substance” samples in the figures/tables of this blog post
-
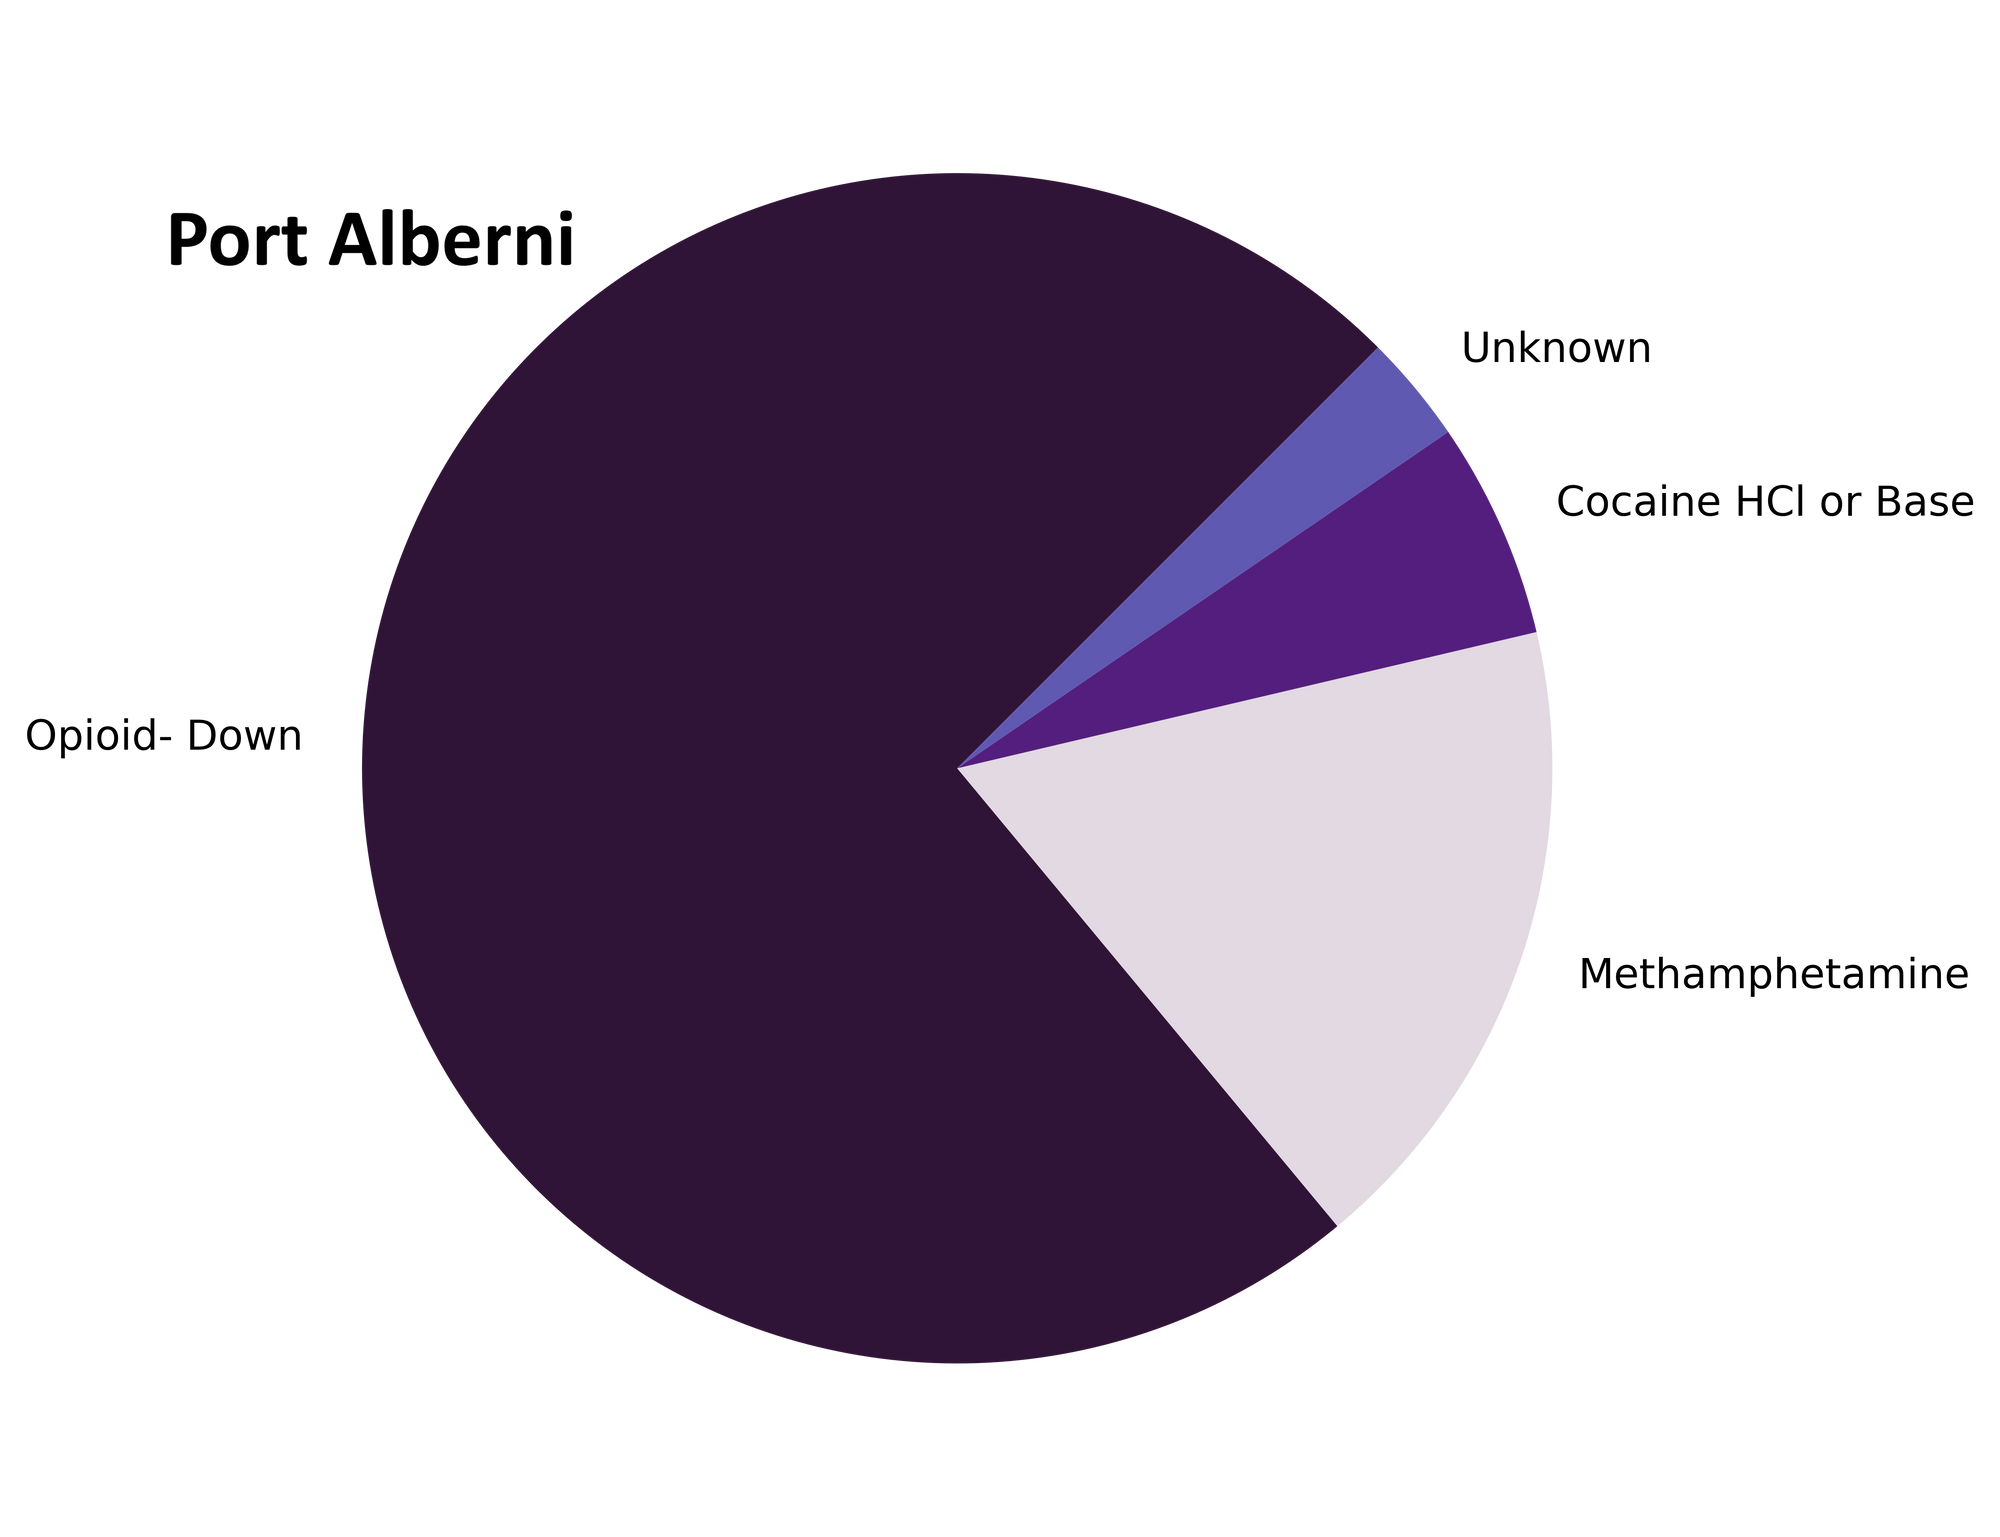
samples received through direct service provision in Port Alberni, where service users are bringing samples into PASS’s OPS. These samples are labelled as “Port Alberni” samples in the figures/tables of this blog post.
-
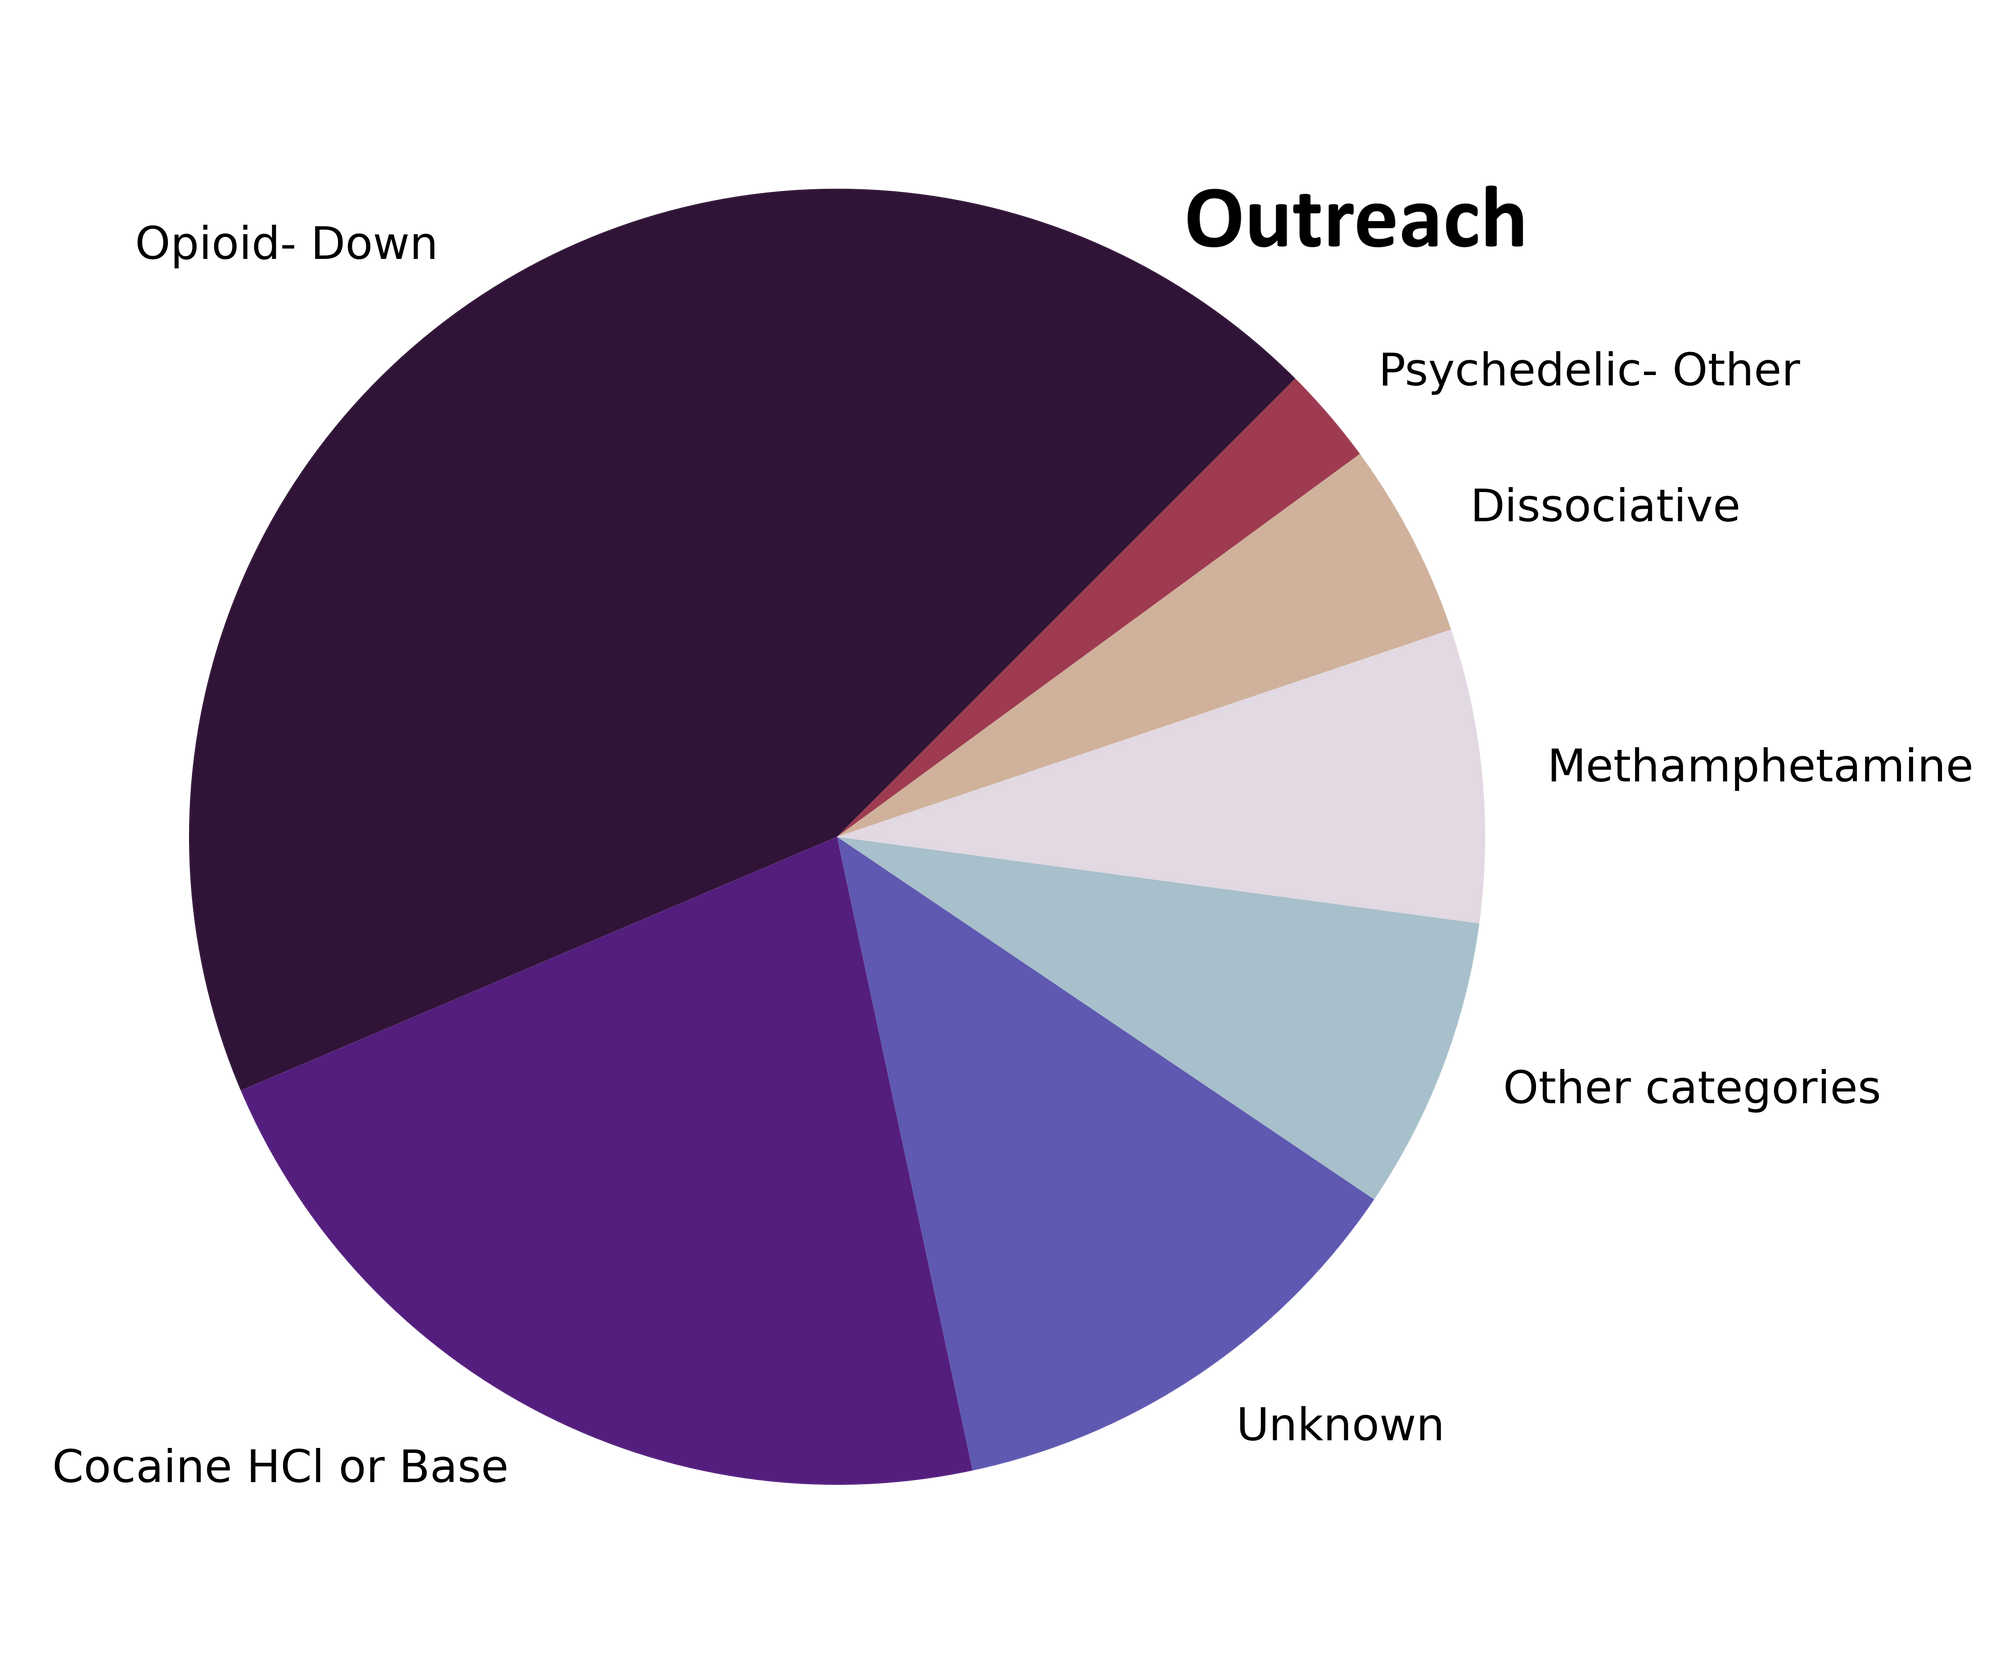
samples received through indirect service provision, where samples are being collected through no contact drop-off envelopes, mail-in envelopes, or are being collected by harm reduction workers and/or other community members at supported housing sites, at overdose prevention sites, and supervised consumption locations. These samples are labelled as “Outreach” samples in the figures/tables herein.
Drug types
Methamphetamine, MDA, 3-MMC, and many more motley members of the drug multiverse mobilised, amassed, and mustered on our machines in May. Fig. 1 shows the prevalence of each expected drug category checked, split by sample collection location/method.

The monthly monocomponent and mixture makeup monologue
For a majority of samples checked, we confirm that the expected drug was indeed the only active and that no additional active compounds were present. The bar charts below highlight a few classes of drugs, differentiating samples when only the expected active was found from situations when other unexpected components were detected.
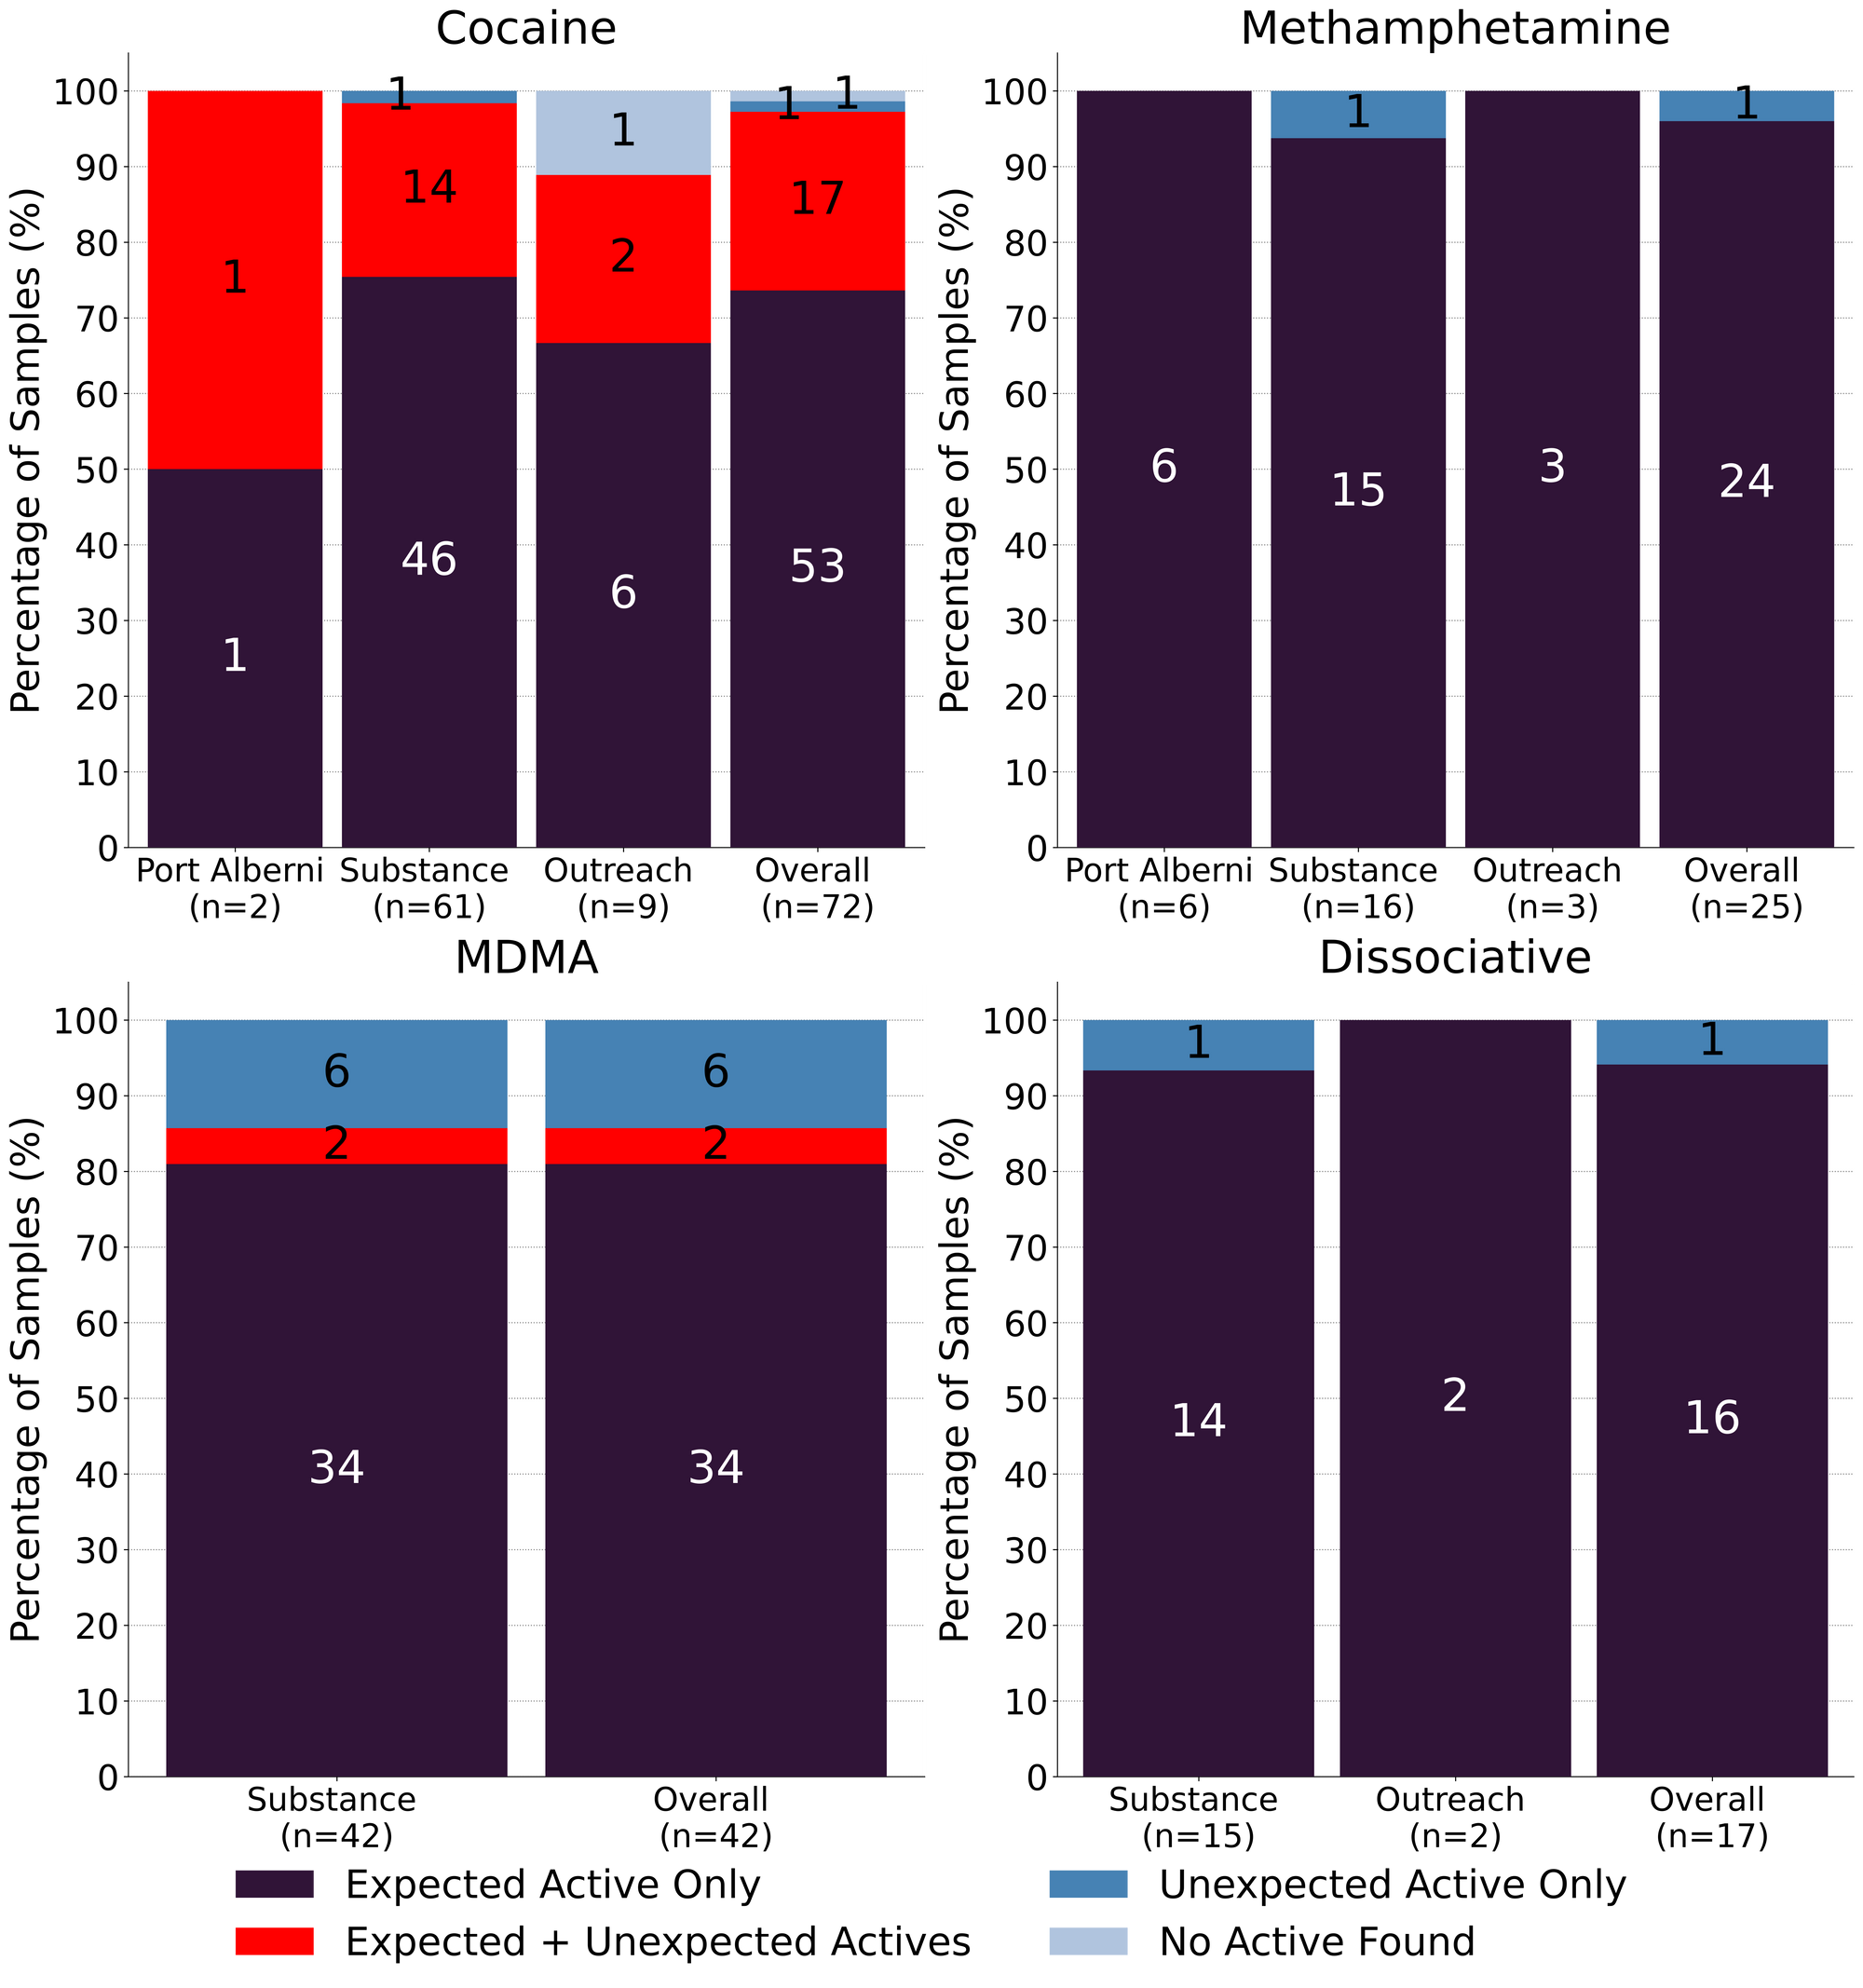
May marks a return to our mantra “meth is meth”. 96% (24/25) of expected methamphetamine samples checked in May were found to be meth as a single component, no cuts or adulterants detected. The remaining sample was found to be ketamine, rather than meth - an easy mixup considering the visual similarities between crystalline shards of mysterious origin.
81% (34/42) of expected MDA/MDMA samples checked were confirmed to just be MDA/MDMA. Within the remaining 8 samples:
- 2 samples were found to contain both MDMA and MDA
- 4 expected MDMA samples were found to just be MDA
- 1 expected MDA sample was found to be MDMA instead
- 1 expected MDMA sample was found to be ketamine instead
Like last month, K is K…except in May when it may be MDMA. 16 expected ketamine samples were checked and 15 were found to simply be ketamine. The remaining sample was identified as MDMA with no ketamine detected. The lone 3-HO-PCP sample checked was confirmed to be 3-HO-PCP.
72 expected cocaine samples were checked in May, between all collection locations/methods. 74% (53/72) were confirmed to be cocaine with no detectable cuts or adulterants. 17 samples contained an active component in addition to cocaine:
- Levamisole - 7 samples; an antihelminthic drug used to treat parasitic worm infections, commonly seen as a cut in cocaine
- Phenacetin - 6 samples; “super buff” a tylenol-like drug, commonly seen as a cut in cocaine
- Fentanyl - 2 samples. One sample was residue from a pipe that contained trace fentanyl (0.2%) attributed to reuse of the pipe for different substances, while the other sample was found to be 80/20 fentanyl base/cocaine base - a polysubstance mixture that we have not seen before
- Benzocaine - 1 sample; a topical local anaesthetic
- MDMA - 1 sample
1 expected cocaine sample was found to contain no cocaine and instead was found to be MDA and the remaining 1 expected cocaine sample checked did not contain cocaine or any other active compounds
We get a lot of questions regarding the “purity” of cocaine and what we mean when we say a sample was “found to be cocaine with no cuts or adulterants detected.” “No cuts detected” certainly does not mean “pure”, should not be interpreted as such, nor do we broadcast purity testing as a capability of ours (in fact, “If it’s ‘pure’” is the very first thing we tell service users about things we cannot do (see “More about our services” here)
Purity, in a chemical sense, could be defined (rather unsatisfactory) as the lack of impurities in a sample. Impurities could exist from the synthesis process where there are unintentional byproducts, leftover alkaloids, and residual precursors and solvents, could arise as breakdown products from storage and handling conditions, and could be intentionally added cutting agents or adulterants.
Considering many possible sources of impurities, there is a massive list of compounds that could be present in a cocaine sample (acetone, anhydroecgonine methyl ester, benzene, benzocaine, benzoylecgonine, cinnamoylcocaines, diethyl acetate, diethyl ether, ecgonine methyl ester, ethylcocaine, isopropyl alcohol, levamisole, norcocaine, pentane, phenacetin, toluene, and tropacocaine, to name a few), but many of these compounds may be present in such trace levels that we are unable to detect them on our instruments. It is especially complicated for cocaine where some leftover alkaloids will have spectral similarities nearly indistinguishable from cocaine on FTIR/Raman.
Even with PS-MS, where detection could be possible, the list of possible impurities to screen for is massive and the process to identify and quantify them would require extensive method development (and time) that is outside of the objectives/capabilities of our point-of-care service. Currently, the PS-MS scans every sample for the most common pharmacologically active cuts seen in cocaine: benzocaine, levamisole, lidocaine, phenacetin, and procaine, with quantification possible down to ~0.1% by weight. Similarly, FTIR/Raman are capable of detecting thousands of other compounds if they are present above ~5% by weight. If you are suspicious of specific impurities when you drop off a sample, be sure to let us know, and rest assured that if we detect anything out of the ordinary, we will certainly let you know.
Benzodiazepines (n=14)
All benzodiazepine samples checked in May came to our service in the form of pressed pills, a majority of which were expected to be alprazolam (Xanax). No alprazolam was detected in any of these samples. One sample contained no benzos (or any other actives) and was found to just be a sugar pill; the remaining 93% (13/14) of samples were found to contain a benzo or benzo-related drug other than alprazolam:
- Etizolam - 6 samples. Etizolam is ~2x weaker than alprazolam, though the concentration of each pill may be quite variable
- One pill additionally contained lidocaine, a non-benzo local anaesthetic
- Lorazepam (Ativan) - 6 samples. Lorazepam and alprazolam have comparable dosage and duration of effect
- Flubromazepam - 1 sample. Flubromazepam is ~5x weaker than alprazolam in terms of dosage, but the duration is much longer with effects lasting 12-18 hours, as opposed to 5-8 hours for alprazolam.
Opioid-Down (n=244)
In this section we present results specific to the opioid-down supply, therefore they may differ from the highlighted findings above that are inclusive of all expected drug categories.
- 97% of expected opioid-down samples contained fentanyl (237/244)
- Heroin was the primary active found in 3 samples, all with a concentration over 80%
- Fentanyl was additionally detected in one of these samples at a concentration of 0.2%. Bromazolam (a benzo) was also detected in this sample at 0.5%
- Six samples contained carfentanil, with a median concentration of 0.22% and a range of 0.09% to 0.58%
- 49% of expected opioid-down samples contained a benzo and/or etizolam (119/244)
- Xylazine was detected in 9% (23/244) of opioid-down samples, with a median concentration of 0.3% and a wide range of 0.1% to 25.9%
This May, 62% of all opioid-down samples checked contained an additional active to the expected fentanyl and/or heroin. Examining Fig 3. we can see that the down supply has remained consistently inconsistent:
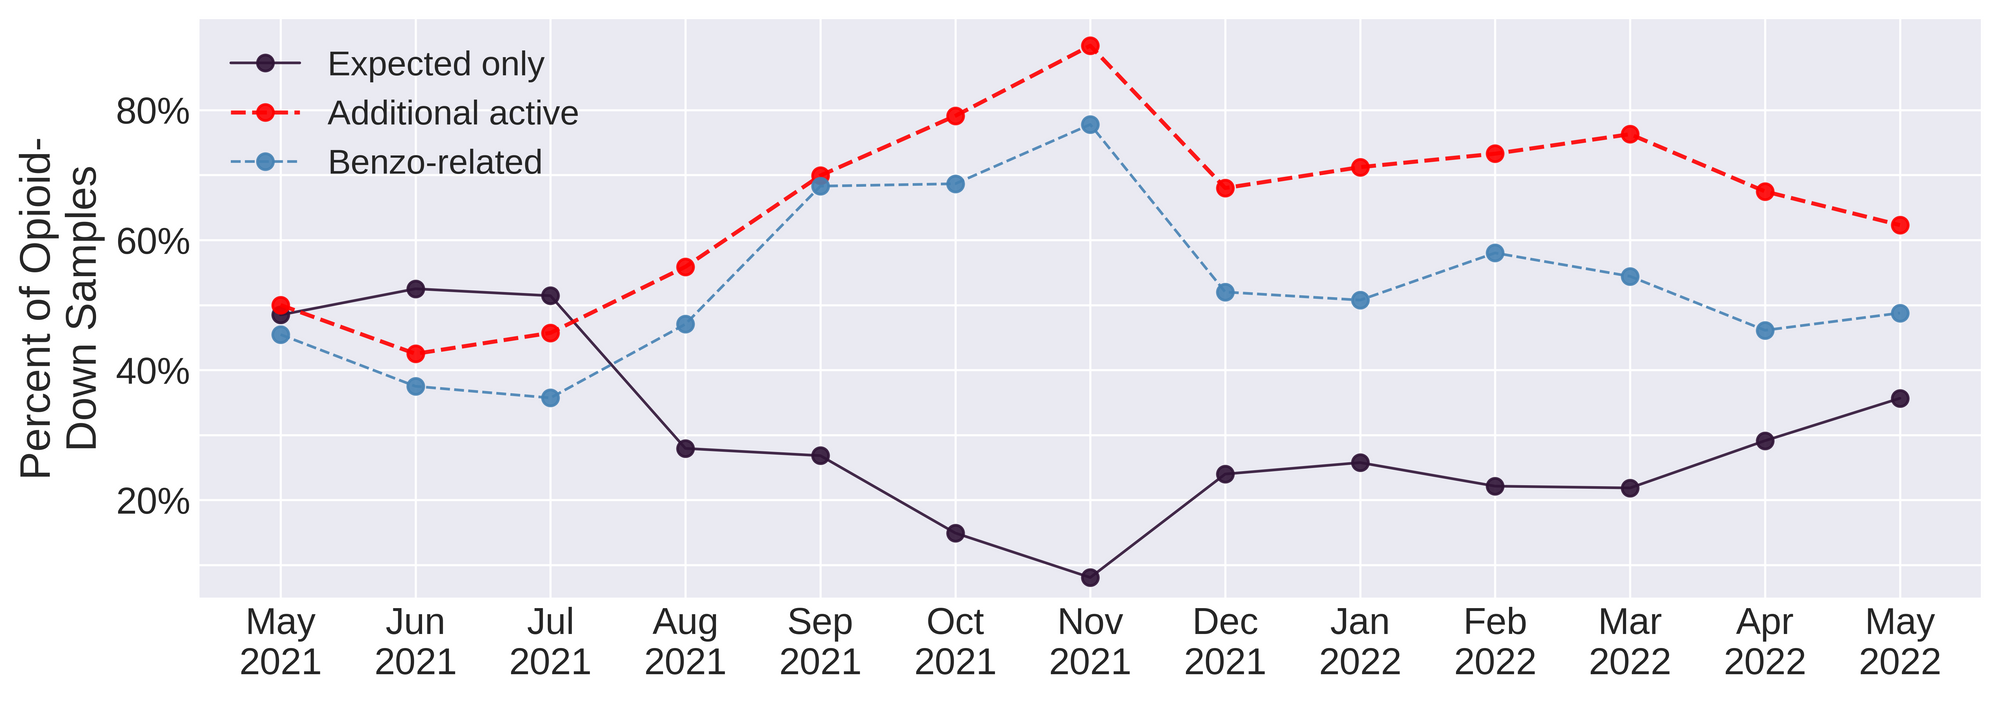
Benzo-related drugs remain the primary contributor to the additional actives found in expected opioid-down samples with 49% (119/244) of expected opioid-down samples checked containing a benzo-related drug. Unexpected fentanyl analogues like fluorofentanyl (37 samples), and the sedative xylazine (23 samples) represent a majority of the remaining adulterants, though scattered detections of other drugs are still found and can be reviewed in the pdf report at the end of this blog.
With the addition of new benzodiazepines to our targeted method for PS-MS, we were surprised to note the high prevalence of flubromazepam in opioid-down samples. Flubromazepam was detected in 24 expected down samples[1], making it the second most common benzo-related drug identified in down behind etizolam (40 samples).
This high level of adulteration with flubromazepam is very likely not new, just new to us. Rather than watching people die week after week as a result of a consistently inconsistent supply, worrying about what other unidentified and potent drugs may be circulating, and developing new methods of detection to chase this week’s hot adulterant only to have to change gears and start fresh to detect next week’s novel compounds, maybe, possibly, please-for-the-love-of-all-that-is-good-we-are-seriously-tired-of-asking, policy makers could work smart, not hard, and actually listen to the people who use drugs who have been pointing to remedies to the unregulated market for years: safer supply of all drugs and #Decrimin#DoneRight.
23 of these were confirmed to be down containing fentanyl, while 1 sample was found to just be flubromazepam and caffeine - no fentanyl/heroin detected ↩︎
Quantification for Expected Opioid-Down[1]
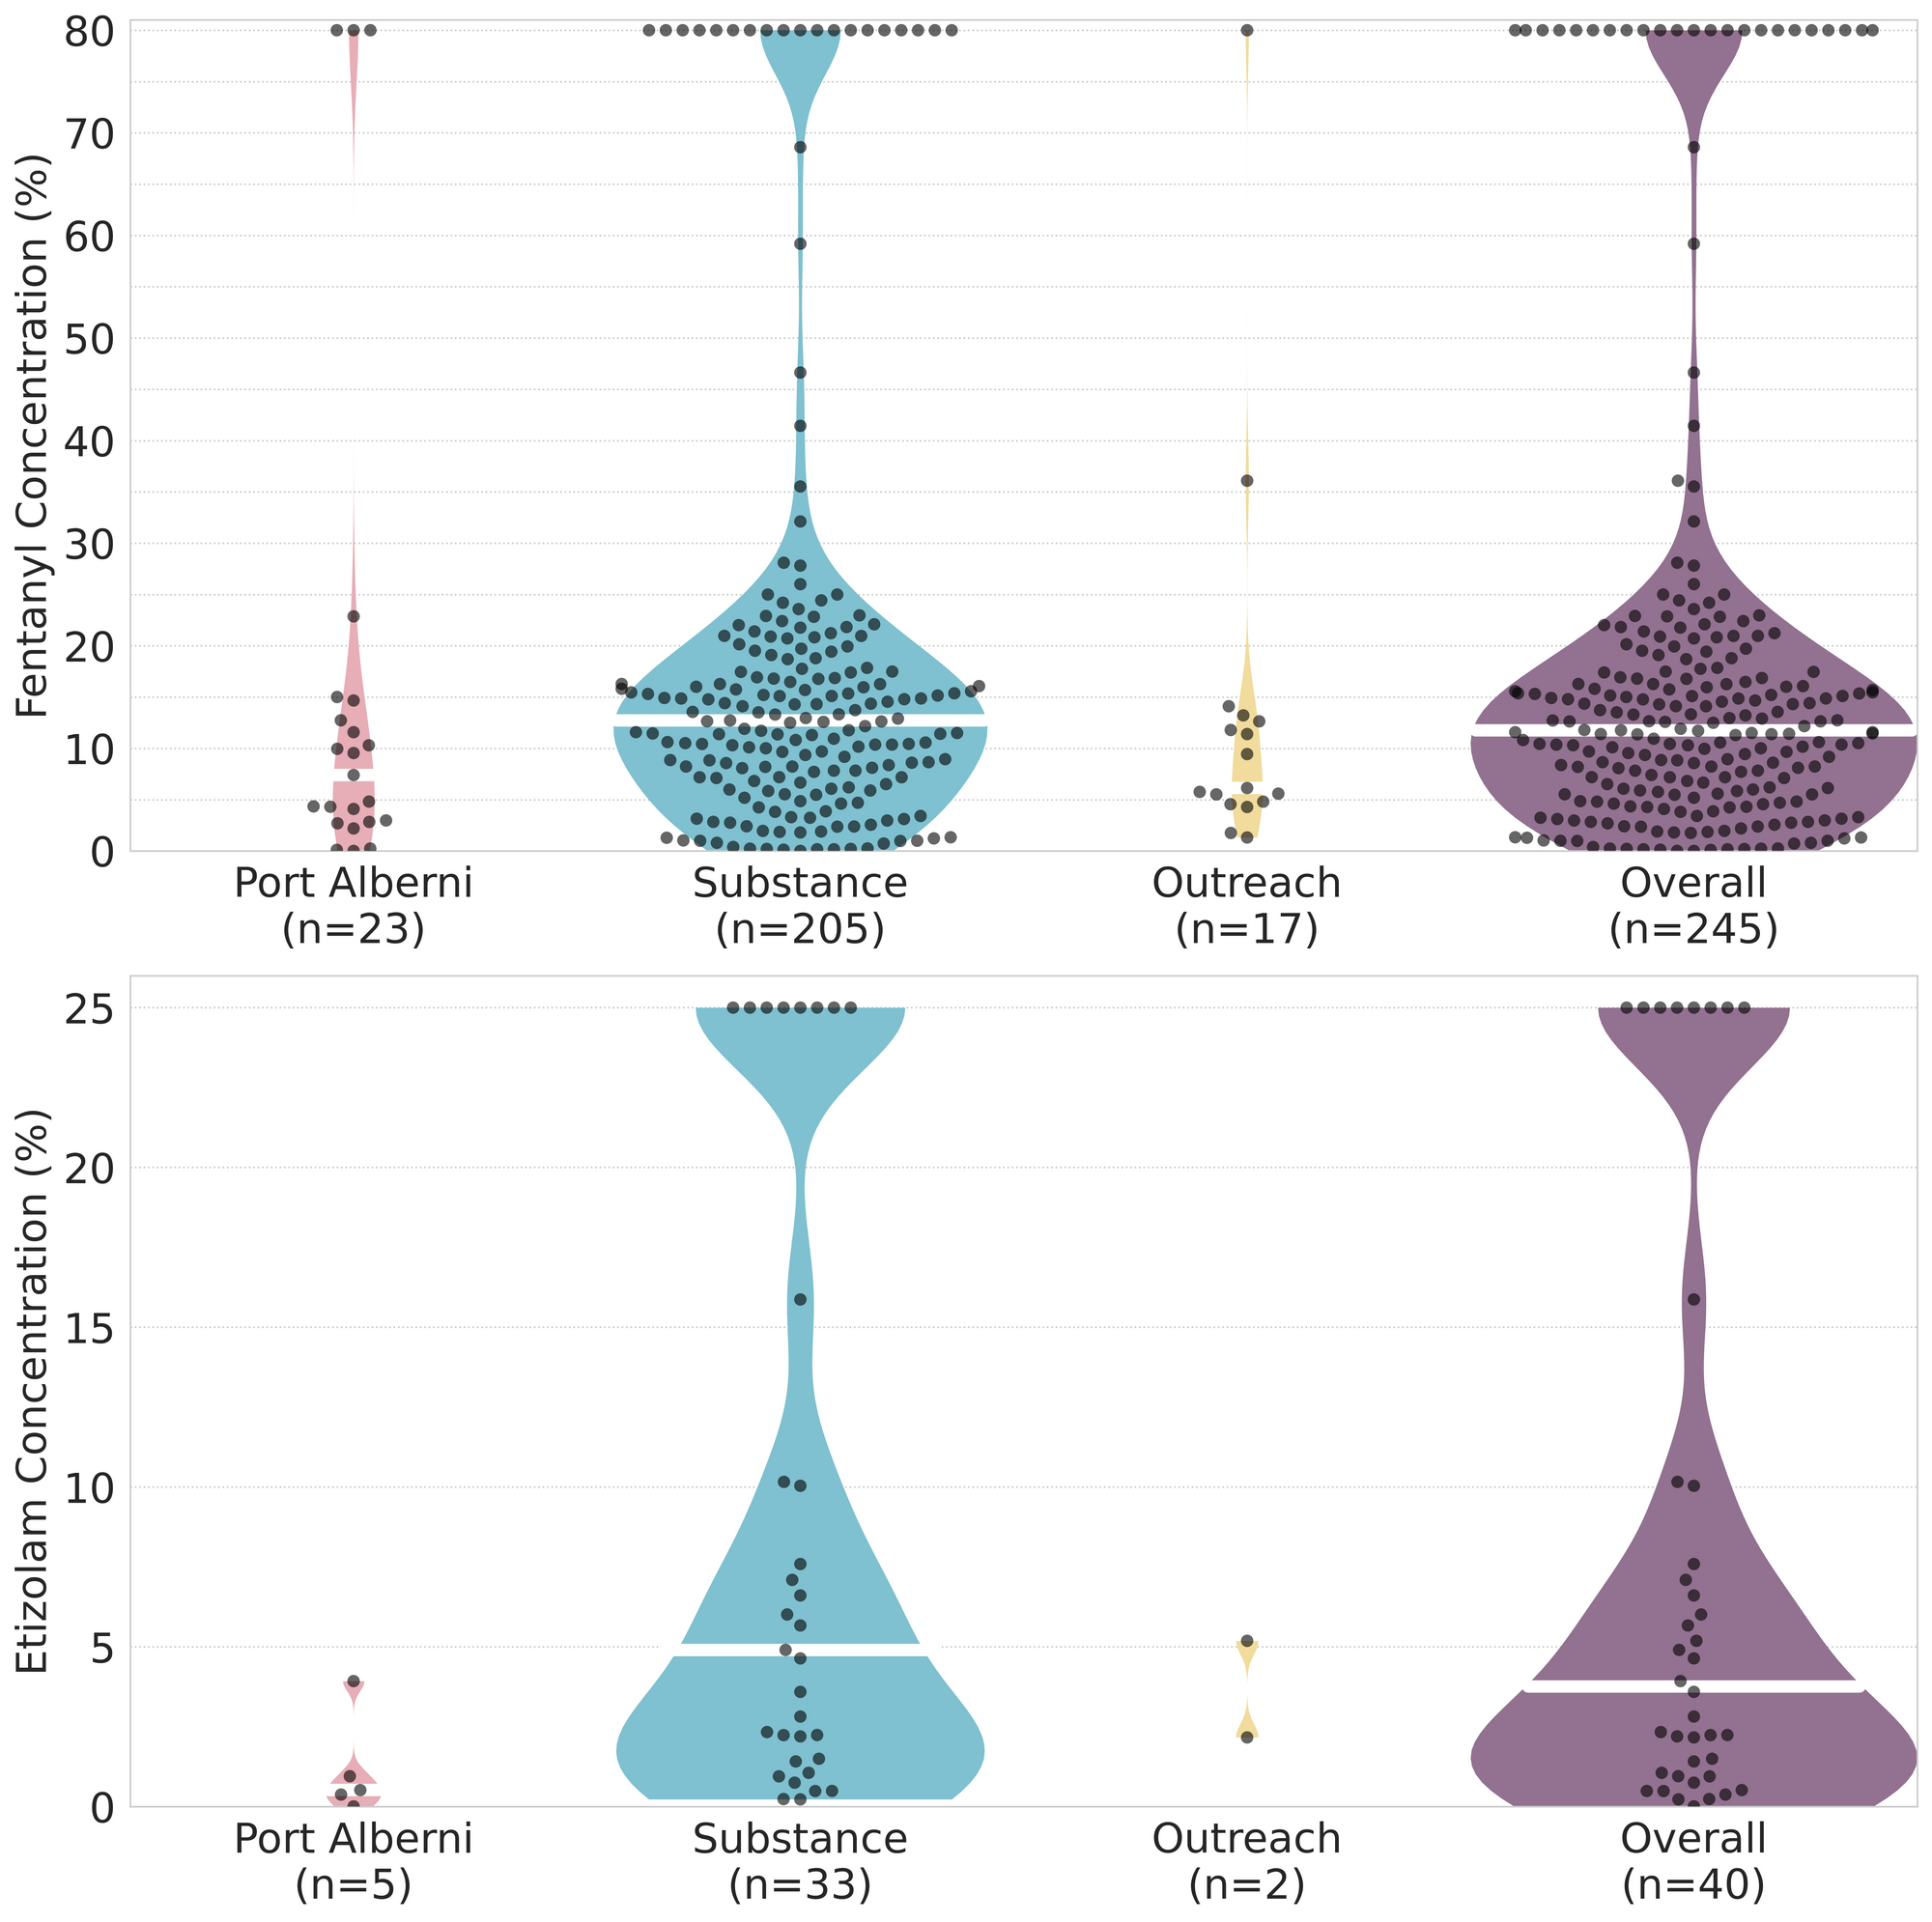
In May, we quantified fentanyl for 235 of the expected opioid-down samples containing fentanyl and found the median concentration of fentanyl to be 12.2%[2] with the average strength of fentanyl we normally see being around 15%. Though the median is a useful indicator, it doesn’t capture the volatility of fentanyl concentrations present in the opioid supply, as any one sample might be the lowest strength (0.1%) or the strongest (>80%[3]). Similarly, the concentration of etizolam was across the board in expected opioid down samples, ranging from 0.1% to >25%[3:1], with a median of 4.8%.
Fentanyl and etizolam, as the most common opioid and benzo detected in down, are highlighted here as proxies of variability, but nearly all active compounds found in down display similar volatility. Using flubromazepam as an example, and assuming a single dose of down is a “point” (100mg), we can see from Table 2 that the range of flubromazepam in a dose could range from ~0.3mg (~0.03mg alprazolam equivalent or ~1% of a 2mg Xanax bar) to ~48mg (~4mg alprazolam equivalent or ~two full 2mg Xanax bars in each dose), depending on the sample. Factor in the ~100 hour elimination half-life of flubromazepam, and effects of redosing with such a wildly variable supply become unpredictable and potentially catastrophic.
Not all opioid down samples brought to our service can be quantified. This is primarily due to too limited sample collected for our instruments to report a reliable mass percentage. Nevertheless, qualitative detection is still possible. ↩︎
This number is specific to fentanyl quantified in opioid-down samples. The median concentration listed in the Key Findings at the beginning of this blog (11.8%) is inclusive of all samples checked, across all drug classes, that contained fentanyl. ↩︎
For samples that contain more than 80% fenanyl, or more than 25% etizolam by weight, our mass spectrometer is presently unable to reproducibly assign a concentration due to the upper limits of the calibration methods currently adopted. ↩︎ ↩︎

The fentanyl and etizolam concentrations that we quantified in down samples checked in May are presented in Fig. 4. Black dots are individual opioid-down samples, Horizontal white bars show the median concentrations of fentanyl and etizolam quantified, the width of the shaded regions mirrors the number of samples at a given concentration.
Want to be notified when we release these reports? Join our mailing list to receive updates about when our reports are out. You can subscribe and unsubscribe yourself from this list at any time.
Check back next month for the June report!
As always, send us feedback at substance@uvic.ca for how we can continue to offer our drug checking results in a useful way.