June 2023 Monthly Report


In this blog post, we discuss our June 2023 report and provide more information on how to interpret the results. The PDF report can be found at the end.
Key findings:
- The median fentanyl concentration found across all drug categories was 9.9%
- Carfentanil was found in 6 samples (5 expected opioid-down, 1 “unknown”) with a median concentration of 0.08% and maximum concentration of 1.13%
- Benzodiazepines and/or etizolam were found in 45% (188/419) of expected opioid-down samples
- Bromazolam, the most common benzo found within opioid-down, was found in 154 opioid-down samples with a median concentration of 3.9% and maximum concentration of 36.0%
- Xylazine was found in 32 samples (31 expected opioid-down, 1 “unknown”) with a median concentration of 0.5% and a maximum concentration of 24.6%
Insight for the June 2023 Monthly Report
June was full tilt for Substance. In June, we checked 1062 samples, setting a new monthly record. This number not only surpasses the total samples screened throughout the entirety of 2019 (935 samples) but also closely aligns with our 2020 count (1288 samples). Moreover, this achievement accounts for approximately 40% of our annual total for 2021 (2556 samples). This surge was not limited to specific locations; rather, it was widespread across our various sites on the Island. Notably, our outreach endeavours observed the most remarkable growth during June, with 332 samples collected through these efforts. To provide context, the previous month saw 197 samples gathered through outreach initiatives.
The upsurge in outreach samples can be primarily attributed to two events: the KindleArts Society’s Otherworld: a “not-a-festival” regional Burning Man event at Lake Cowichan (121 samples) and a pop-up drug checking event as part of an ongoing collaboration with Peers (29 samples). With Peers, we hosted an on-site pop-up drug checking event at one of the housing sites where they offer a range of harm reduction and support services. The pop-up event was in collaboration with the Peers Housing Overdose Prevention team and onsite Peer Responders. The event was to raise awareness about the launch of this site as part of our weekly outreach route.
The outreach route currently makes weekly stops at numerous harm reduction and housing sites where people can have samples collected for testing and receive the latest weekly report, showcasing time-sensitive information on the most recent samples we have tested. Our outreach route continues to grow, and we are grateful for the continued partnership with Peers!
This blog, and the associated pdf report, breakdown our sample counts into six categories:
-
samples received through direct service provision in Victoria, where service users are bringing samples into the Substance storefront. These samples are labelled as “Substance” samples in the figures/tables of this blog post
-
samples received through direct service provision in Campbell River, where service users bring samples to the Vancouver Island Mental Health Society (VIHMS). These samples are labelled as “Campbell River”.
-
samples received through direct service provision in the Comox Valley, where service users are bringing samples to AVI Health & Community Services in Courtenay, BC. These samples are labelled as “Comox Valley”.
-
samples received through direct service provision in the Cowichan Valley, where service users bring samples to the Duncan Lookout Society OPS in Duncan, BC. These samples are labelled as “Duncan”.
-
samples received through direct service provision in Port Alberni, where service users bring samples into Port Alberni Shelter Society’s OPS. These samples are labelled as “Port Alberni”.
-
samples received through indirect service provision, where samples are collected through no-contact drop-off envelopes, are collected by harm reduction workers and other community members at supported housing sites, overdose prevention sites, and supervised consumption locations. These samples are labelled as “Outreach” samples in the figures/tables herein. June’s Outreach data also includes samples checked at the Otherworld event at Lake Cowichan.
Drug types
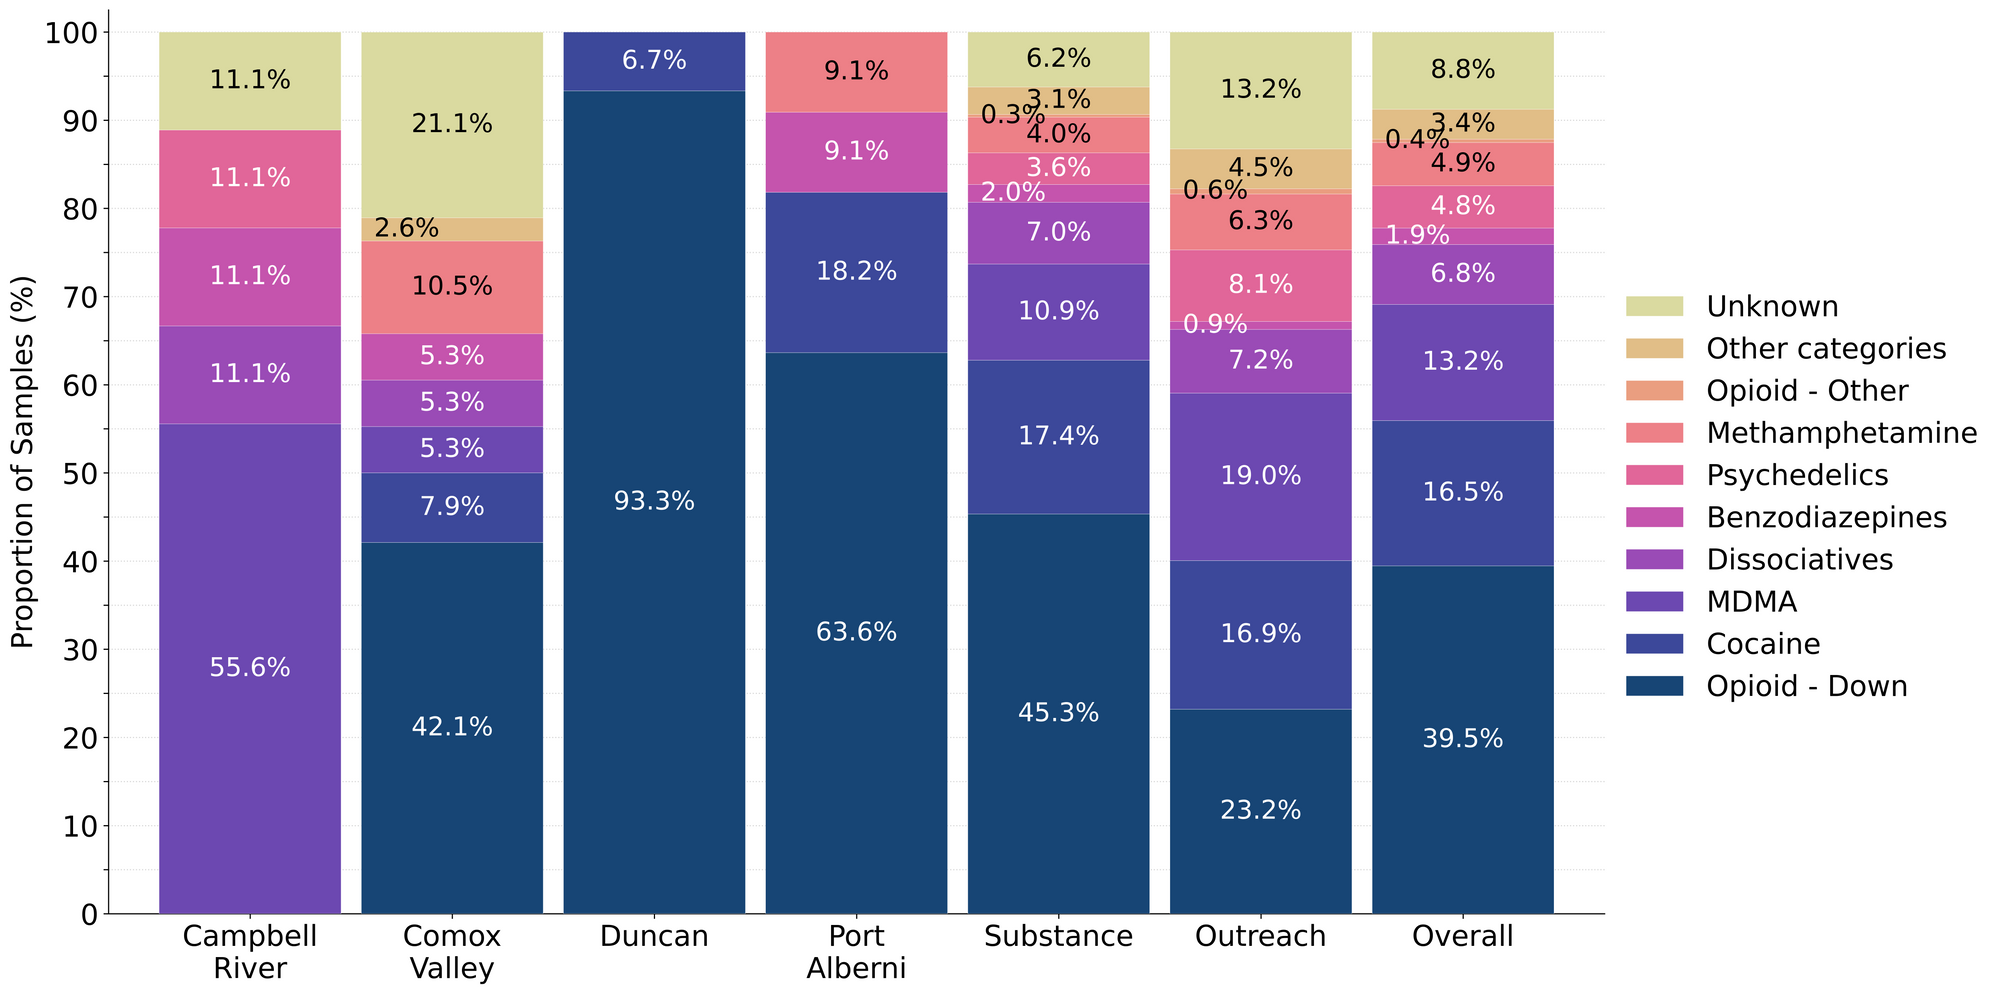
Fig. 1 shows the prevalence of each expected drug category checked, split by sample collection location/method.

June’s drug jubilee
For the majority of samples checked, we confirm the presence of the expected drug with no additional active compounds detected above the limitations of the drug check. The bar charts below highlight a few classes of drugs, differentiating samples where only the expected active component was detected - from situations when other unexpected active components were detected.
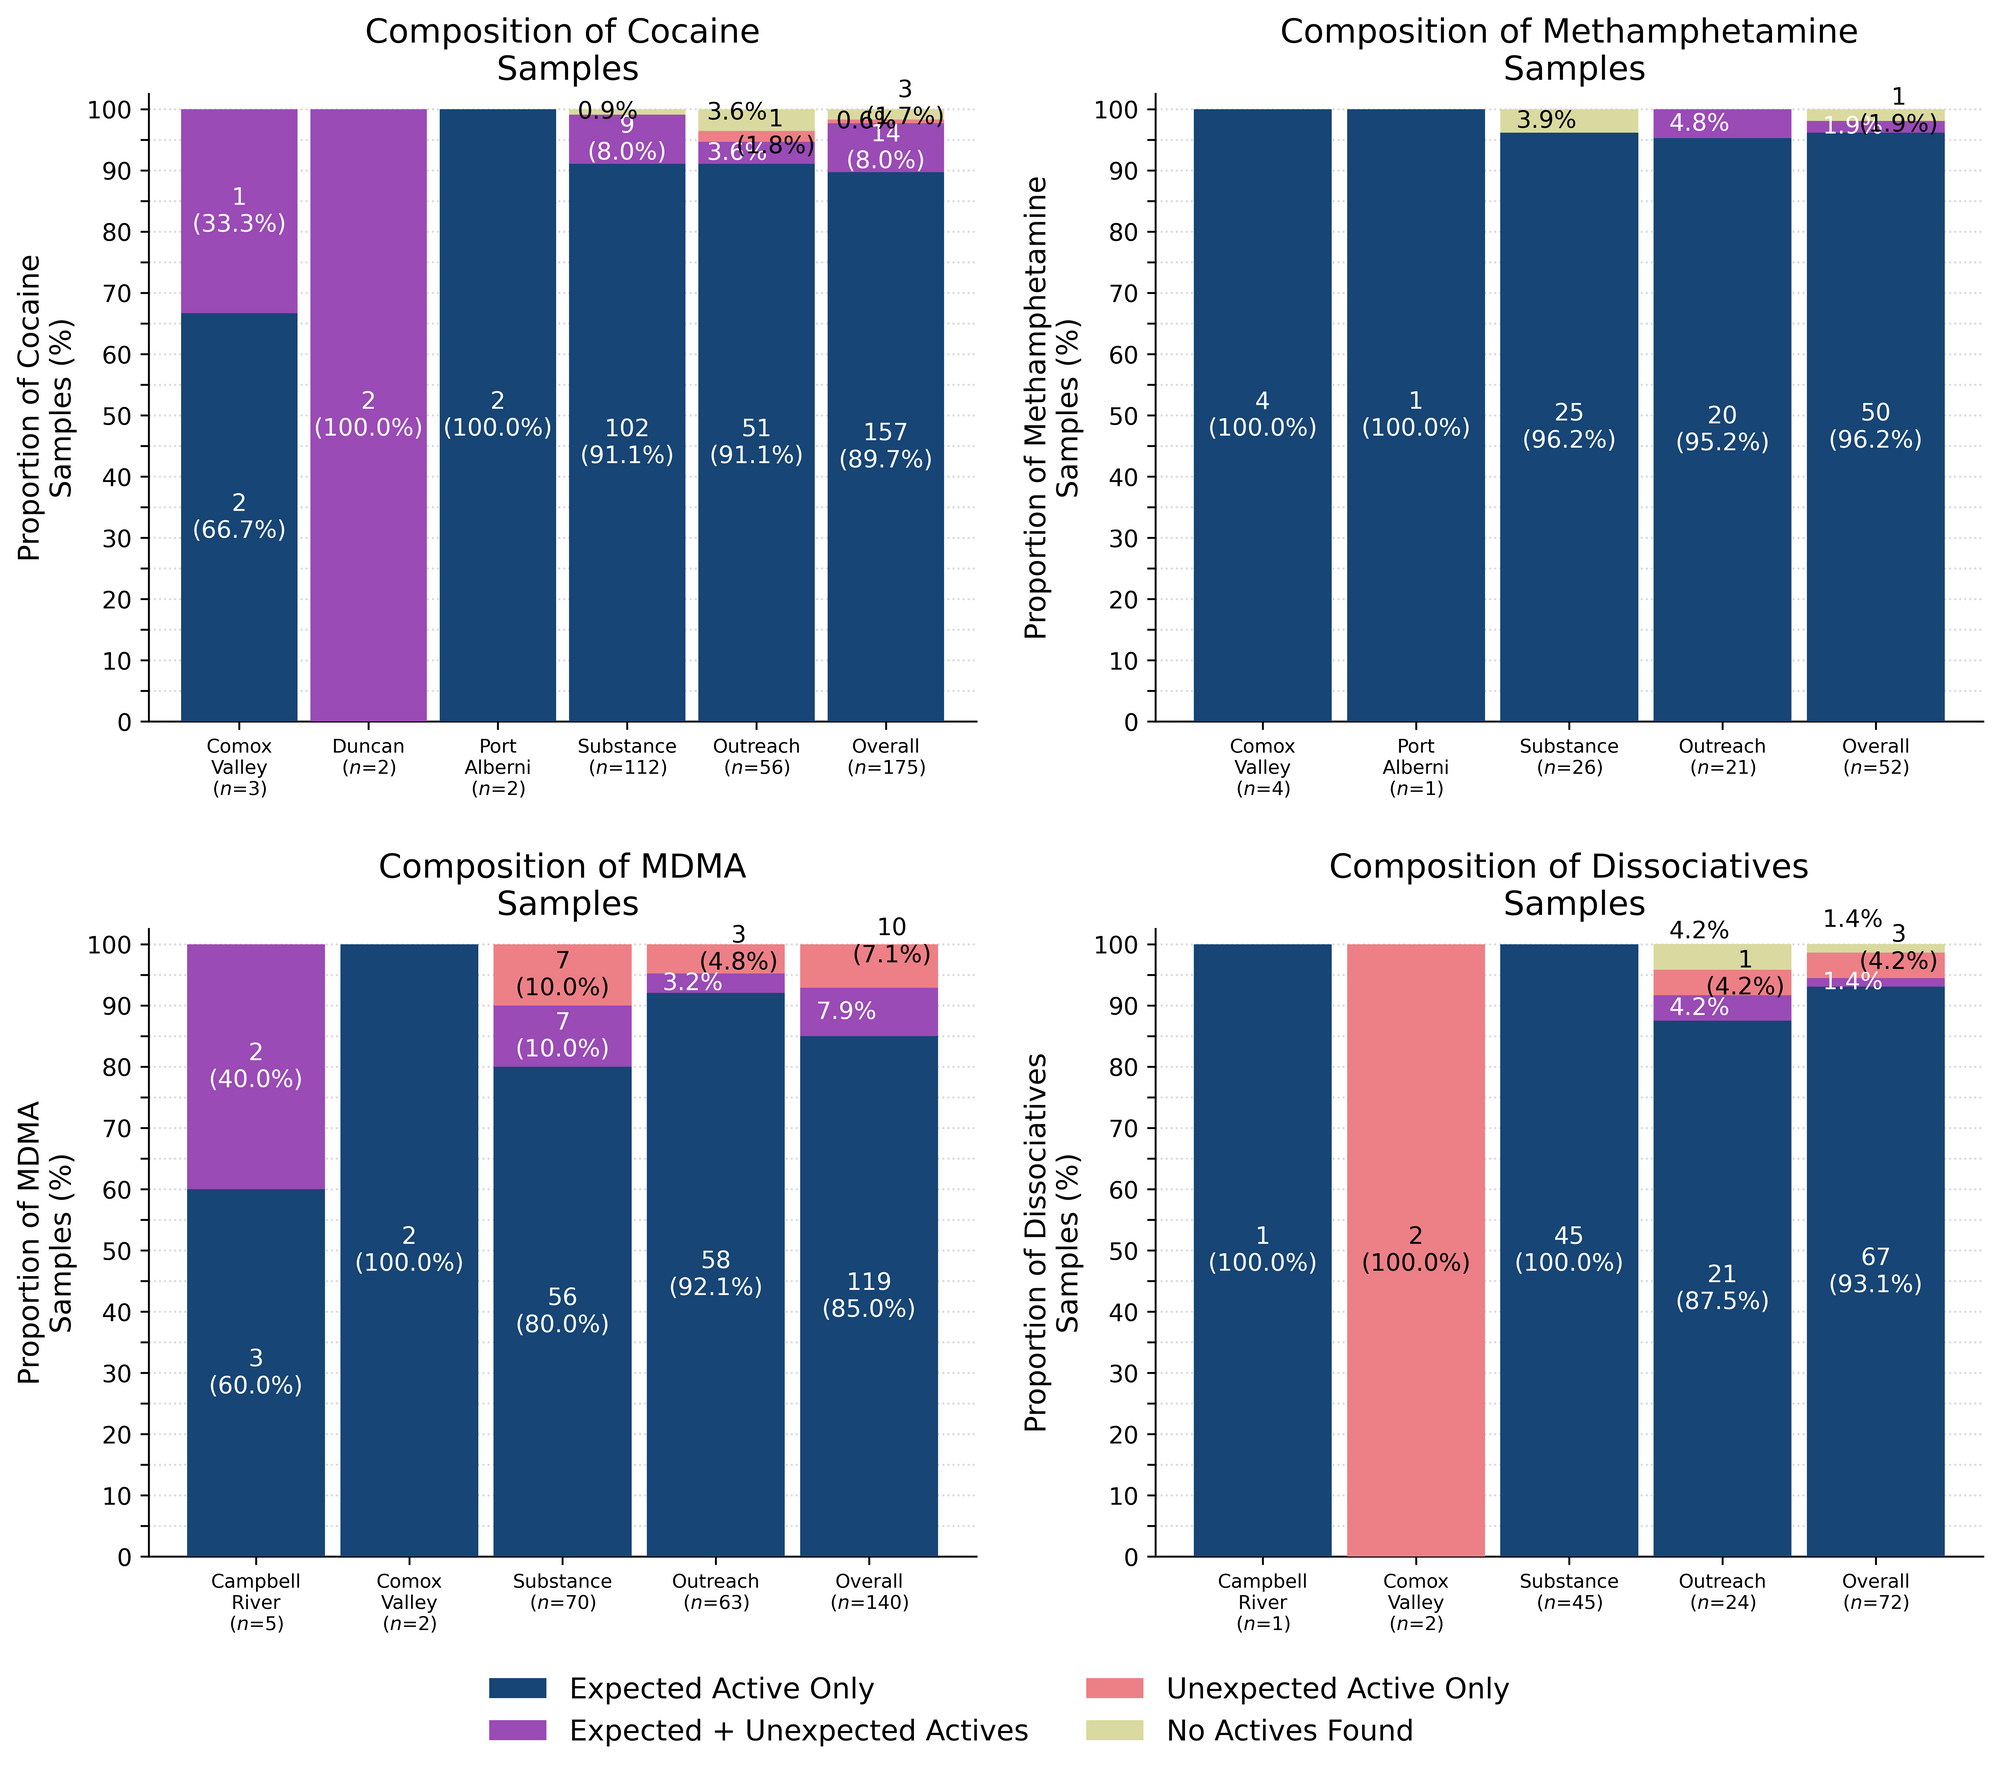
96% (50/52) of expected methamphetamine samples checked were found to be meth with no other active compounds detected. Inactive cuts were detected in six (12%) of these samples:
- Dimethyl sulfone (MSM), a food supplement and inactive cut visually similar to meth, was found in four samples (all from Victoria). MSM was found at concentrations ranging from around 5% to 70% by weight
- Caffeine + Microcrystalline cellulose were found as cuts in two pressed pill samples that were expected to contain meth (both from Victoria). Both pills contained meth at around 15-20% by weight
Of the remaining two expected methamphetamine samples:
- One sample from Victoria was found to contain methamphetamine and amphetamine at approximate ratios of 85:15. This sample was a clumpy beige powder that had not yet been tried by the service user who was concerned about the not-so-meth-like appearance of the sample
- One sample from Victoria did not contain meth and was instead a white crystalline chunk of calcium carbonate (chalk). Calcium carbonate is the active ingredient in many antacids, which in this scenario, may actually be helpful to help settle the nausea of being ripped off by your supplier
94% (67/71) of expected ketamine samples checked in June were confirmed to be ketamine with no other active compounds detected. Within these samples, only one sample from Victoria was found to contain an inactive cut (caffeine at around 10%).
Within the remaining four expected ketamine samples:
- One sample checked at Otherworld was found to contain around 40% ketamine and 60% MDA
- Two samples from the Comox Valley were sold to the service user as “Horse tranquillizer” which was interpreted to be ketamine. These samples were dark green crystals found to contain bromazolam at 0.1% with erythritol (a sugar) as a cutting agent. No ketamine was detected in these samples.
- One sample checked at Otherworld did not contain ketamine and was found to be O-PCE instead. O-PCE, also known as Deschloro-N-ethyl-ketamine, is a novel dissociative that has been reported to be generally more stimulating than ketamine with fewer cognitive and sensory suppressions. The first half of its duration has been reported to produce primarily stimulating effects with minimal dissociation whilst the second half is primarily dissociating with minimal stimulation. Users have compared the nature and cognitive effects to MXE specifically, albeit without the pronounced "body warmth" or physical euphoria and tending to produce rather stimulating and chaotic responses with higher dosages.
One expected sample of O-PCE was checked in Victoria as well and was confirmed to be O-PCE.
90% (157/175) of expected cocaine samples (129 cocaine HCl/soft, 28 cocaine base/hard/crack) checked were confirmed to be cocaine with no additional actives detected. Four of these samples were found to contain inactive cutting agents, with inositol (a sugar) detected in three samples and creatine detected in another. All four samples were checked in Victoria and all four contained approximately 50% cocaine HCl and 50% cut.
14 samples contained an active component in addition to cocaine:
- Benzocaine - One sample (Duncan); a topical local anaesthetic. This sample contained around 10% benzocaine and was also found to contain phenacetin (see below) at around 20%.
- Fentanyl or analogue - One sample (Duncan). This sample was a cocaine HCl sample that repeatedly tested positive for fentanyl (or fentanyl analogues) via immunoassay strip test, over a range of concentrations, but no fentanyl or fentanyl analogues were detected via mass spectrometry. We confirm that none of our targeted opioids are present in this sample above the limits of detection of the mass spectrometer (around 0.01% weight/weight concentration) and are unsure at this time as to why the fentanyl strip test was positive. This sample had been tried by the service user and reportedly “felt strong” but did not produce any adverse or unexpected effects.
- Levamisole - Three samples (all Outreach); an antihelminthic drug used to treat parasitic worm infections, commonly seen as a cut in cocaine
- Phenacetin - Nine samples (x1 Duncan, x2 Victoria, x6 Outreach); “super buff” a tylenol-like drug, commonly seen as a cut in cocaine
One expected cocaine HCl sample from Otherworld contained no cocaine and was found to be a mixture of MDA and MDMA instead. Despite the mixup and very different drug classes, this sample was reported to produce effects “as expected” for cocaine. Scenarios like this reinforce the ideas that “set and setting” and dosage are as important as the identity of the substance itself. Consuming stimulating drugs in already stimulating environments like festivals can be..well..quite stimulating! Lower doses of MDA/MDMA may produce the buzz people are expecting, with all of the other associated effects washed into the colourful, bubbly blur that Otherworld naturally provides. Despite the unexpected result for an “as expected” experience, we hope that post-consumption drug checking can help inform folks about their own experiences as to minimize harm and maximize pleasure in the future.
Two expected cocaine samples did not contain cocaine or any other active drugs: An expected cocaine HCl sample from Outreach was found to be a crushed-up antibiotic pill and an expected cocaine HCl sample from Victoria was found to be some sort of waxy oil-like substance with no active compounds detected.
85% (119/140) of expected MDA/MDMA samples checked were confirmed to be MDA (7 samples) and MDMA (112 samples), as expected. The remaining expected MDA/MDMA samples displayed a range of compositions, with the MDA-to-MDMA mixup representing a majority of the samples:
- Five expected MDA samples were found to be MDMA instead. Two samples were checked in Victoria and the other two at Otherworld
- Three expected MDMA samples were found to contain MDA instead. One sample was checked in Victoria and the other two at Otherworld
- Nine expected MDMA samples were found to be mixtures of both MDA and MDMA. Two samples were checked in Victoria, two samples were checked in Campbell River and the other five at Otherworld
- Two expected MDMA samples were found to be a mixture of MDMA and MDEA. MDEA (MDE/“Eve”) is reported to be less potent and less stimulating than MDMA but generally produces similar effects. Both samples were Outreach mail-in samples
- Two expected MDMA samples checked at Otherworld contained no MDMA and instead were found to be ketamine
Benzodiazepines (n=20)
85% (17/20) of the expected benzodiazepine samples checked in June came to our service sites in the form of pressed pills with the following expected and detected compositions:

Within the remaining three samples:
- Two samples, both from Victoria, were expected to be bromazolam and were confirmed to contain the expected benzo. These samples came as fine pink powders.
- One sample from Port Alberni was a yellowish-brown powder expected to contain benzos of an unknown identity. This sample was found to contain bromazolam with a trace amount of fentanyl or fentanyl analogue detected via strip test. No fentanyl or fentanyl analogues were detected via PS-MS.
Opioid-positivity in non-opioid-down samples
In June, we checked 550 samples that were not expected to contain fentanyl or other “unexpected” opioids[1]. Since the opioid-down supply is no longer “just heroin” or “just fentanyl” and is instead a complex, potent, and ever-changing polysubstance market containing other synthetic opioids like fluorofentanyl or nitazenes, here we will examine the prevalence of any unexpected opioid, not just fentanyl, detected in non-opioid-down samples.
Specifically, we are excluding samples that were expected to be “opioid-down” or samples that had an “unknown/missing” expected composition. In the case of “opioid-other” samples, e.g. hydromorphone tablets and oxycodone pills, “unexpected opioids” are defined as any opioid that is not the expected opioid. ↩︎

Examining Table 3, we find that two samples tested positive for unexpected opioids in June, representing 0.4% of all non-opioid-down samples checked. One sample was a cocaine HCl sample checked in Duncan that tested positive for fentanyl via strip test (already mentioned above) and the other was an unknown benzo sample from Port Alberni that tested positive for fentanyl via strip test (already mentioned above).
In June, no unexpected opioids were detected in samples expected to be MDMA, dissociatives, methamphetamine, psychedelics, or prescription opioids.
In people’s personal quests for bodily autonomy and informed consumption, there is often evaluation of risk and consequence, but when the consequences can be severe and the risks are unknown or are intentionally exaggerated, these become difficult, if not impossible, conversations to weigh. We believe that drug checking can help provide people with the information needed to evaluate the risks, and provides harm reduction advice to minimize undesired consequences of substance use. These data are not meant to downplay concerns or invalidate past experiences. We recognize the tragic consequences of when fentanyl is found in non-opioid samples and honour the heartbreak that such experiences produce. Instead, we present these data with the intent to combat misinformation and provide an evidence-based context for people to consider when making decisions about substance use. While these numbers reflect what we have seen over the course of the project, these (roughly) 1-in-200 events still occur, so we always encourage folks to get their stuff checked.
Opioid-Down (n=419)
In this section we present results specific to the opioid-down supply, therefore they may differ from the highlighted findings above that are inclusive of all expected drug categories.
- 82% of expected opioid-down samples contained fentanyl (343/419)
- Nine samples contained heroin (2.1% of expected opioid-down samples)
- Four samples were heroin (and related alkaloids like acetylmorphine (MAM) and acetylcodeine) with no other active compounds detected. Caffeine was found as a cut in one sample. Two samples were mailed-in and the other two were checked in Victoria
- The other five samples contained heroin with the additional actives fentanyl, fluorofentanyl, carfentanil, bromazolam, etizolam, and lidocaine sporadically detected in various concentrations as well
- 65% of expected opioid-down samples contained fluorofentanyl (272/419)
- Five samples contained carfentanil (1.2% of all opioid-down samples)
- One sample from Duncan contained 0.29% carfentanil in addition to fentanyl at 1%, fluorofentanyl at 0.2%, xylazine at 1%, and bromazolam at 0.6%
- One sample from Victoria contained carfentanil at 1.13%, fentanyl at 16%, and bromazolam at 9%
- Three samples were collected via Outreach and contained:
- Carfentanil at 0.02%, fentanyl at 5%, xylazine at 0.3%, furanyl UF-17 (an opioid-like substance) at 2%, and bromazolam at 0.2%
- Carfentanil at 0.06% and fentanyl at 8%
- Carfentanil at 0.08%, heroin at 20%, acetylcodeine at 1%, fentanyl at 9%, and etizolam at 1%
- 45% of expected opioid-down samples contained a benzodiazepine and/or etizolam (188/419)
- Xylazine was detected in 7% (31/419) of opioid-down samples
In June, 62% (261/419) of all opioid-down samples checked contained an additional active to the expected fentanyl/heroin. These data are shown in Fig. 3 highlighting the prevalence of benzos, fluorofentanyl, and xylazine in the down supply.
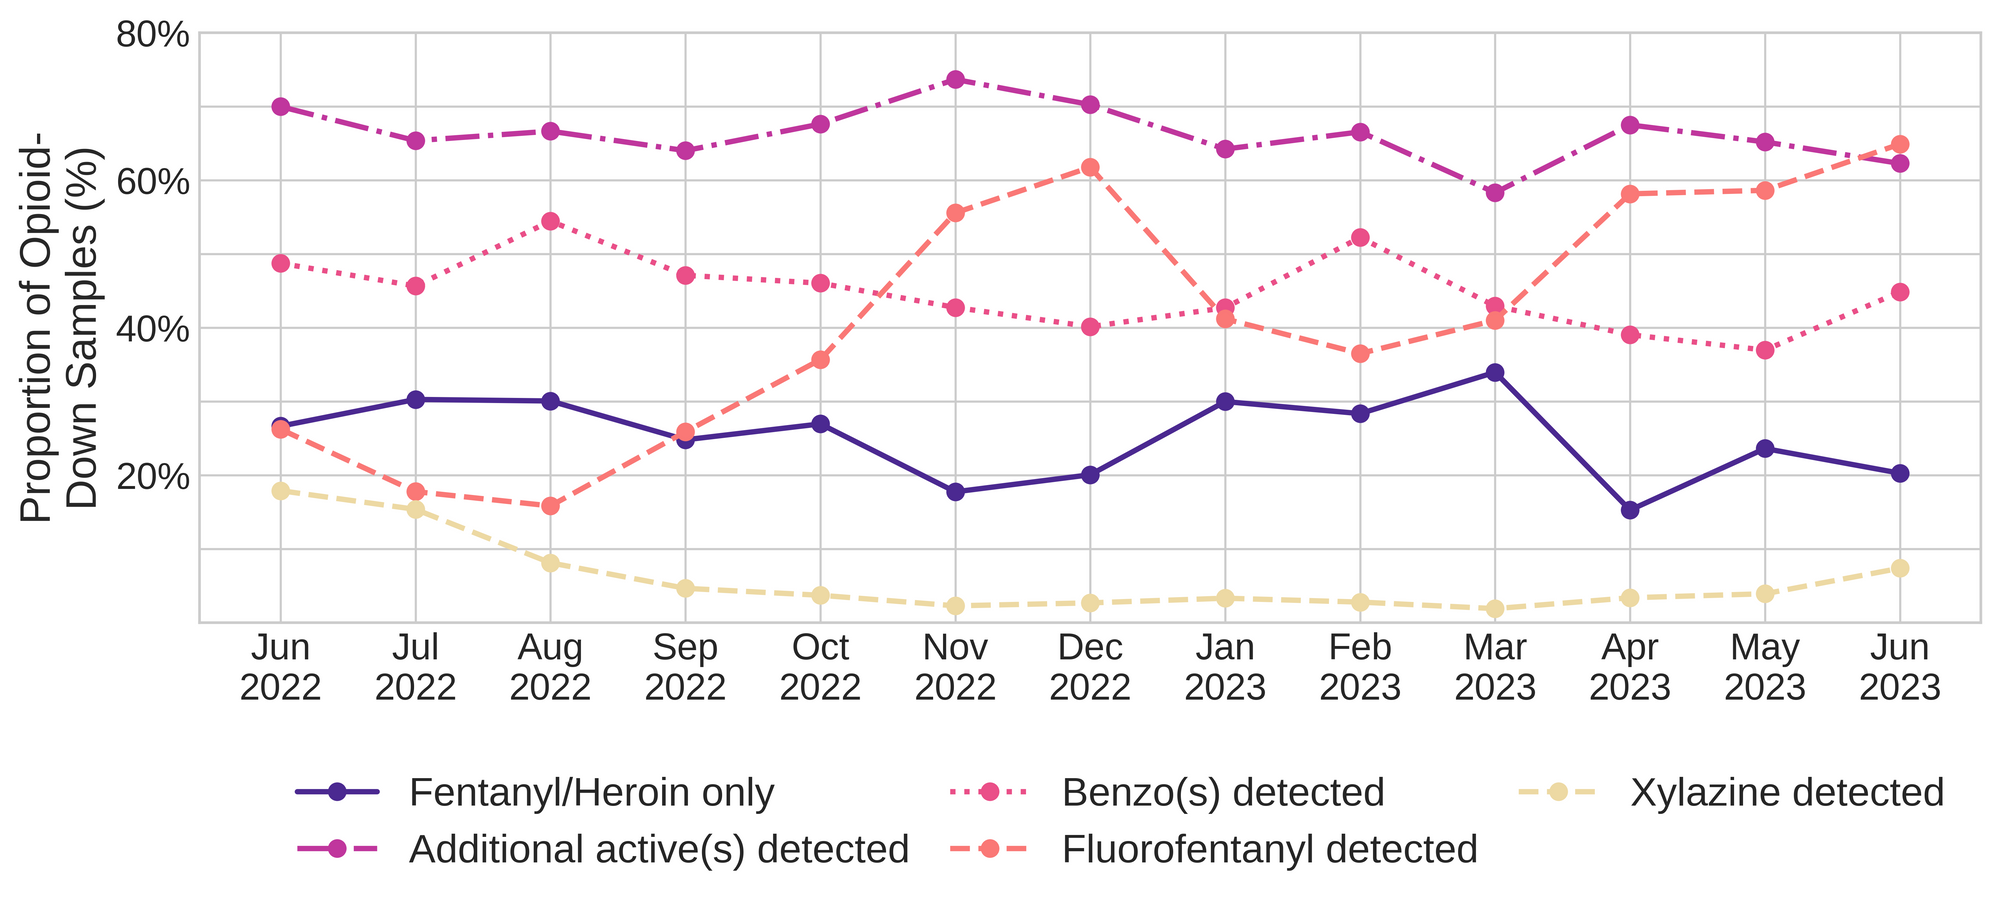
Fluorofentanyl was the most common additional active found within the opioid-down supply, with 49% (206/419) of opioid-down samples containing fluorofentanyl in addition to fentanyl. Additionally, fluorofentanyl was the only opioid detected in 16% (66/419) of opioid-down samples (i.e. no fentanyl or heroin was detected in these samples). This is double the prevalence of fluorofentanyl “only” samples that we saw in May.
Benzo-related drugs contribute to a majority of the other additional actives found in expected opioid-down samples, with 45% (188/419) of expected opioid-down samples checked containing a benzo-related drug. Bromazolam continues to be the most common benzo seen in the down supply, with bromazolam being detected in 82% (154/188) of the benzo-positive opioid-down samples. Scattered detections of other drugs are still found and can be reviewed in the pdf report at the end of this blog.
Quantification for Expected Opioid-Down[1]
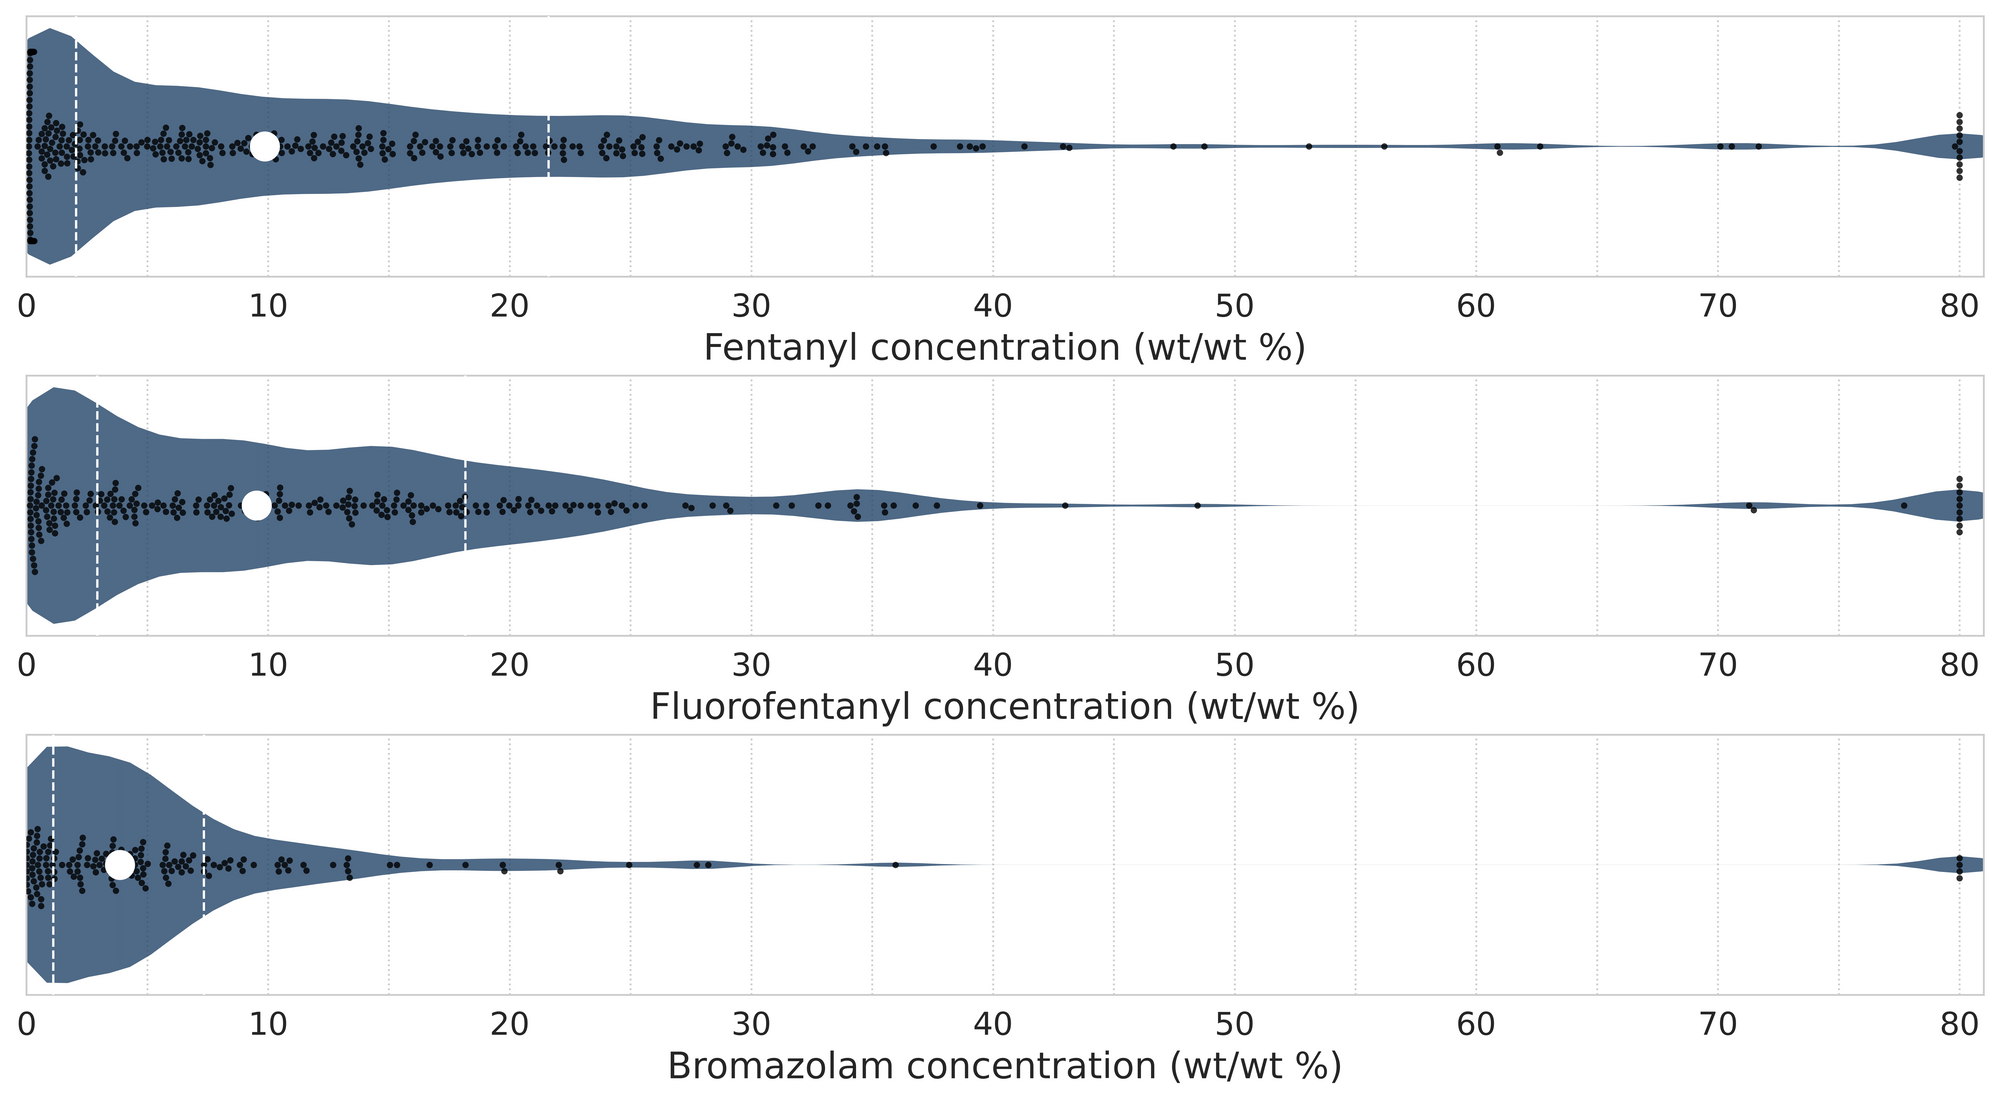
In June, we quantified fentanyl for 336 of the expected opioid-down samples containing fentanyl and found the median concentration to be 9.8%[2]. Though the median is a useful indicator, it doesn’t capture the volatility of fentanyl concentrations present in the opioid supply, as half of fentanyl-positive down samples contained between 1.9% and 21.7% fentanyl, and any one sample might be the lowest strength (0.1%) or the strongest (>80%[3]). Fluorofentanyl was seen at concentrations ranging from 0.2% to greater than 80% as well, with a similar median concentration of 9.9%. Similarly, the concentration of bromazolam was across the board in expected opioid down samples, with samples ranging from less than 0.1% to 36.0% bromazolam, with a median of 3.9%. For context, 4% bromazolam would be roughly equivalent to two full 2mg Xanax bars worth of benzo in each point (100mg) of down.
Not all opioid down samples brought to our service can be quantified. This is primarily due to too limited sample collected for our instruments to report a reliable mass percentage. Nevertheless, qualitative detection is still possible. ↩︎
This number is specific to fentanyl quantified in opioid-down samples. The median concentration listed in the Key Findings at the beginning of this blog (9.9%) is inclusive of all samples checked, across all drug classes and unknown samples, that contained fentanyl. ↩︎
For samples that contain more than 80% fentanyl, or more than 25% etizolam by weight, our mass spectrometer is presently unable to reproducibly assign a concentration due to the upper limits of the calibration methods currently adopted. ↩︎

The fentanyl, fluorofentanyl, and bromazolam concentrations that we quantified in June, across all expected drug categories and service models, are presented in Fig. 4. Small black dots are individual opioid-down samples, the large white dot shows the median concentration, dashed white lines bound half of the quantified samples, and the width of the shaded regions mirrors the number of samples at a given concentration.
We can also examine the regional variability in the unregulated market. The table below expands on the quantitative data presented above. It focuses only on fentanyl, fluorofentanyl, carfentanil, bromazolam, and xylazine quantified within expected opioid-down samples, separated by collection location/model. Weight percentage is reported; “IQR” is the interquartile range: the range that contains half of the quantified samples.

Want to be notified when we release these reports? Join our mailing list to receive updates about when our reports are out. You can subscribe and unsubscribe yourself from this list at any time.
As always, send us feedback at substance@uvic.ca on how we can continue to offer our drug checking results in a useful way.