May 2023 Monthly Report

In this blog post, we discuss our May 2023 report and provide more information on how to interpret the results. The PDF report can be found at the end.
Key findings:
- The median fentanyl concentration found across all drug categories
was 10.2% - Carfentanil was found in 2 expected opioid-down samples at concentrations of 0.07% and 1.70%
- Benzodiazepines and/or etizolam were found in 37% (170/457) of expected opioid-down samples
- Bromazolam, the most common benzo found within opioid-down, was found in 153 down samples with a median concentration of 2.2% and maximum concentration of 44.6%
- Xylazine was found in 21 samples (18 expected opioid-down, 3 “unknown”) with a median concentration of 1.1% and a maximum concentration of 29.1%
- Fentanyl was detected in 1 sample expected to be cocaine base (hard/crack) from Victoria. This sample repeatedly tested positive for fentanyl via immunoassay strip test, over a range of concentrations, but no fentanyl or fentanyl analogues were detected via mass spectrometry.
Insight for the May 2023 Monthly Report
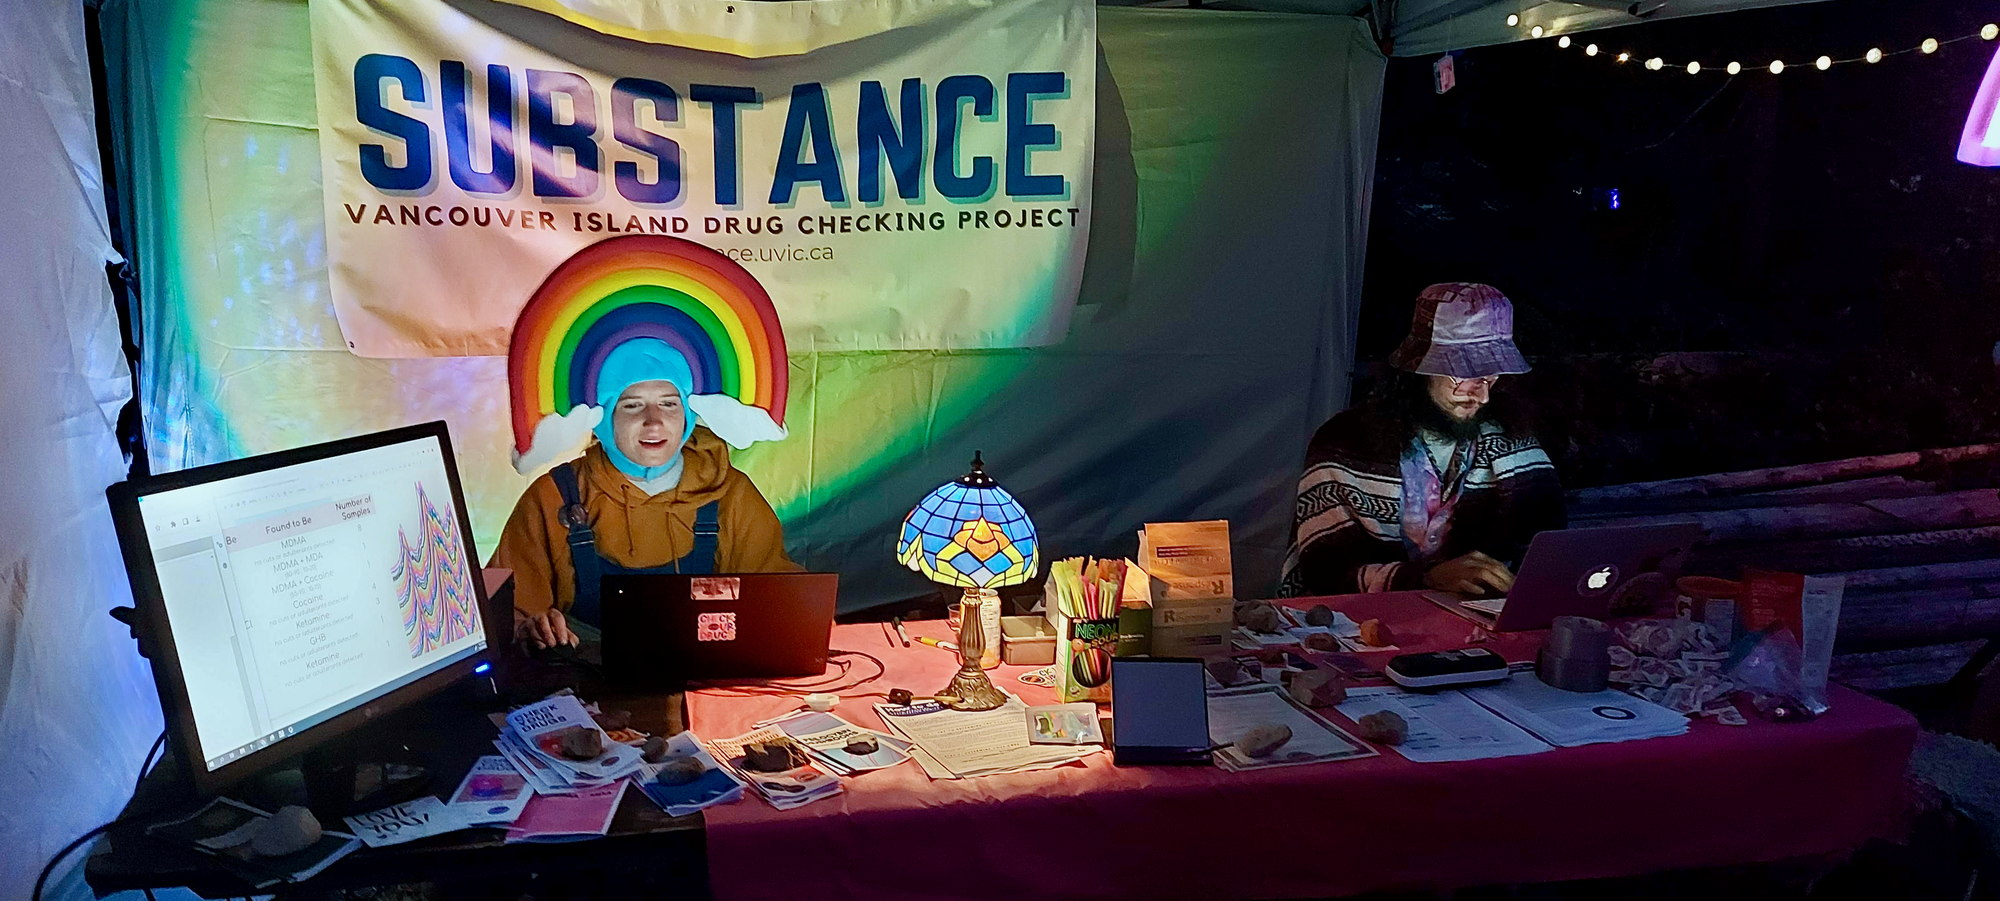
May marked the beginning of the 2023 festival drug checking season, as Substance staff merrily meandered up to Lake Cowichan for the marvellous Lamplight Year One Festival. Monitoring 50 samples during two magical nights of drug checking, the mix of molecules examined was as mesmerizingly diverse as the myriad of costumes modelled by the festival-goers who submitted the samples. Drug checking at Lamplight was enabled through the Urgent Public Health Needs Sites (UPHNS) exemption administered by the Province of British Columbia and approved by Island Health's Medical Health Officer. We would like to express our gratitude to Island Health for providing funding for festival drug checking on Vancouver Island this year and we would further like to thank Lamplit Events for facilitating critical harm reduction services at the event. We look forward to seeing you all at Year Two.
This blog, and the associated pdf report, breakdown our sample counts into six categories:
-
samples received through direct service provision in Victoria, where service users are bringing samples into the Substance storefront. These samples are labelled as “Substance” samples in the figures/tables of this blog post
-
samples received through direct service provision in Campbell River, where service users bring samples to the Vancouver Island Mental Health Society (VIHMS). These samples are labelled as “Campbell River”.
-
samples received through direct service provision in the Comox Valley, where service users are bringing samples to AVI Health & Community Services in Courtenay, BC. These samples are labelled as “Comox Valley”.
-
samples received through direct service provision in the Cowichan Valley, where service users bring samples to the Duncan Lookout Society OPS in Duncan, BC. These samples are labelled as “Duncan”.
-
samples received through direct service provision in Port Alberni, where service users bring samples into Port Alberni Shelter Society’s OPS. These samples are labelled as “Port Alberni”.
-
samples received through indirect service provision, where samples are collected through no-contact drop-off envelopes, are collected by harm reduction workers and other community members at supported housing sites, overdose prevention sites, and supervised consumption locations. These samples are labelled as “Outreach” samples in the figures/tables herein. May’s Outreach data also includes samples checked at the Lamplight Year One festival.
Drug types
Fig. 1 shows the prevalence of each expected drug category checked, split by sample collection location/method.


May’s molecular measures
For the majority of samples checked, we confirm the presence of the expected drug with no additional active compounds detected above the limitations of the drug check. The bar charts below highlight a few classes of drugs, differentiating samples where only the expected active was detected - from situations when other unexpected active components were detected.
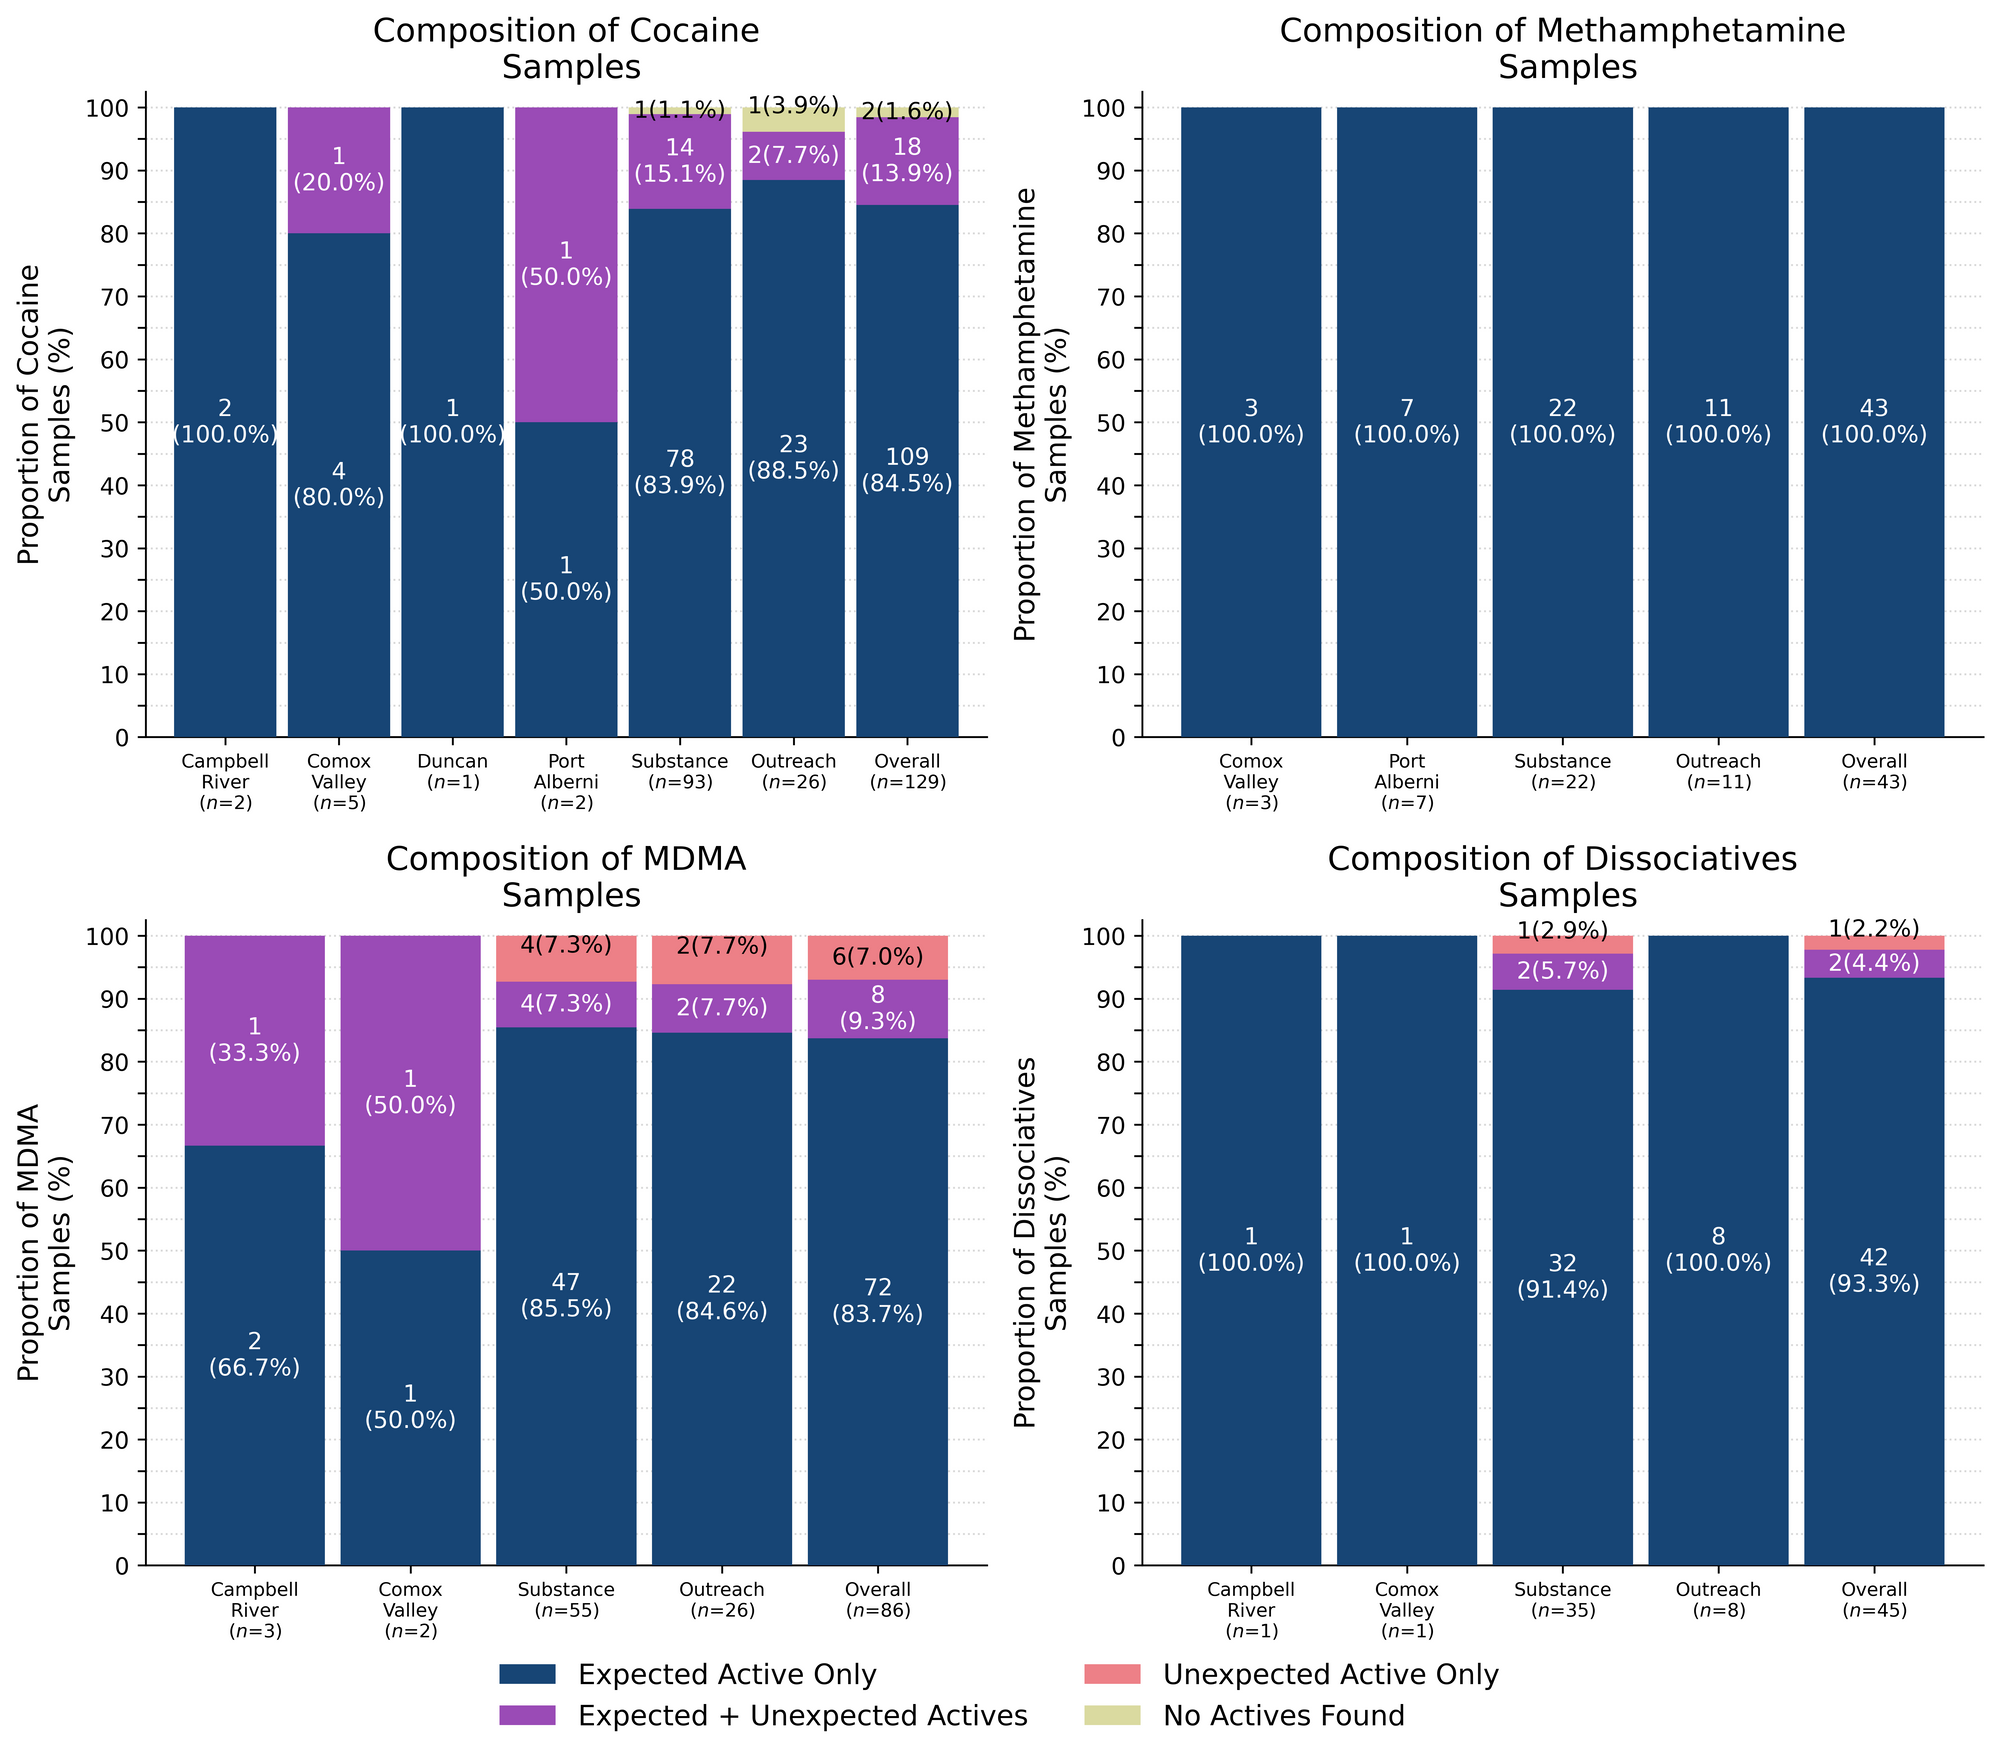
100% (43/43) of expected methamphetamine samples checked were found to be meth with no other active compounds detected. Meth sure is meth! Inactive cuts were detected in seven of these samples:
- Dimethyl sulfone (MSM), a food supplement and inactive cut visually similar to meth, was found in six samples (x5 from Port Alberni, x1 from Victoria). MSM was found at concentrations ranging from 10% to 90% by weight
- Caffeine + Microcrystalline cellulose were found as cuts in two pressed pill samples that were expected to contain meth (x1 from the Comox Valley and x1 from Victoria). Both pills contained meth at around 5-10% by weight
93% (42/45) of expected ketamine samples checked in May were confirmed to be ketamine with no other active compounds detected. Within these samples, three samples were found to contain inactive cuts. One sample was found to contain taurine, an amino acid, as a cut at around 15-20%, and two samples contained MSM as a cut at 15% and 30%; all three samples were checked in Victoria.
Within the remaining three expected ketamine samples:
- One sample from Victoria was found to primarily contain ketamine with phenacetin detected at around 1% as well. Phenacetin (a.k.a. “super-buff”) is a Tylenol-like drug and a common cut found in cocaine samples
- One sample from Victoria was found to be a mixture of approximately 30-40% ketamine and 60-70% cocaine
- One sample from Victoria did not contain ketamine and was found to be ephenidine instead. Ephenidine (also known as NEDPA and EPE) is a dissociative anesthetic similar to ketamine in effects and potency. Ephenidine is reported to have a much more rapid onset and lower half-life when vaporized or smoked
85% (109/129) of expected cocaine samples (87 cocaine HCl/soft, 22 cocaine base/hard/crack) checked were confirmed to be cocaine with no additional actives detected. Only one of these samples was found to contain an inactive cutting agent, with caffeine detected at around 10% by weight in a cocaine base sample from Victoria.
18 samples contained an active component in addition to cocaine:
- Fentanyl - One sample (Victoria). This sample was a cocaine base sample that repeatedly tested positive for fentanyl (or fentanyl analogues) via immunoassay strip test, over a range of concentrations, but no fentanyl or fentanyl analogues were detected via mass spectrometry. We confirmed that none of our targeted opioids are present in this sample above the limits of detection of the mass spectrometer (around 0.01% weight/weight concentration) and are unsure at this time as to why the fentanyl strip test was positive. It is not known if this sample had been tried by the service user.
- Levamisole - Four samples (x2 Victoria, x1 Outreach (Lamplight festival), x1 Comox Valley); an antihelminthic drug used to treat parasitic worm infections, commonly seen as a cut in cocaine
- MDMA - One sample (Victoria)
- Methamphetamine - One sample (Outreach)
- Phenacetin - 11 samples (x1 Port Alberni, x1 Victoria); “super buff” a tylenol-like drug, commonly seen as a cut in cocaine
Two expected cocaine samples did not contain cocaine or any other active drugs: An expected cocaine base sample from Victoria was found to be baking soda, and an expected cocaine HCl sample from Victoria was found to be some sort of waxy oil-like substance with no active compounds detected.
84% (72/86) of expected MDA/MDMA samples checked were confirmed to be MDA (4 samples) and MDMA (68 samples), as expected. The remaining expected MDA/MDMA samples displayed a range of compositions, with the MDA-to-MDMA mixup representing a majority of the samples:
- Two expected MDA samples were found to be MDMA instead. One sample was checked in Victoria and the other at the Lamplight Year One festival
- One expected MDMA sample from Victoria was found to contain MDA instead
- Four expected MDMA samples were found to be mixtures of both MDA and MDMA. Two samples were checked in Victoria, one sample was checked in Campbell River and the other at the Lamplight festival
- Three expected MDMA samples were found to be a mixture of MDMA and MDEA. MDEA (MDE/“Eve”) is reported to be less potent and less stimulating than MDMA but generally produces similar effects. Two samples were from Victoria and one sample was from the Comox Valley
- One expected MDMA sample checked at the Lamplight festival was found to be a mixture of MDMA and around 5% cocaine powder
- Three expected MDMA samples contained no MDMA and instead were found to be:
- 4-AcO-DMT - One sample from the Lamplight festival
- Cocaine HCl - One sample from Victoria
- Ketamine - One sample from Victoria
Benzodiazepines (n=28)
75% (21/28) of the expected benzodiazepine samples checked in May came to our service sites in the form of pressed pills with the following expected and detected compositions:

The expected diazepam/Valium tablet that was found to be pregabalin, and the “unknown benzo” tablet found to contain mirtazapine were both visually consistent with pregabalin and mirtazapine formulations, however, these samples were still believed to be benzodiazepine pressed pills, as reported by the service users.
Within the remaining seven samples:
- Five samples (x4 from Victoria and x1 from the Comox Valley) were expected to be bromazolam. These samples came as fine powders with various colours ranging from white to light yellow, to peachy pink.
- The four samples from Victoria were confirmed to contain bromazolam, with one sample containing both bromazolam and trace amounts of flualprazolam
- The sample from the Comox Valley was too small for us to run any tests beyond the fentanyl strip test, which was negative
- Two samples, both from Victoria, were both powders expected to contain benzos of an unknown identity
- One sample, a fine peach powder, was found to contain bromazolam
- One sample, a clumpy white powder, was found to be cocaine cut with caffeine at around 10-15%. No benzos were detected in this sample
Opioid-positivity in non-opioid-down samples
Some of our most frequently asked questions revolve around the presence of fentanyl in unexpected places: “how often do you find fentanyl in cocaine?”, “Is it true that they are cutting fentanyl into the meth?”, “my friend’s cousins’ Grade 6 math teacher’s favourite 24-hour news cycle commentator said that fentanyl is the most common cut for MDMA?”
These questions often stem from a genuine interest in personal wellness and safety which is certainly understandable given the lack of information about drugs obtained from the unregulated market. However, when faced with the data, we worry that the high frequency of these questions reflects not only the lack of evidence-based information available about drugs but is also the unintentional dissemination of the massive steaming heaps of misinformation that have been created with insidious intent by drug prohibitionists to feed into people’s fear and are outgassing noxious fumes into our collective airspace to further propagate anti-drug rhetoric and stigma against people who use drugs.
Given the prevalence of misinformation, it is absolutely not the fault of individuals seeking information if they are swayed by sensationalist narratives. Let us take a more objective look at the situation, as our project sees it here on Vancouver Island.

In May, we checked 383 samples that were not expected to contain fentanyl or other “unexpected” opioids[1]. Since the opioid-down supply is no longer “just heroin” or “just fentanyl” and is instead a complex, potent, and ever-changing polysubstance market containing other synthetic opioids like fluorofentanyl or nitazenes, here we will examine the prevalence of any unexpected opioid, not just fentanyl, detected in non-opioid-down samples.
Examining Table 3, we find that two samples tested positive for unexpected opioids in May, representing 0.5% of all non-opioid-down samples checked. One sample was a cocaine base sample checked in Victoria that tested positive for fentanyl via strip test (already mentioned above) and the other was an expected protonitazene sample from Victoria that was found to be isotonitazene and butonitazene instead.
In May, no unexpected opioids were detected in samples expected to be MDMA, dissociatives, methamphetamine, psychedelics, or benzodiazepines.
When addressing questions like “Is there fentanyl in the cocaine?” it is also important to ask “Is there actually cocaine in the cocaine?” too. Obviously, full misrepresentations can be spooky and can result in challenging or unexpected scenarios (e.g. down being sold as cocaine), however, if we are interested in evaluating the co-prevalence of opioids and non-opioids (e.g. fentanyl being cut into cocaine), then we need to review the samples where the presence of the expected drug was confirmed. Examining the two rightmost columns of Table 3, we show the number of samples in each expected drug class that were confirmed to contain the expected drug, and then the subset of those that also tested positive for opioids. If this is clear as mud, let us look at an example:
- In May, we checked 383 total samples that were not expected to be opioid-down or were “unknown”
- In those 383 samples, 2 samples were found to contain an unexpected opioid (0.5% of the total)
- However, only 347 of the 383 samples actually contained the expected drug (i.e. 90.6% of all non-opioid-down samples checked were confirmed to contain the expected drug)
- Within these, only 1 sample was found to contain an unexpected opioid (i.e. 0.3% of all non-opioid-down samples checked that were confirmed to contain the expected drug were also found to contain unexpected opioids).
- The difference between these two sets will also tell us the number of “misrepresented” samples that contained an unexpected opioid (i.e. 36 non-opioid-down samples checked in May did not contain the expected drug. 1 sample (2.8% of the “misrepresented” samples) was found to contain unexpected opioids)
In people’s personal quests for bodily autonomy and informed consumption, there is often evaluation of risk and consequence, but when the consequences can be severe and the risks are unknown or are intentionally exaggerated, these become difficult, if not impossible, conversations to weigh. We believe that drug checking can help provide people with the information needed to evaluate the risks, and provides harm reduction advice to minimize undesired consequences of substance use. These data are not meant to downplay concerns or invalidate past experiences. We recognize the tragic consequences of when fentanyl is found in non-opioid samples and honour the heartbreak that such experiences produce. Instead, we present these data with the intent to combat misinformation and provide an evidence-based context for people to consider when making decisions about substance use. While these numbers reflect what we have seen over the course of the project, these (roughly) 1-in-200 events still occur, so we always encourage folks to get their stuff checked.
Specifically, we are excluding samples that were expected to be “opioid-down” or samples that had an “unknown/missing” expected composition. In the case of “opioid-other” samples, e.g. hydromorphone tablets and oxycodone pills, “unexpected opioids” are defined as any opioid that is not the expected opioid. ↩︎
Opioid-Down (n=457)
In this section we present results specific to the opioid-down supply, therefore they may differ from the highlighted findings above that are inclusive of all expected drug categories.
- 89% of expected opioid-down samples contained fentanyl (405/457)
- Seven samples contained heroin (1.5% of expected opioid-down samples)
- Five mail-in samples were heroin (and related alkaloids like acetylmorphine (MAM) and acetylcodeine) with no other active compounds detected. Caffeine was found as a cut in one sample
- Two samples, both from Victoria, contained heroin with the additional actives fentanyl, fluorofentanyl, etizolam, and lidocaine detected as well
- 57% of expected opioid-down samples contained fluorofentanyl (268/457)
- Two samples contained carfentanil (0.4% of all opioid-down samples); both were checked in Victoria
- 37% of expected opioid-down samples contained a benzodiazepine and/or etizolam (169/457)
- Xylazine was detected in 4% (18/471) of opioid-down samples
In May, 66% (300/457) of all opioid-down samples checked contained an additional active to the expected fentanyl/heroin. These data are shown in Fig. 3 highlighting the prevalence of benzos, fluorofentanyl, and xylazine in the down supply.
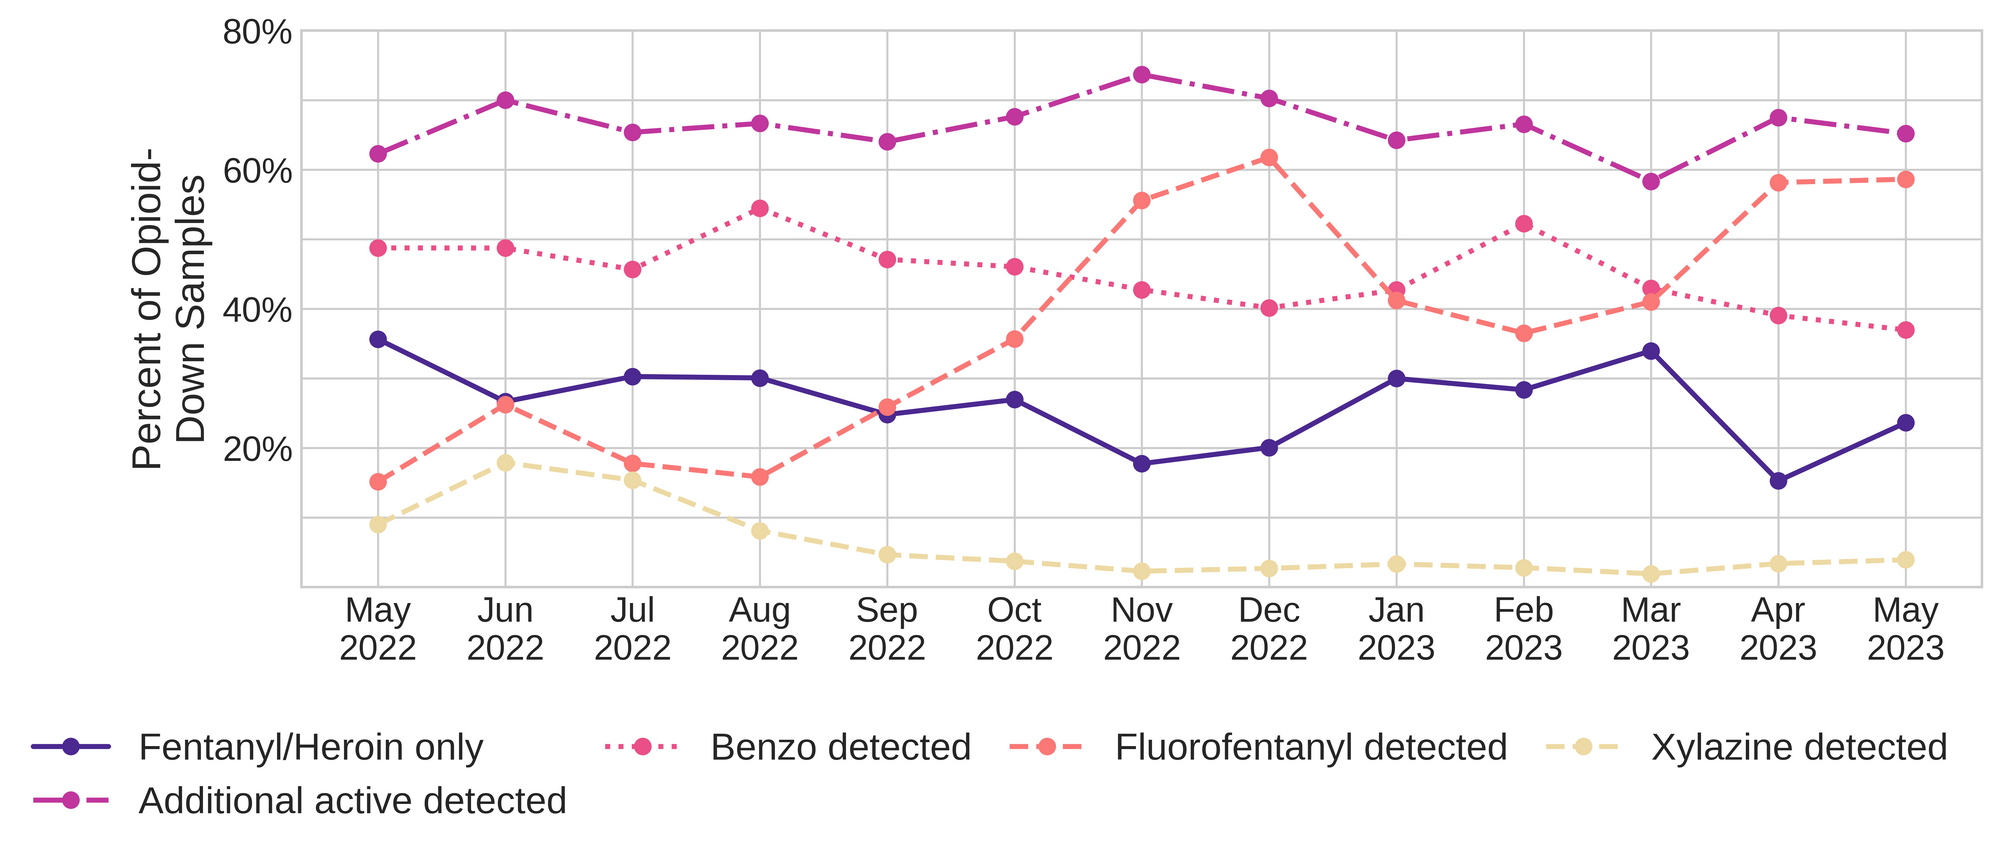
Fluorofentanyl was the most common additional active found within the opioid-down supply, with 50% (230/457) of opioid-down samples containing fluorofentanyl in addition to fentanyl. Additionally, fluorofentanyl was the only opioid detected in 8% (38/457) of opioid-down samples (i.e. no fentanyl or heroin was detected in these samples).
Benzo-related drugs contribute to a majority of the other additional actives found in expected opioid-down samples, with 37% (169/457) of expected opioid-down samples checked containing a benzo-related drug. Bromazolam continues to be the most common benzo seen in the down supply, with bromazolam being detected in 91% (154/169) of the benzo-positive opioid-down samples. Scattered detections of other drugs are still found and can be reviewed in the pdf report at the end of this blog.
Quantification for Expected Opioid-Down[1]
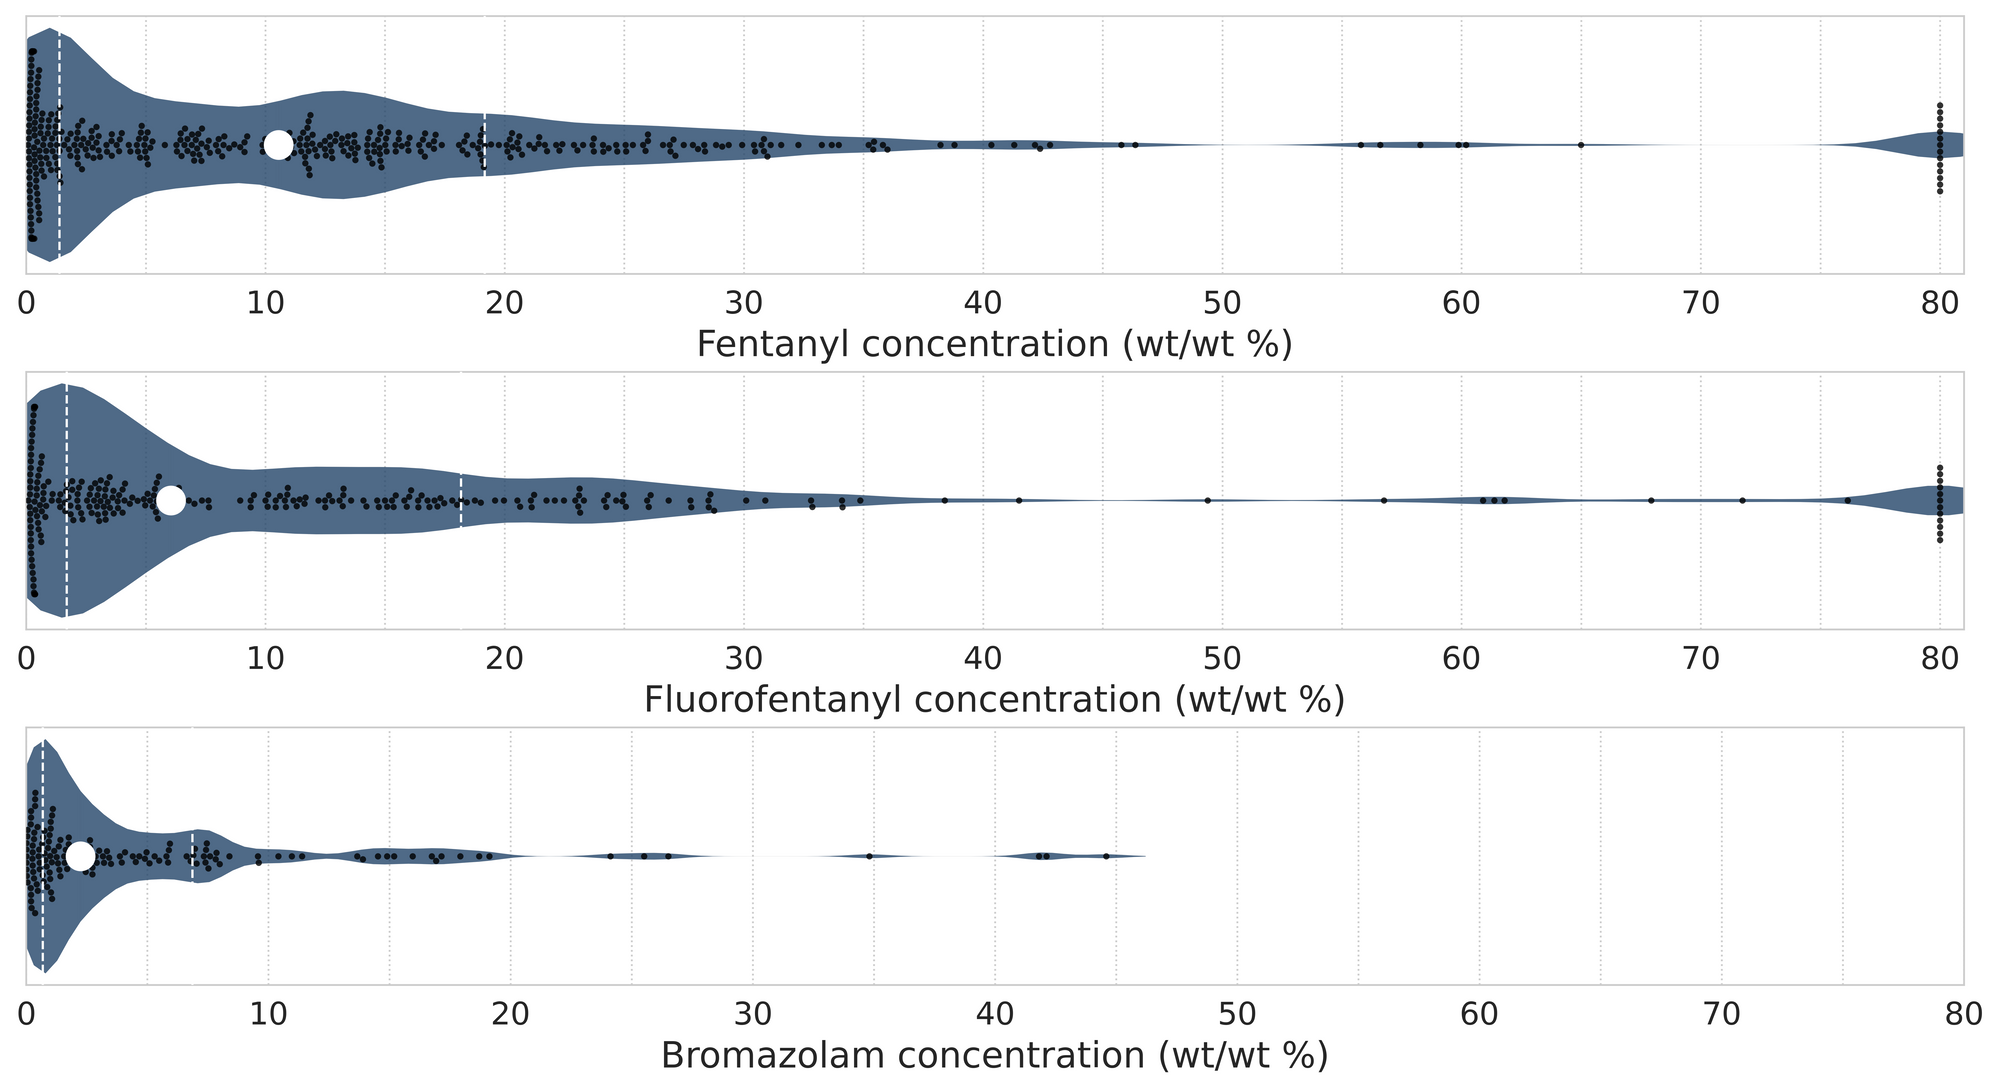
In May, we quantified fentanyl for 397 of the expected opioid-down samples containing fentanyl and found the median concentration to be 10.6%[2]. Though the median is a useful indicator, it doesn’t capture the volatility of fentanyl concentrations present in the opioid supply, as half of fentanyl-positive down samples contained between 1.4% and 19.2% fentanyl, and any one sample might be the lowest strength (0.1%) or the strongest (>80%[3]). Similarly, the concentration of bromazolam was across the board in expected opioid down samples, with samples ranging from 0.1% to 44.6% bromazolam, with a median of 2.2%.
Not all opioid down samples brought to our service can be quantified. This is primarily due to too limited sample collected for our instruments to report a reliable mass percentage. Nevertheless, qualitative detection is still possible. ↩︎
This number is specific to fentanyl quantified in opioid-down samples. The median concentration listed in the Key Findings at the beginning of this blog (10.2%) is inclusive of all samples checked, across all drug classes and unknown samples, that contained fentanyl. ↩︎
For samples that contain more than 80% fentanyl, or more than 25% etizolam by weight, our mass spectrometer is presently unable to reproducibly assign a concentration due to the upper limits of the calibration methods currently adopted. ↩︎

The fentanyl, fluorofentanyl, and bromazolam concentrations that we quantified in May, across all expected drug categories and service models, are presented in Fig. 4. Small black dots are individual opioid-down samples, the large white dot shows the median concentration, dashed white lines bound half of the quantified samples, and the width of the shaded regions mirrors the number of samples at a given concentration.
We can also examine the regional variability in the unregulated market. The table below expands on the quantitative data presented above. It focuses only on fentanyl, fluorofentanyl, carfentanil, bromazolam, and xylazine quantified within expected opioid-down samples, separated by collection location/model. Weight percentage is reported; “IQR” is the interquartile range: the range that contains half of the quantified samples.

Want to be notified when we release these reports? Join our mailing list to receive updates about when our reports are out. You can subscribe and unsubscribe yourself from this list at any time.
As always, send us feedback at substance@uvic.ca on how we can continue to offer our drug checking results in a useful way.