February 2022 Monthly Report

In this blog post we discuss our February 2022 report and provide more information on how to interpret the results. The PDF report can be found at the end.
Key findings:
- Carfentanil was found in four samples, all expected opioid-down
- The maximum concentration of carfentanil found was 0.95%, the highest concentration we have seen to date
- 90% of expected opioid-down samples contained fentanyl
- The median fentanyl concentration found across all expected drug categories was 8.8%, with a maximum of over 80%
- Benzodiazepines and/or etizolam were found in 58.0% of expected opioid-down samples
- The maximum concentration of etizolam found was >25%, in an expected opioid-down sample
Insight for the February 2022 Monthly Report
Maybe it was the DMT dust drifting around our service, distorting time and allowing us to float through samples like the fourth-dimensional-Diptera-drug-checking-entities that we are (literal Time Flies), or maybe simply time flies when we are having fun checking drugs, but either way February was fast and full with a record number of samples checked (326).
A majority of the samples that we checked were brought in to our Victoria storefront by service users, however we also collect and receive samples though various outreach efforts as a means to facilitate community engagement, to increase the accessibility of drug checking services, and to expand the reach of interventions beyond individuals to reduce risks within the unregulated market.
This month, we breakdown our sample counts into two categories:
- samples received through direct service provision, where service users are bringing samples into our storefront. These samples are labelled as “Substance” samples in the figures/tables of this blog post.
- samples received through indirect service provision, where samples are being collected through no contact drop-off envelopes, mail-in envelopes, or are being collected by harm reduction workers and/or other community members at supported housing sites, at overdose prevention sites, and supervised consumption locations. These samples are labelled as “Outreach” samples in the figures/tables herein.
Drug types
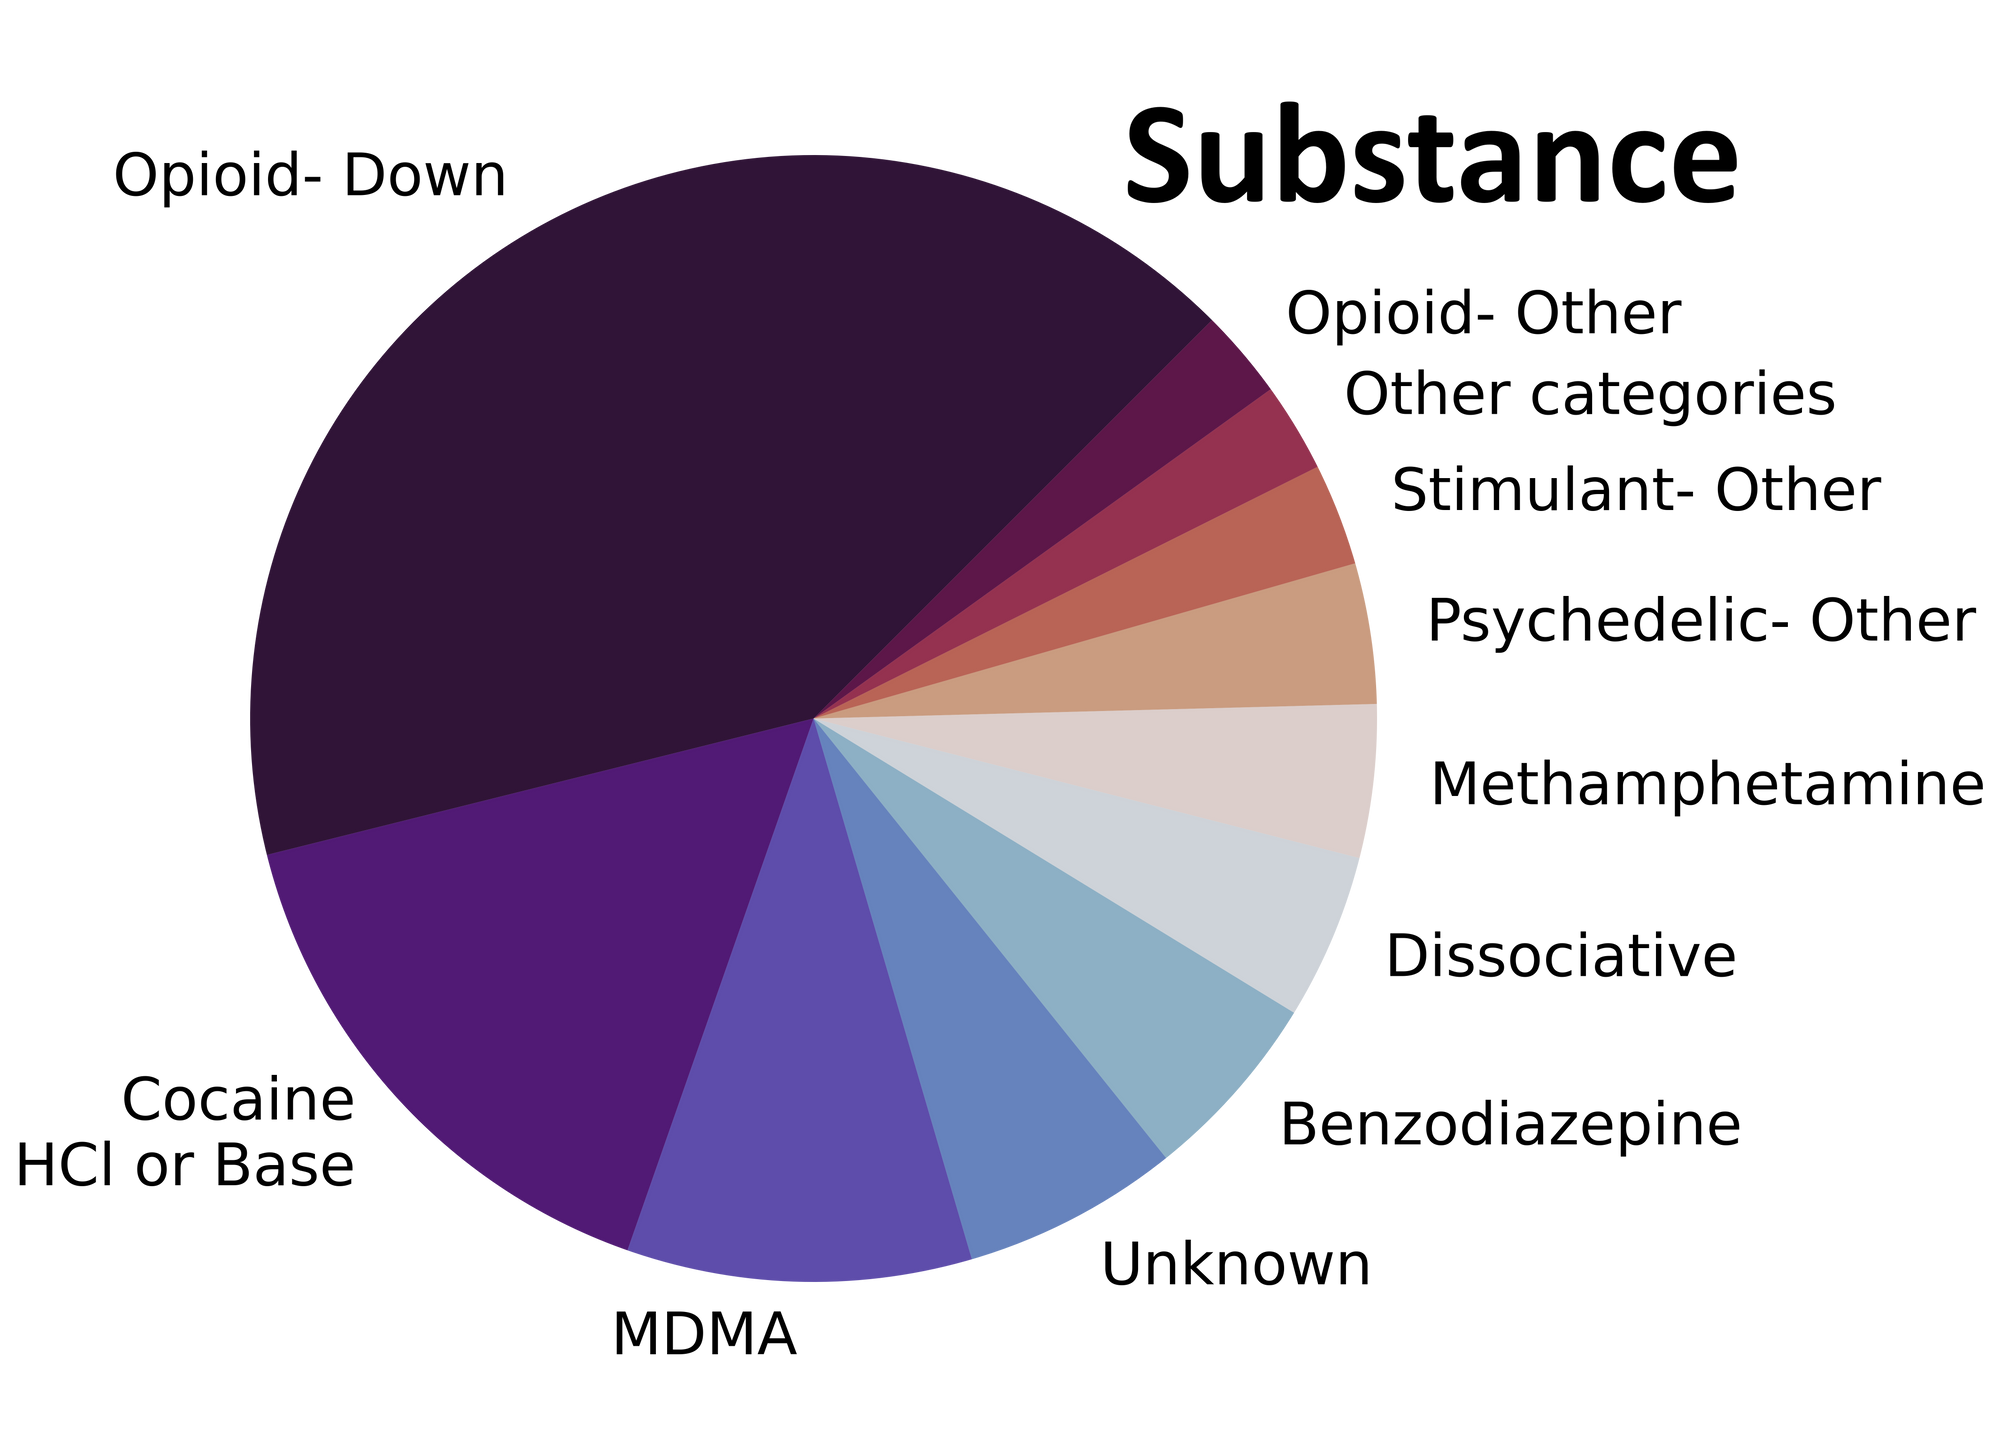
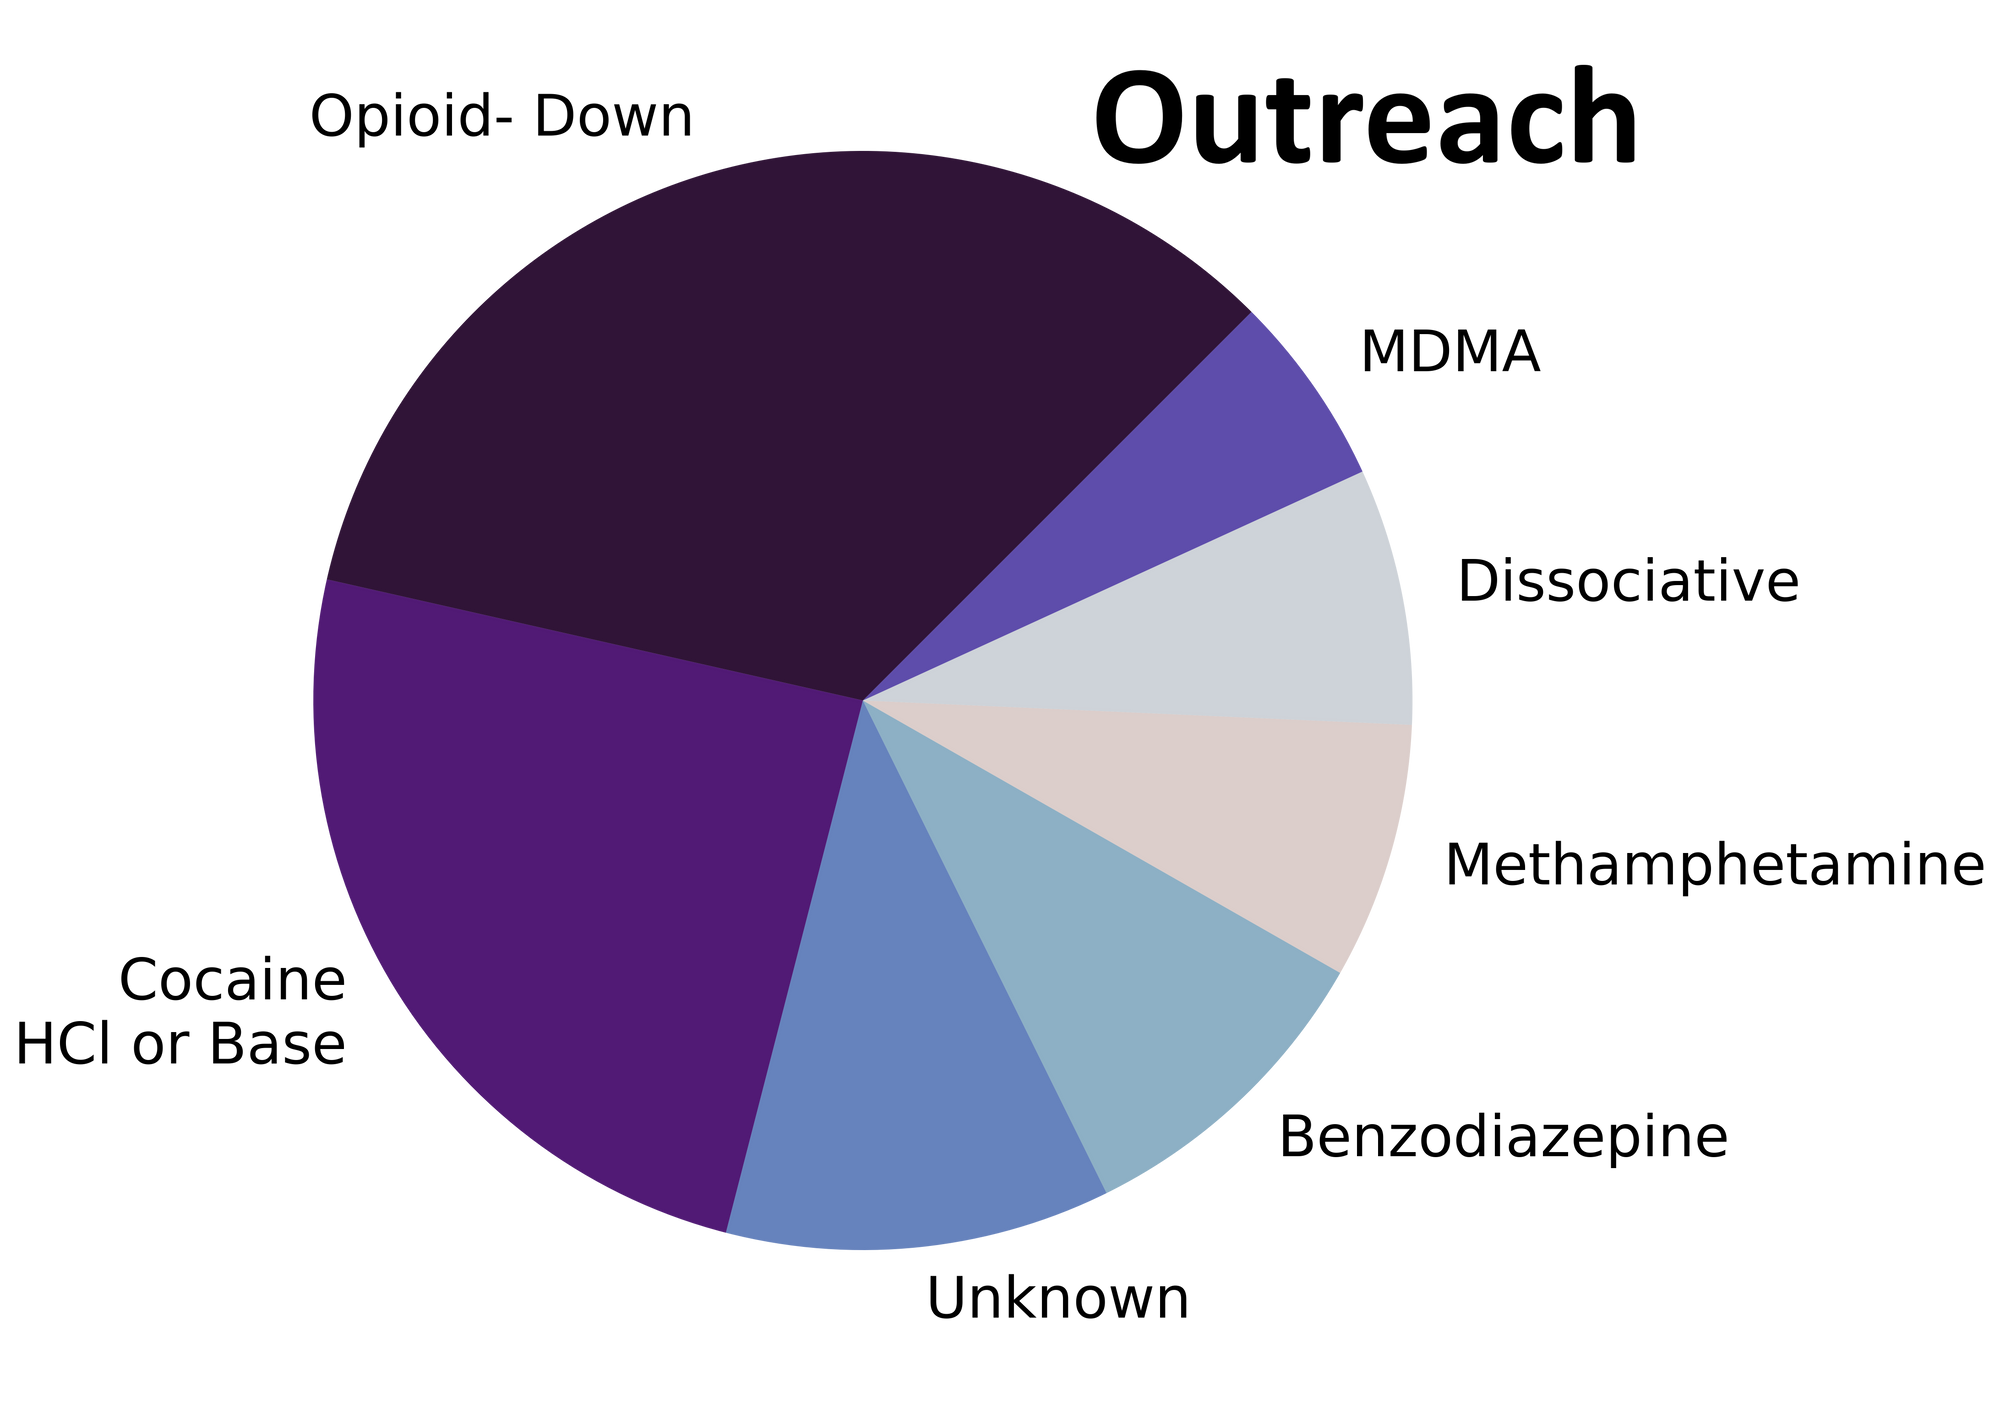
From fusions of fentanyl and flualprazolam to flecks of 3-FPM, flocks of fascinating compounds found their way to our storefront in February. Fig. 1 shows the prevalence of each expected drug category checked, split by sample collection location/method.

Fillers found in February
For a majority of samples checked, we confirm that the expected drug was indeed the only active and that no additional active compounds were present. The bar charts below highlight a few classes of drugs, differentiating samples when only the expected active was found from situations when other unexpected components were detected.
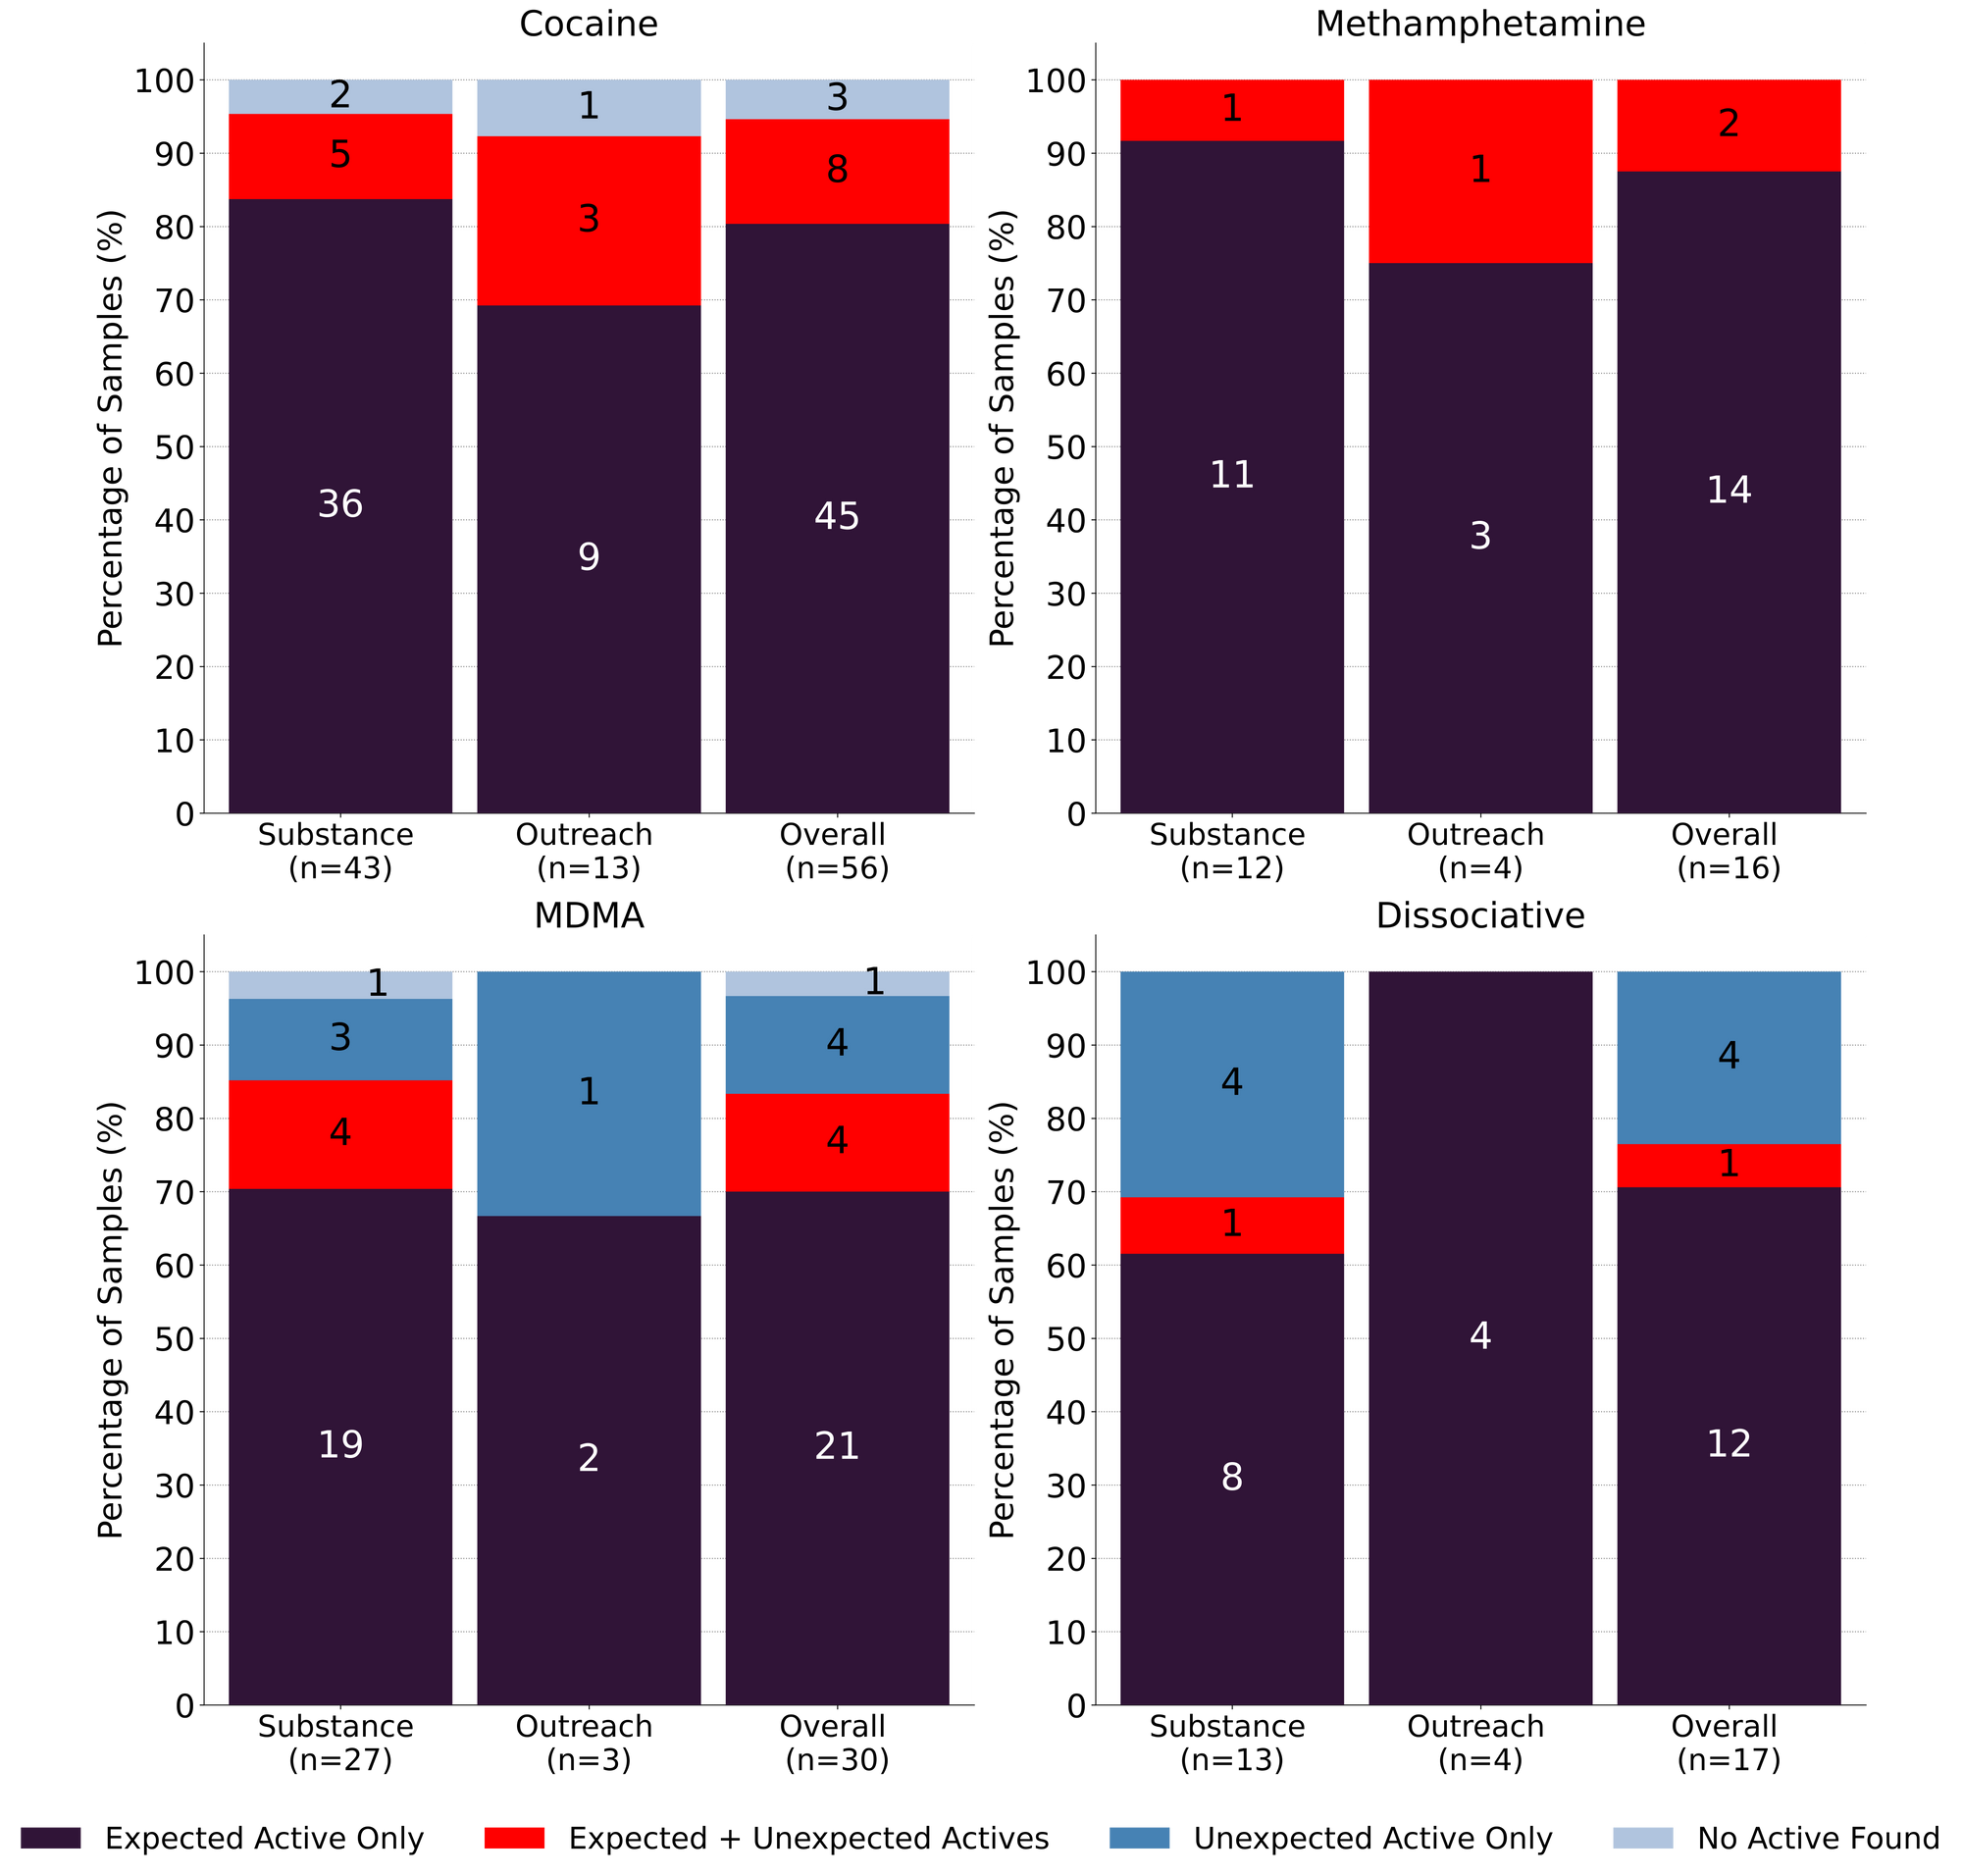
56 expected cocaine samples were checked in February. 80% (45/56) were found to only contain cocaine (or cocaine base) as a single ingredient. 8 samples contained an active component in addition to cocaine, with the additional actives representing a suite of different drug categories:
- Levamisole - 4 samples; an antihelminthic drug used to treat parasitic worm infections, commonly seen as a cut in cocaine
- Phenacetin - 2 samples; an acetaminophen (Tylenol)-like drug, colloquially referred to as “superbuff”
- Procaine - 2 samples; a local anaesthetic
- Both samples also contained levamisole
- Benzocaine - 1 samples; a topical local anaesthetic
- 2C-H - 1 sample, a lesser-known phenethylamine that lacks the psychedelic properties typically associated with other 2C-x drugs
The remaining 3 expected cocaine samples checked in February did not contain cocaine or any other active compounds.
16 expected methamphetamine samples were checked in February and 14 were found to be meth as a single component, no cuts or adulterants detected. The remaining two samples, however, contained an additional active alongside the expected methamphetamine:
- Methamphetamine + 5% cocaine
- Methamphetamine + 0.8% fentanyl and caffeine
- The presence of fentanyl was confirmed with the PS-MS in two independently analysed sections/”chunks” of the sample. When fentanyl is detected at such low levels, we often suspect cross-contamination, either on our end or the service user’s, however these are purely speculative assessments.
While meth is often just meth, these rare detections of additional actives remind us of the benefits of regular drug checking, and the value of a safe supply for all drugs.
15 samples were expected to be ketamine and 73% (11/15) were found to be ketamine as single component. One sample contained both ketamine and MDA (at 3% concentration), while the remaining three samples contained no ketamine and were found to contain other active drugs:
- MDMA - 1 sample
- MDMA + isopropylbenzylamine - 1 sample (see Spotlight Sample 1 in last month’s blog post)
- Amphetamine + Cocaine - 1 sample
Though ketamine reigned supreme as the director of the dissociative class, some newcomers sought to dethrone ketamine for the title of Dissociative Dignitary. An expected DMXE sample (deoxymethoxetamine, a novel dissociative closely related to ketamine and MXE) was found to indeed be DMXE, while an expected O-PCE sample (another novel dissociative) was found to just be ketamine.
MDMA and MDA remained inseparable lovebirds in February. 69% (18/26) of expected MDMA samples checked were confirmed to just be MDMA. Within the remaining eight expected MDMA samples:
- 4 samples were found to be both MDMA and MDA
- 3 samples were found to just be MDA
- 1 samples contained no active drugs (just an undifferentiated carbohydrate)
Similarly, 75% (3/4) of expected MDA samples checked were confirmed to just be MDA, while the remaining sample was instead just MDMA.
Benzodiazepines (n=20)
A majority of the benzodiazepines checked in February came to our service in the form of pressed pills, though four samples came in as powders; all were expected to be alprazolam (Xanax). 20% (4/20) of these samples were confirmed to be alprazolam, while the remaining 80% (16/20) were found to contain a different benzo or benzo-related drug:
- Flualprazolam - 3 samples, all pressed pills
- Diazepam (Valium) - 1 sample, a pressed pill
- Undifferentiated benzo (positive benzo strip test, but not a benzo we could identify on our instruments) - 1 sample, a pressed pill
- Etizolam - 11 samples, 7 pressed pills and 4 powder samples
- All four powder samples contained fentanyl, in addition to etizolam:
- 1 sample was high concentration etizolam with ~1% fentanyl and ~1% fluorofentanyl additionally detected
- 2 samples were ~65% benzocaine, ~34% caffeine, 0.5% etizolam, and 0.3% fentanyl
- 1 sample appeared to be a misrepresented down sample containing 12% fentanyl, 24% etizolam, and caffeine + mannitol as cutting agents
- All four powder samples contained fentanyl, in addition to etizolam:
As benzos continue to be inextricably entwined with the opioid-down supply, unfortunately it does not come as a surprise to find opioids in expected benzodiazepine samples. With that said, we have yet to find fentanyl in any pressed pills expected to be benzos, and as we have reported before, these results were not unexpected to the majority of the service users who brought in these samples.
Opioid-Down (n=131)
In this section we present results specific to the opioid-down supply, therefore they may differ from the highlighted findings above that are inclusive of all expected drug categories.
- 90% of expected opioid-down samples contained fentanyl (118/131)
- Heroin was the primary active found in 10 samples, with a median concentration over 80%
- Fentanyl was additionally detected in 6 of these samples, with concentrations ranging from 0.1% to 11%
- Four samples contained carfentanil in the month of February
- Two of these samples contained the highest concentrations of carfentanil that we have seen to date: 0.79% and 0.95%. Both samples additionally contained flualprazolam, a benzodiazepine, at concentrations around 1%.
- 58% of expected opioid-down samples contained a benzo and/or etizolam (76/131)
- Xylazine was detected in 2 opioid-down samples, with concentrations of 6.9% and 17.5%
This February, 73% of all opioid-down samples checked contained an additional active to the expected fentanyl and/or heroin. Examining the past year of data (Fig. 3), we can see this level of adulteration is consistent within the inconsistent down supply.
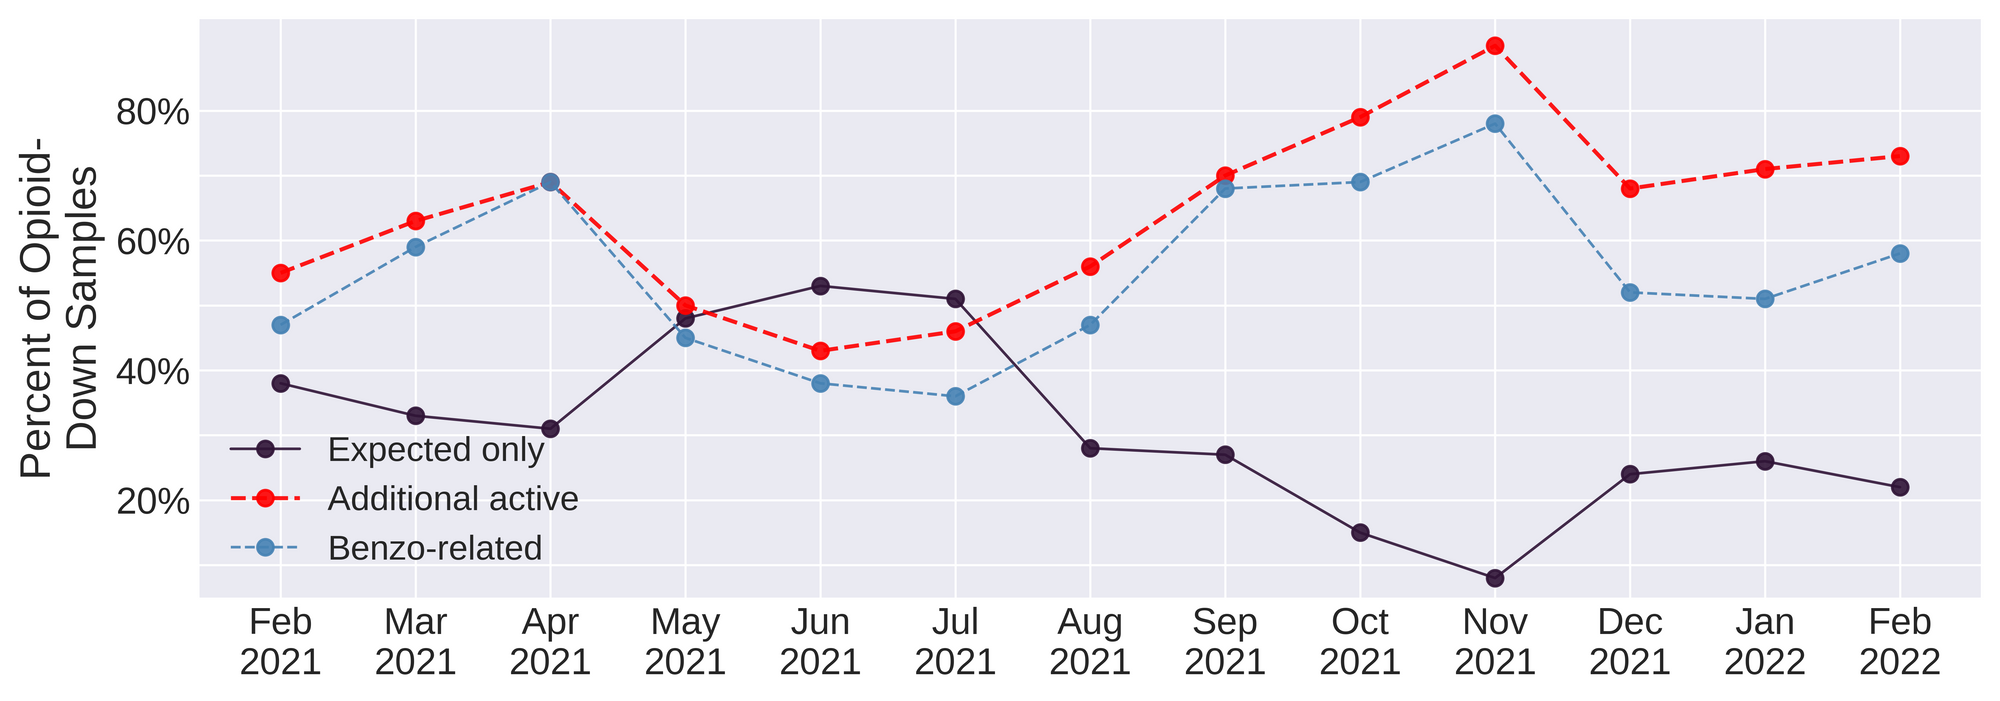
Benzo-related drugs remain the primary contributor to the additional actives found in expected opioid-down samples with (76/131) of the total expected opioid-down samples checked containing a benzo-related drug.
Month after month, we report on adulteration stats and dissect individual samples to demonstrate the complications that can arise in an unregulated market, and month after month we repeat the same message: it is long past time we listen to the people who use drugs who have been pointing to remedies to these challenges: safer supply of all drugs and decriminalization are effective interventions in the unregulated market.
Quantification for Expected Opioid-Down[1]
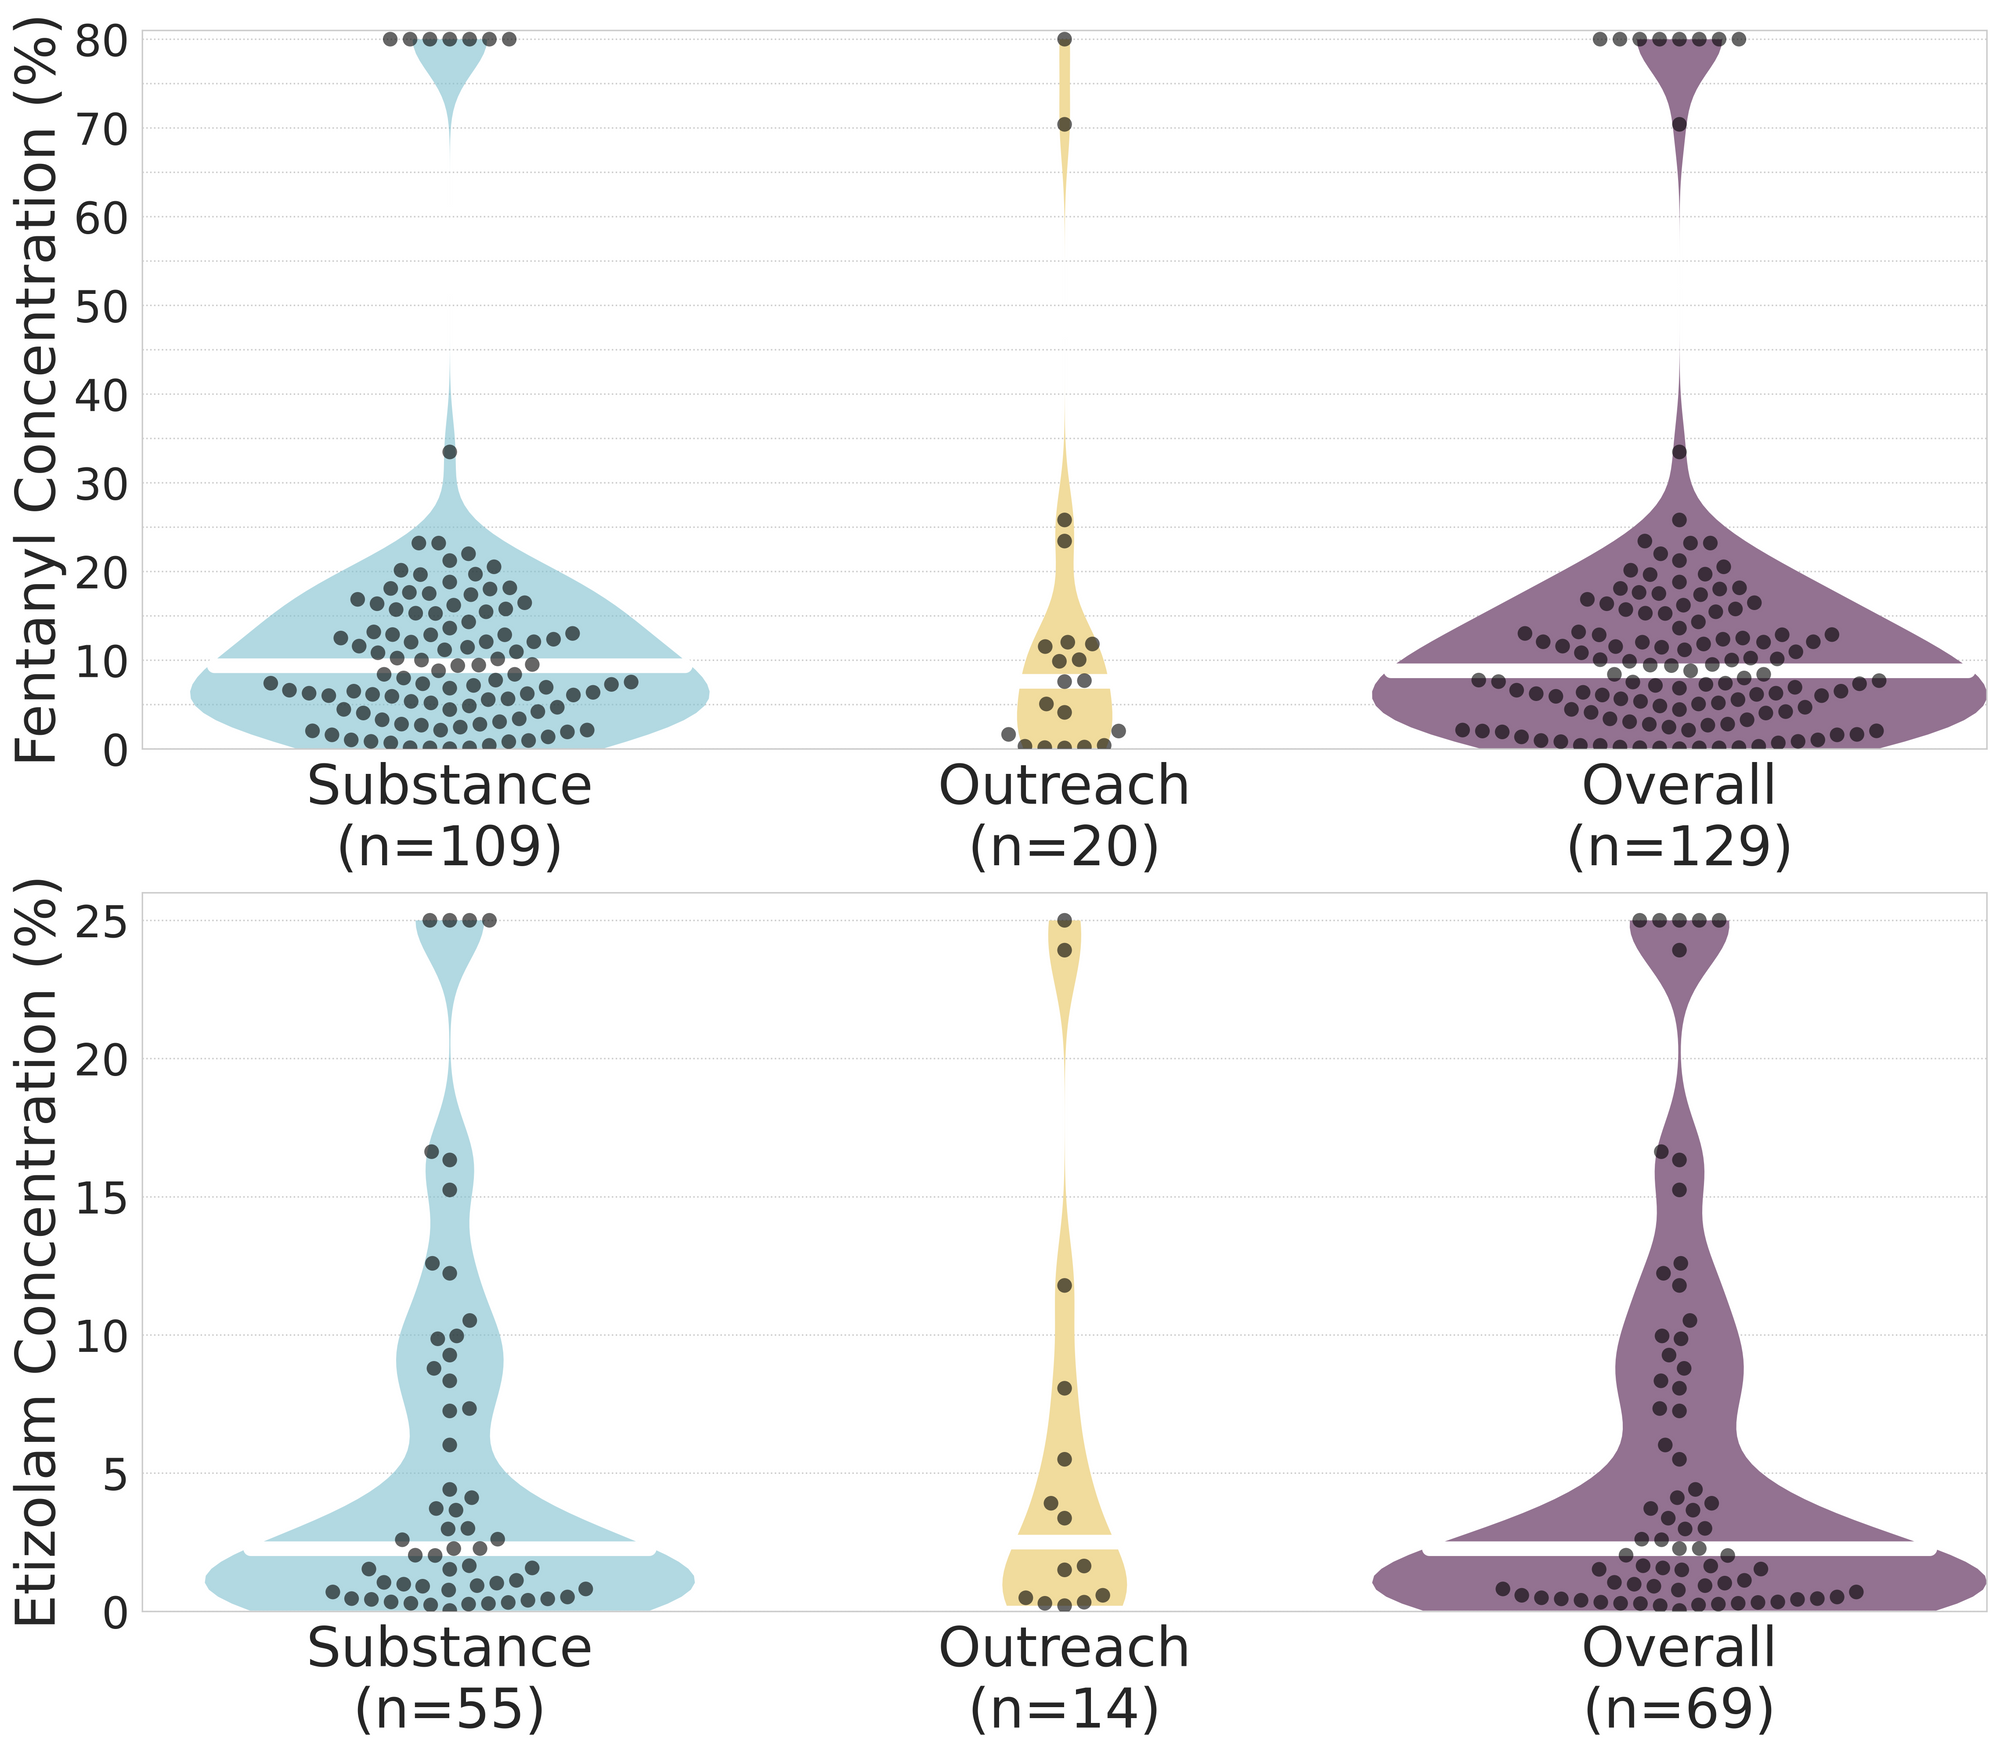
In February, we quantified fentanyl for 116 of the expected opioid-down samples containing fentanyl and found the median concentration to be 9.7% with the average strength of fentanyl we normally see being around 10%. Though the median is a useful indicator, it doesn’t capture the volatility of fentanyl concentrations present in the opioid supply, as any one sample might be the lowest strength (0.1%) or the strongest (>80%[2]). Similarly, the concentration of etizolam was across the board in expected opioid down samples, ranging from 0.1% to >25%[2:1], with a median of 3.0%.
Not all opioid down samples brought to our service can be quantified. This is primarily due to too limited sample collected for our instruments to report a reliable mass percentage. Nevertheless, qualitative detection is still possible. ↩︎
For samples that contain more than 80% fenanyl, or more than 25% etizolam by weight, our mass spectrometer is presently unable to reproducibly assign a concentration due to the upper limits of the calibration methods currently adopted. ↩︎ ↩︎

The fentanyl and etizolam concentrations that we quantified in down samples checked in February are presented in Fig. 4. Black dots are individual opioid-down samples, horizontal white bars show the median concentrations of fentanyl and etizolam quantified, the width of the shaded regions mirrors the number of samples at a given concentration.
Want to be notified when we release these reports? Join our mailing list to receive updates about when our reports are out. You can subscribe and unsubscribe yourself from this list at any time.
Check back next month for the March report!
As always, send us feedback at substance@uvic.ca for how we can continue to offer our drug checking results in a useful way.