December 2022 Monthly Report

In this blog post we discuss our December 2022 report and provide more information on how to interpret the results. The PDF report can be found at the end.
Key findings:
- The median fentanyl concentration found, across all expected drug categories, was 8.8%, with a maximum of over 80%
- Carfentanil was found in 1 expected opioid-down sample, at a concentration of 0.08%
- Benzodiazepines and/or etizolam were found in 40% (104/259) of expected opioid-down samples
- The median concentration of bromazolam, the most common benzodiazepine found across all expected drug categories, was 2.7%, with a maximum of over 80%
- Xylazine was found in 7 expected opioid-down samples, with a median concentration of 2.6% and a maximum concentration of 10.7%
Insight for the December 2022 Monthly Report
This blog, and the associated pdf report, breakdown our sample counts into six categories:
-
samples received through direct service provision in Victoria, where service users are bringing samples into the Substance storefront. These samples are labelled as “Substance” samples in the figures/tables of this blog post
-
samples received through direct service provision in Campbell River, where service users are bringing samples to the Vancouver Island Mental Health Society (VIHMS). These samples are labelled as “Campbell River”.
-
samples received through direct service provision in the Comox Valley, where service users are bringing samples to AVI Health & Community Services in Courtenay, BC. These samples are labelled as “Comox Valley”.
-
samples received through direct service provision in the Cowichan Valley, where service users are bringing samples to the Duncan Lookout Society OPS in Duncan, BC. These samples are labelled as “Duncan”.
-
samples received through direct service provision in Port Alberni, where service users are bringing samples into Port Alberni Shelter Society’s OPS. These samples are labelled as “Port Alberni”.
-
samples received through indirect service provision, where samples are being collected through no contact drop-off envelopes, mail-in envelopes, or are being collected by harm reduction workers and/or other community members at supported housing sites, at overdose prevention sites, and supervised consumption locations. These samples are labelled as “Outreach” samples in the figures/tables herein.
Drug types
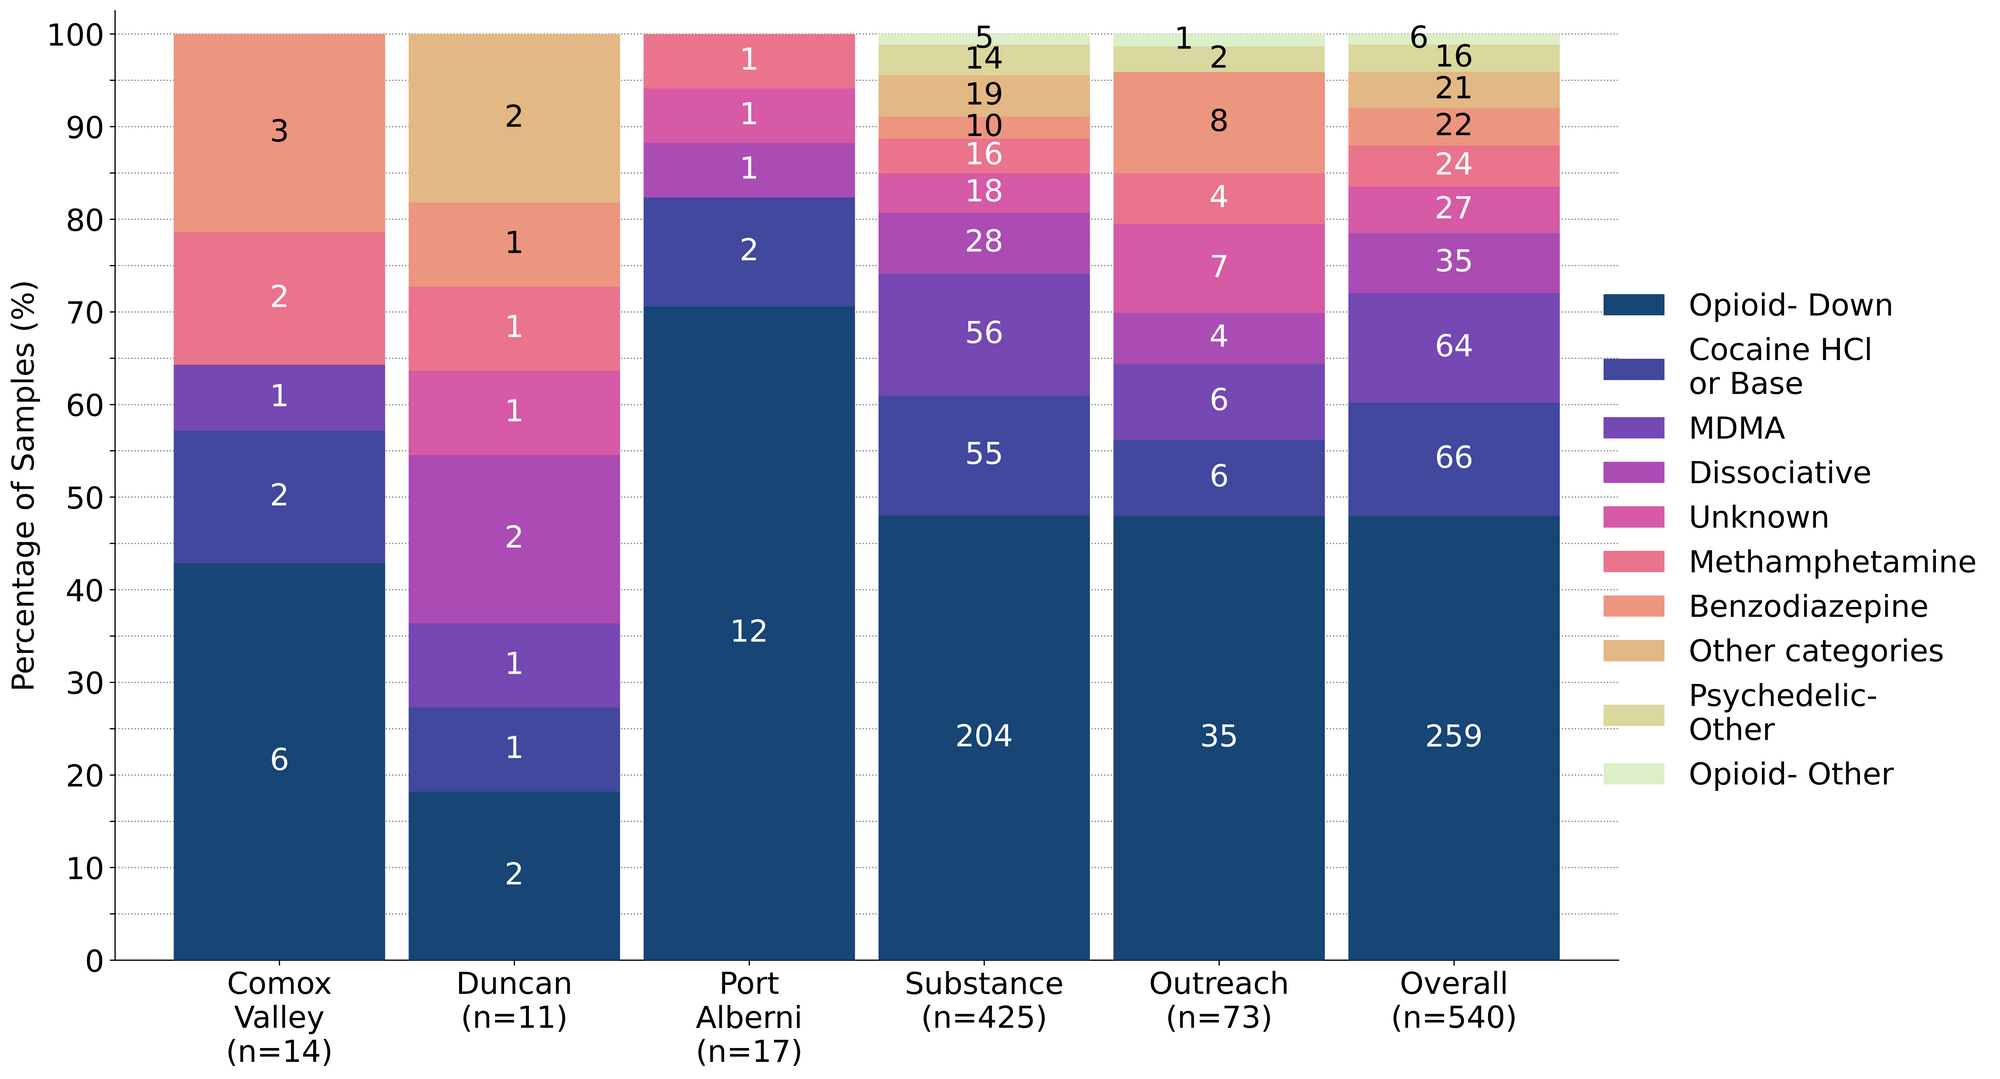
From diazepam to DMT dimethyl sulfone, December’s display of drugs drew from a diversity of drug classes. Fig. 1 shows the prevalence of each expected drug category checked, split by sample collection location/method.

Debunking dubious declarations about deceitful drugs in December
For a majority of samples checked, we confirm that the expected drug was indeed the only active and that no additional active compounds were present. The bar charts below highlight a few classes of drugs, differentiating samples when only the expected active was found from situations when other unexpected active components were detected.
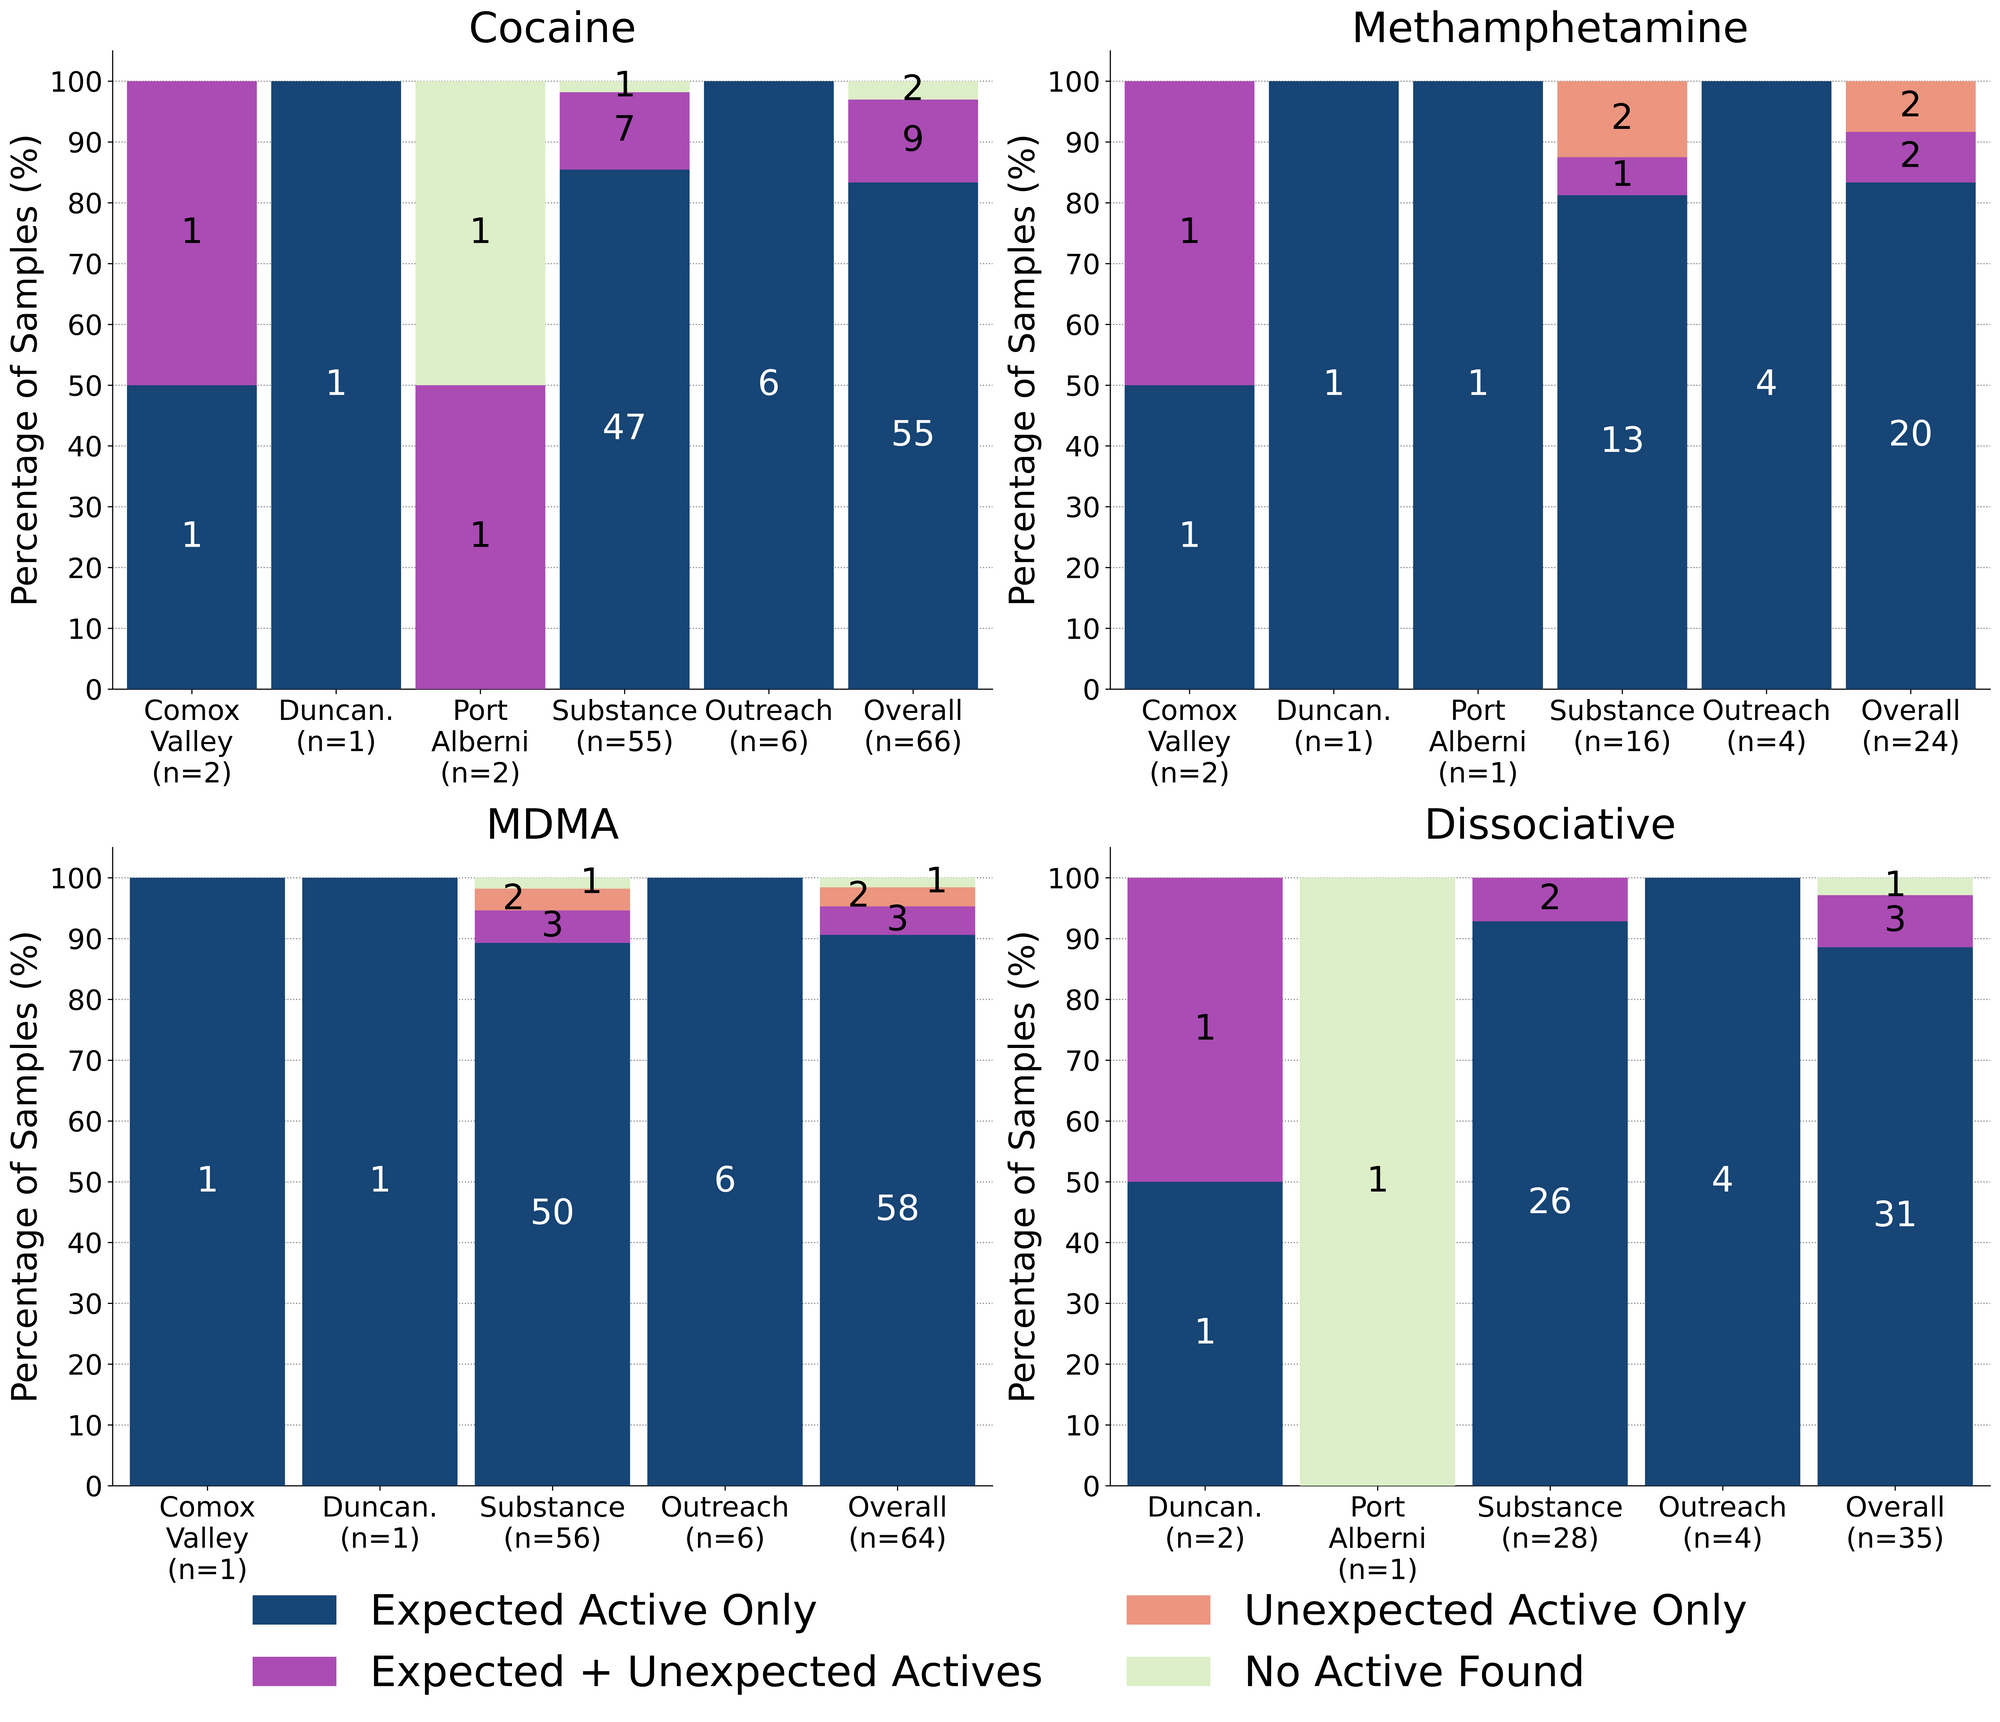
91% (58/64) of expected MDA/MDMA samples checked were confirmed to be MDA (3 samples) and MDMA (55 samples), as expected. Tracking inactive cuts, one MDMA sample was cut with caffeine and another MDMA sample was cut with dimethyl sulfone (MSM); both of these samples were checked in Victoria. The remaining six expected MDA/MDMA samples displayed a range of compositions:
- One expected MDMA sample from Victoria was found to be MDA instead
- Two samples from Victoria, one expected MDA and one expected MDMA, were found to be mixtures of both MDA and MDMA
- One expected MDMA sample from Victoria contained MDMA and 13% cocaine
- One expected MDMA sample from Victoria was found to just be ketamine
- One expected MDMA sample from Victoria contained no active drugs and was just magnesium sulfate (Epsom salt)
89% (31/35) of expected ketamine samples checked were confirmed to be ketamine with no other cuts or active compounds detected. Three of the remaining samples were found to contain ketamine cut with phenacetin (a tylenol-like drug, also known as “super-buff” in the context of cuts found within cocaine samples). Two of these samples were checked in Victoria, while the other was collected in Duncan. One sample checking in Port Alberni contained no ketamine and was instead found to be monosodium glutamate (MSG).
83% (20/24) of expected methamphetamine samples checked in December were found to be meth with no other active compounds or cuts detected. Active compounds were detected in the remaining four samples:
- One sample from Victoria contained MDMA instead of meth
- One liquid sample from Victoria was a lidocaine + water solution, rather than a meth shot
- Two samples, one from Victoria and one from the Comox Valley, were found to contain meth with trace amounts of fentanyl detected as well. In both cases, fentanyl was only detected via fentanyl immunoassay strip test, with no evidence for fentanyl found with mass spectrometry. While fentanyl strip tests are known to produce false positives when checking meth samples, if the concentration of meth in solution is too high, multiple strips were run for both samples, over an increasingly dilute concentration series, and all strips were positive for fentanyl. In the case of the sample from Victoria, this sample was brought in alongside a baggie of “raw”/uncut fentanyl that was also being checked; we suspect trace cross-contamination occurred during sample transport.
83% (55/66) of expected cocaine samples checked were confirmed to be cocaine with no active adulterants detected. Only one of these samples was found to be cut, with sodium bicarbonate (baking soda) detected at 25% in a cocaine base sample from Victoria. 9 samples contained an active component in addition to cocaine:
- Benzocaine - 1 sample (Victoria); a local anaesthetic/numbing agent
- Fentanyl - 1 sample (Victoria); this sample contained around 14% fentanyl and 10% cocaine base, cut with caffeine
- Levamisole - 5 samples (all Victoria); an antihelminthic drug used to treat parasitic worm infections, commonly seen as a cut in cocaine
- Phenacetin - 2 samples (Comox Valley and Port Alberni); “super buff” a tylenol-like drug, commonly seen as a cut in cocaine
The remaining 2 expected cocaine samples did not contain cocaine or any other active compounds. One sample from Port Alberni was just sodium bicarbonate and a sample from Victoria was salt.
Benzodiazepines (n=22)
77% (17/22) of the benzodiazepine samples checked in December came to our service sites in the form of pressed pills; four of the remaining samples were powders and one sample was a clear liquid. 15 of the 17 pills were expected to be alprazolam (Xanax) and two were expected to be diazepam/Valium. One expected diazepam pill was confirmed to be diazepam, while the other was found to be temazepam/Restoril instead. 4 of the 15 expected alprazolam/Xanax tablets were confirmed to contain alprazolam. The 11 other pressed pills were found to contain a benzo or benzo-related drug other than/in addition to alprazolam:
- Bromazolam - 1 sample. Bromazolam is comparable in both strength and duration to alprazolam. This sample also contained alprazolam.
- Flualprazolam - 8 samples. Flualprazolam is ~2x stronger than alprazolam in terms of dosage but has a similar duration of effect (5-8 hours)
- Etizolam - 1 sample. Etizolam is ~2x weaker than alprazolam in terms of dosage but has a similar duration of effect (5-8 hours)
- Unknown benzodiazepine - 1 sample. This sample tested positive for benzos via immunoassay strip test, but we were unable to identify which benzo was present
Within the four powder samples:
- Two samples from Victoria were confirmed to be bromazolam powder, as expected
- Two samples from Victoria were found to primarily be high concentration fentanyl (>80%) with etizolam detected at around 25% and lidocaine detected at 2%
The liquid sample was found to contain diazepam/Valium, as expected.
Opioid-Down (n=259)
In this section we present results specific to the opioid-down supply, therefore they may differ from the highlighted findings above that are inclusive of all expected drug categories.
- 88% of expected opioid-down samples contained fentanyl (229/259)
- 8 samples contained heroin (3% of expected opioid-down samples), with a median concentration >80% and a range of 23.5% to >80%:
- 5 samples were just heroin (and related alkaloids like acetylmorphine (MAM) and acetylcodeine). Four were checked inVictoria and one was checked in Duncan
- 3 samples additionally contained fentanyl ranging from 15% to 60%.
- Etizolam was detected in two of these samples, one at 11% and another at 23%
- 1 sample contained carfentanil, with a concentration of 0.08%
- 40% of expected opioid-down samples contained a benzodiazepine and/or etizolam (104/259)
- Xylazine was detected in 3% (7/259) of opioid-down samples, with a median concentration of 2.6% and a range of 0.1% to 10.7%
In December, 70% (182/259) of all opioid-down samples checked contained an additional active to the expected fentanyl/heroin. The adulteration data is shown in Fig. 3 highlighting the prevalence of benzos, fluorofentanyl, and xylazine in the down supply
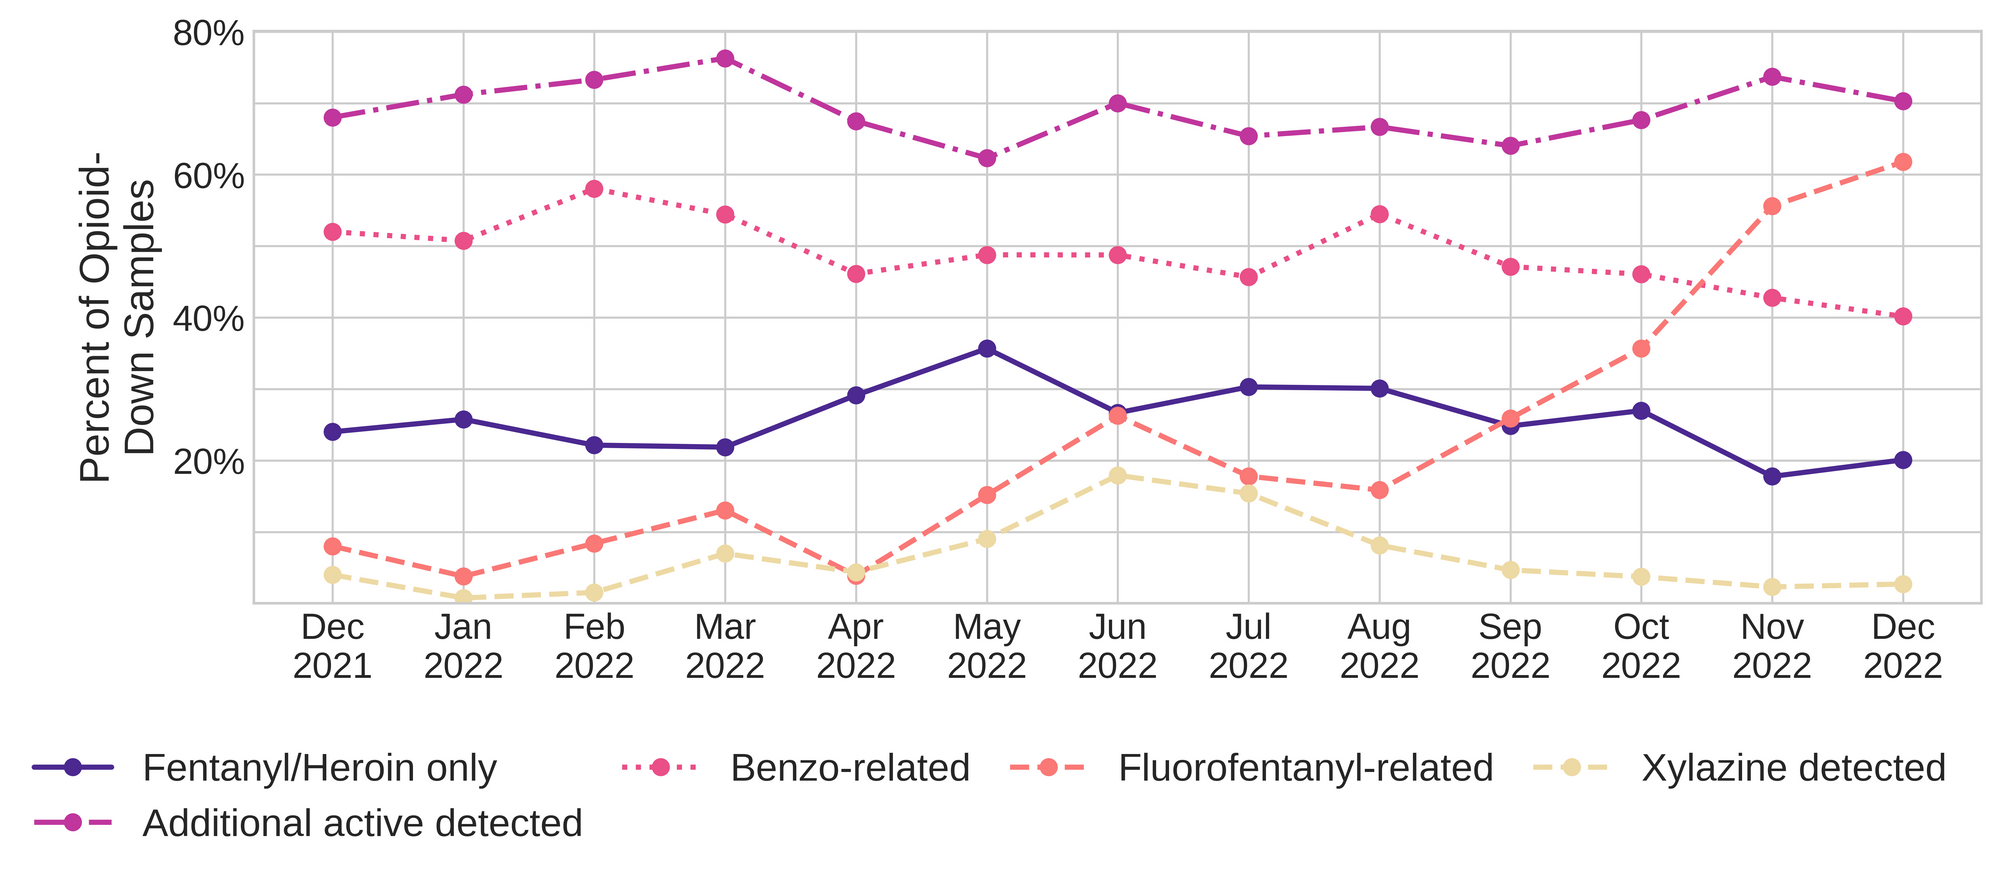
Fluorofentanyl was the most common additional active found within the opioid-down supply, with 53% (137/259) of opioid-down samples containing fluorofentanyl in addition to fentanyl. This level of adulteration continues the trend that we have been observing over the past few months. Additionally, fluorofentanyl was the only opioid detected in 9% (23/259) of opioid-down samples (i.e. no fentanyl or heroin was detected in these samples).
Benzo-related drugs contribute to a majority of the other additional actives found in expected opioid-down samples, with 40% (104/259) of expected opioid-down samples checked containing a benzo-related drug. Bromazolam continues to be the most common benzo seen in the down supply, with bromazolam being detected in 75% of the benzo positive opioid-down samples. Scattered detections of other drugs are still found and can be reviewed in the pdf report at the end of this blog.
Quantification for Expected Opioid-Down[1]
In December, we quantified fentanyl for 222 of the expected opioid-down samples containing fentanyl and found the median concentration to be 8.2%[2]. Though the median is a useful indicator, it doesn’t capture the volatility of fentanyl concentrations present in the opioid supply, as 50% of fentanyl positive down samples contained between 1.7% and 16.5% fentanyl, and any one sample might be the lowest strength (0.1%) or the strongest (>80%[3]). Similarly, the concentration of bromazolam was across the board in expected opioid down samples, with samples ranging from 0.1% to 25.3% bromazolam, with a median of 2.6%.
Not all opioid down samples brought to our service can be quantified. This is primarily due to too limited sample collected for our instruments to report a reliable mass percentage. Nevertheless, qualitative detection is still possible. ↩︎
This number is specific to fentanyl quantified in opioid-down samples. The median concentration listed in the Key Findings at the beginning of this blog (8.8%) is inclusive of all samples checked, across all drug classes, that contained fentanyl. ↩︎
For samples that contain more than 80% fentanyl, or more than 25% etizolam by weight, our mass spectrometer is presently unable to reproducibly assign a concentration due to the upper limits of the calibration methods currently adopted. ↩︎

Something that we have been following at Substance is the possibility that the fentanyl concentration in opioid-down samples is related to the presence of other additional opioids in the supply. Over the past few months, we have observed a gradual dip in the median fentanyl concentration in opioid-down samples, with the median fentanyl concentration dropping from 14.0% in October to 10.9% in November to its current value. During this time we have also observed an increase in the prevalence of fluorofentanyl in opioid-down samples, and an increase in the median concentration of fluorofentanyl, with the median concentration of fluorofentanyl increasing from 3.3% in October to 7.0% in December.
If we look at the 137 opioid-down samples that contained both fentanyl and fluorofentanyl, the median fentanyl concentration was 4.1% and the median fluorofentanyl concentration was 6.7%. In November we discussed the challenges with reporting a fentanyl equivalency for fluorofentanyl, given the limited data available in the literature and the difficulty in differentiating the structural isomers of fluorofentanyl. With all the caveats, cautions, asterisks, footnotes, “ackchually’s”, and disapproving remarks from the neuropharmacologists in mind, if we maintain that fluorofentanyl is somewhere between 0.2x and 2x the strength of fentanyl[1,2], and we assume that scaled concentrations are additive when both fentanyl and fluorofentanyl are present in the same sample, then an approximate fentanyl equivalency for these samples is somewhere between 5% and 18% “fentanyl equivalent”, with a conservative average around 11-12%. This estimate is very close to the median fentanyl concentration seen across all fentanyl-positive opioid-down samples that we have quantified since the beginning of our project (11.1%).
Similarly, we could compare the median concentration of fentanyl in opioid-down samples that only contained fentanyl and no other actives (16.4%) to the median concentration of fluorofentanyl in opioid-down samples that only contained fluorofentanyl and no other actives (12.5%). Following the same assertions above, the median fentanyl equivalency for the samples that only contained fluorofentanyl is somewhere between 3% and 25%, with an approximate average around 14%. Despite December’s dip in the median fentanyl concentration observed across all fentanyl positive opioid-down samples, the high prevalence of fluorofentanyl certainly pushes the median “fentanyl equivalent” concentration back up to “nominal” levels.
We like saying the down supply is “consistently inconsistent” and this little exercise in equivalencies furthers that remark. Flip a coin, roll some dice, draw a straw, and shake a magic 8 ball to determine the composition of your next down sample - while the outcome may be totally fucked for any given sample, rest unassured that until accessible safer supply can provide you with the exact drug and dosage of choice if you gamble enough, on average…err…on median(?)...your sample will contain around 11ish% fentanyl-ish.
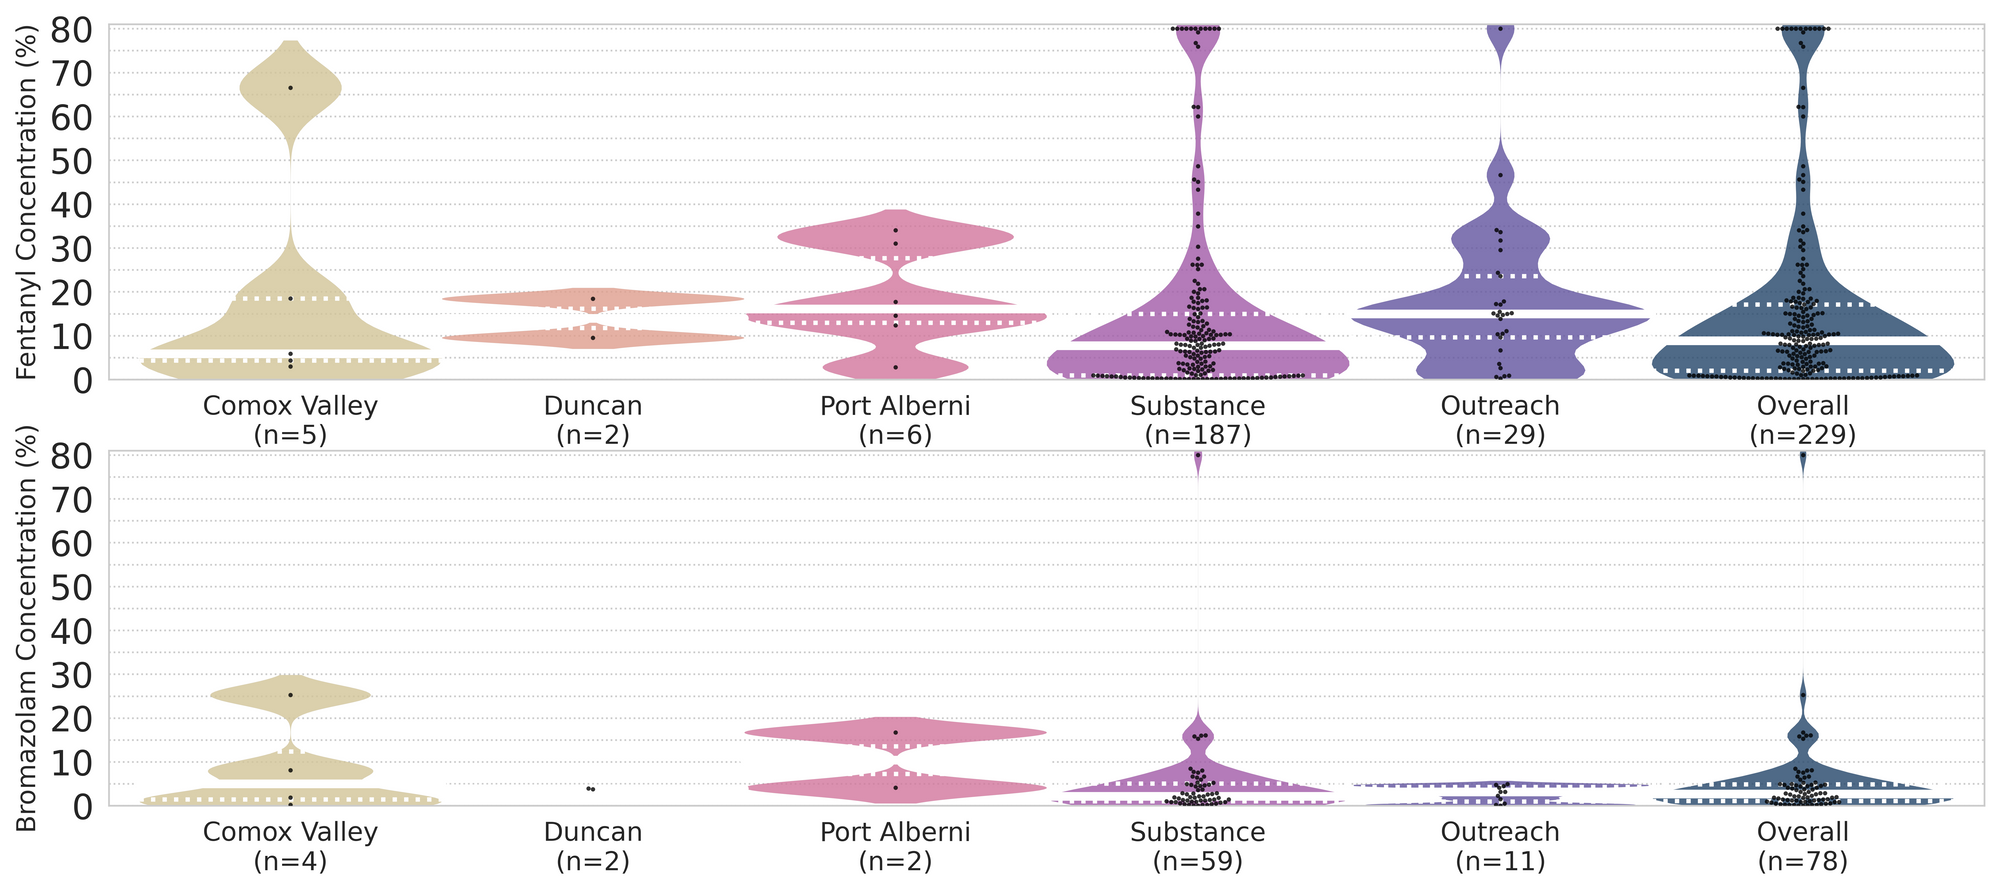
The fentanyl and bromazolam concentrations that we quantified in December, across all expected drug categories, are presented in Fig. 4. Black dots are individual opioid-down samples, Horizontal white bars show the median concentrations of fentanyl and bromazolam quantified, the width of the shaded regions mirrors the number of samples at a given concentration.
Want to be notified when we release these reports? Join our mailing list to receive updates about when our reports are out. You can subscribe and unsubscribe yourself from this list at any time.
Check back next month for the January report!
As always, send us feedback at substance@uvic.ca for how we can continue to offer our drug checking results in a useful way.