November 2022 Monthly Report

In this blog post we discuss our November 2022 report and provide more information on how to interpret the results. The PDF report can be found at the end.
Key findings:
- The median fentanyl concentration found, across all expected drug categories, was 9.7%, with a maximum of over 80%
- Carfentanil was found in 5 expected opioid-down samples, with a median concentration of 0.39% and maximum concentration of 0.45%
- Benzodiazepines and/or etizolam were found in 43% (130/304) of expected opioid-down samples
- The median concentration of bromazolam, the most common benzodiazepine found across all expected drug categories, was 1.8%, with a maximum of over 80%
- We now offer distributed drug checking in Duncan at the Duncan Lookout Housing and Health Society Overdose Prevention Site
Insight for the November 2022 Monthly Report
Throughout the past year, we have expanded our drug checking services across Vancouver Island through our Distributed Model, facilitated by the governments’ Urgent Public Health Needs Sites (UPHNS) sanctioning. While we have been offering permanent drug checking services in Port Alberni, Campbell River, and the Comox Valley since May 2022, the UPHNS sanctioning has also allowed us to shuffle around the Island(s) to offer pop-up drug checking in a handful of communities.
Amongst the pop-up sites, the Cowichan Overdose Prevention Site, operated by Lookout Housing and Health Society in Duncan, has been our most visited partner. The exuberant uptake in service in December 2021 and in October 2022, reinforced the imperative demand for, and value of, accessible drug checking services. The community calls for more pixie sticks were too loud for us to ignore any longer and this November we were delighted to welcome the Cowichan OPS on onboard as another permanent addition to our project.
We would like to thank Lisa and the team at Lookout Housing and Health Society for their enthusiasm and commitment to implementing drug checking in Duncan. As we continue to broaden our services, and as service uptake continues to grow across the Island, we are strengthened by our ongoing collaborations.
This blog, and the associated pdf report, breakdown our sample counts into six categories:
-
samples received through direct service provision in Victoria, where service users are bringing samples into the Substance storefront. These samples are labelled as “Substance” samples in the figures/tables of this blog post
-
samples received through direct service provision in Campbell River, where service users are bringing samples to the Vancouver Island Mental Health Society (VIHMS). These samples are labelled as “Campbell River” samples in the figures/tables of this blog post
-
samples received through direct service provision in the Comox Valley, where service users are bringing samples to AVI Health & Community Services in Courtenay, BC. These samples are labelled as “Comox Valley” samples in the figures/tables of this blog post.
-
samples received through direct service provision in the Cowichan Valley, where service users are bringing samples to the Duncan Lookout Society OPS in Duncan, BC. These samples are labelled as “Duncan” samples in the figures/tables of this blog post.
-
samples received through direct service provision in Port Alberni, where service users are bringing samples into Port Alberni Shelter Society’s OPS. These samples are labelled as “Port Alberni” samples in the figures/tables of this blog post.
-
samples received through indirect service provision, where samples are being collected through no contact drop-off envelopes, mail-in envelopes, or are being collected by harm reduction workers and/or other community members at supported housing sites, at overdose prevention sites, and supervised consumption locations. These samples are labelled as “Outreach” samples in the figures/tables herein.
Drug types
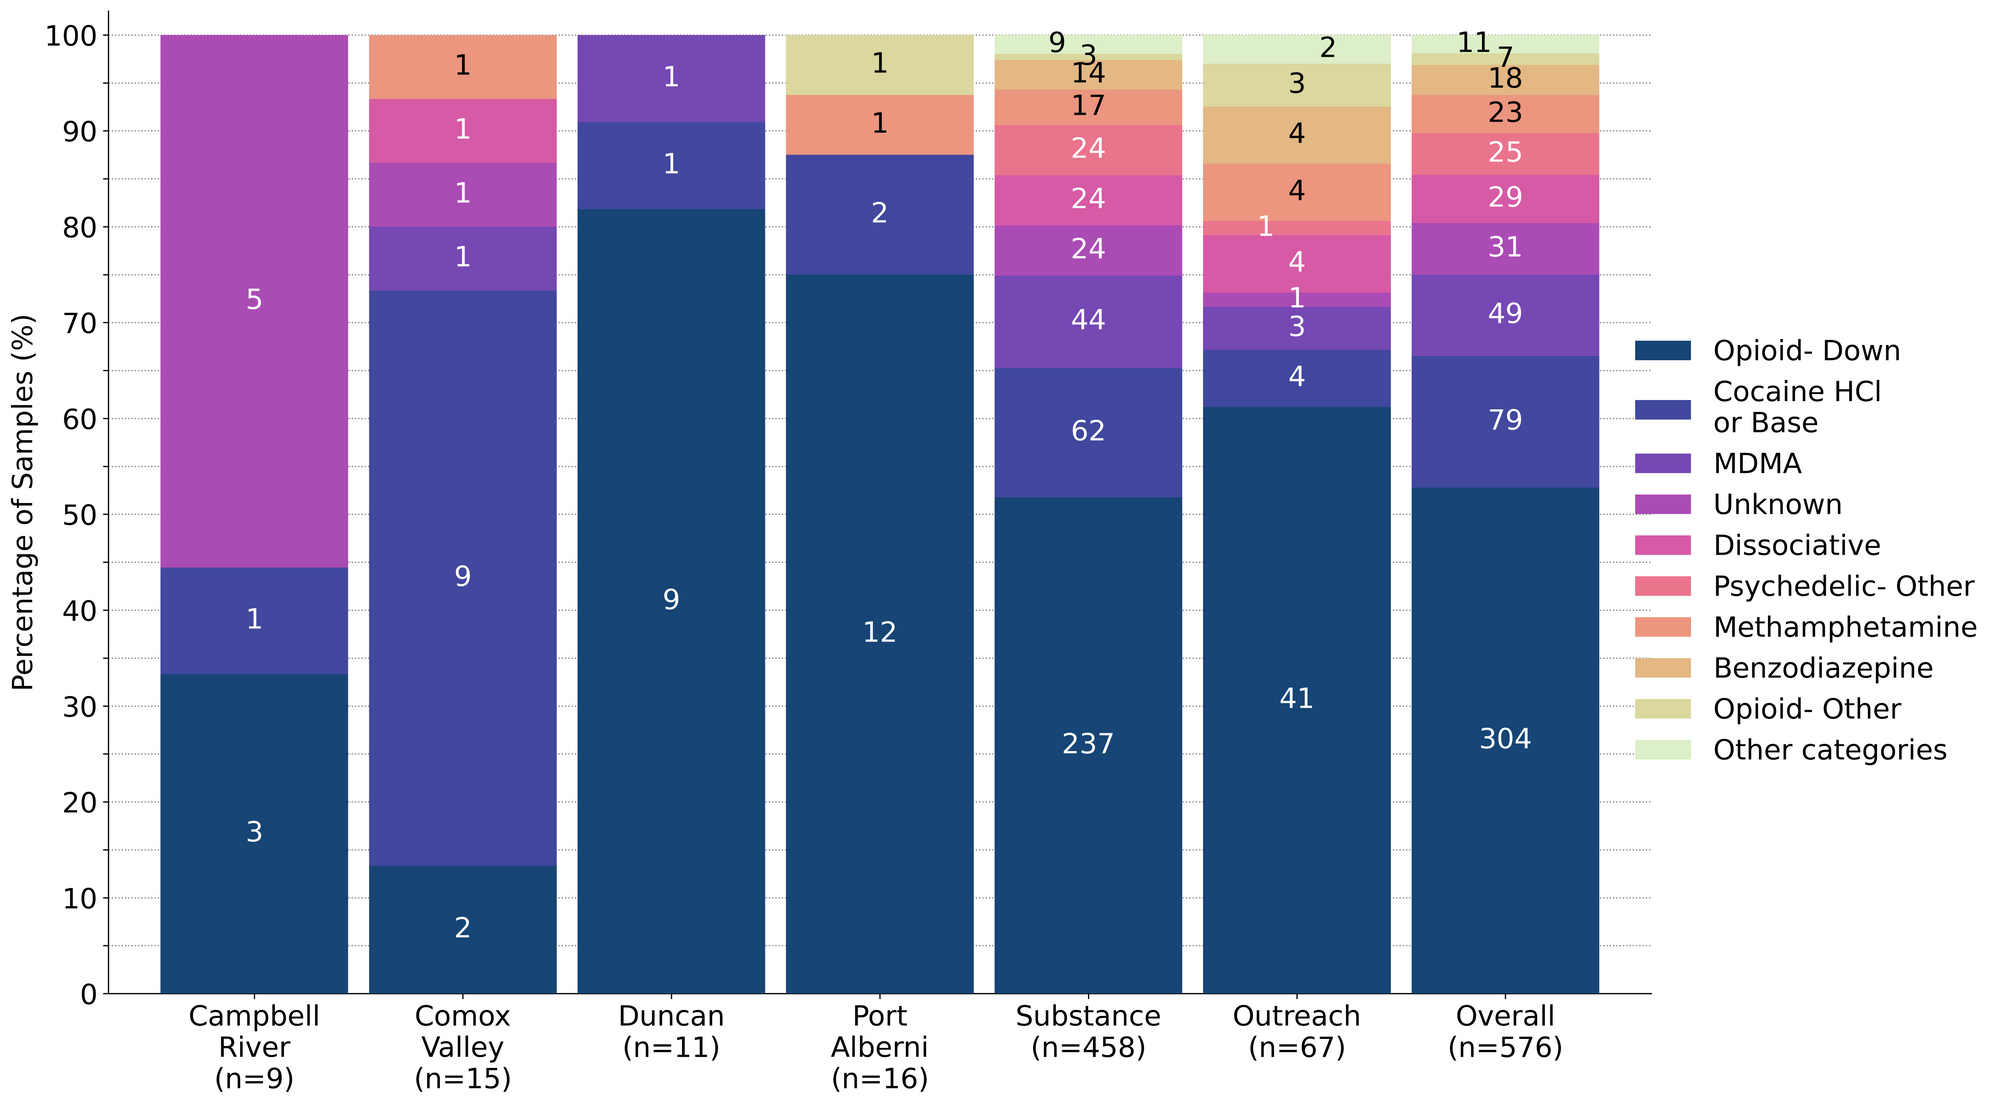
Fig. 1 shows the prevalence of each expected drug category checked, split by sample collection location/method.

November’s nutshell on the normal, the noteworthy, and the not-as-advertised
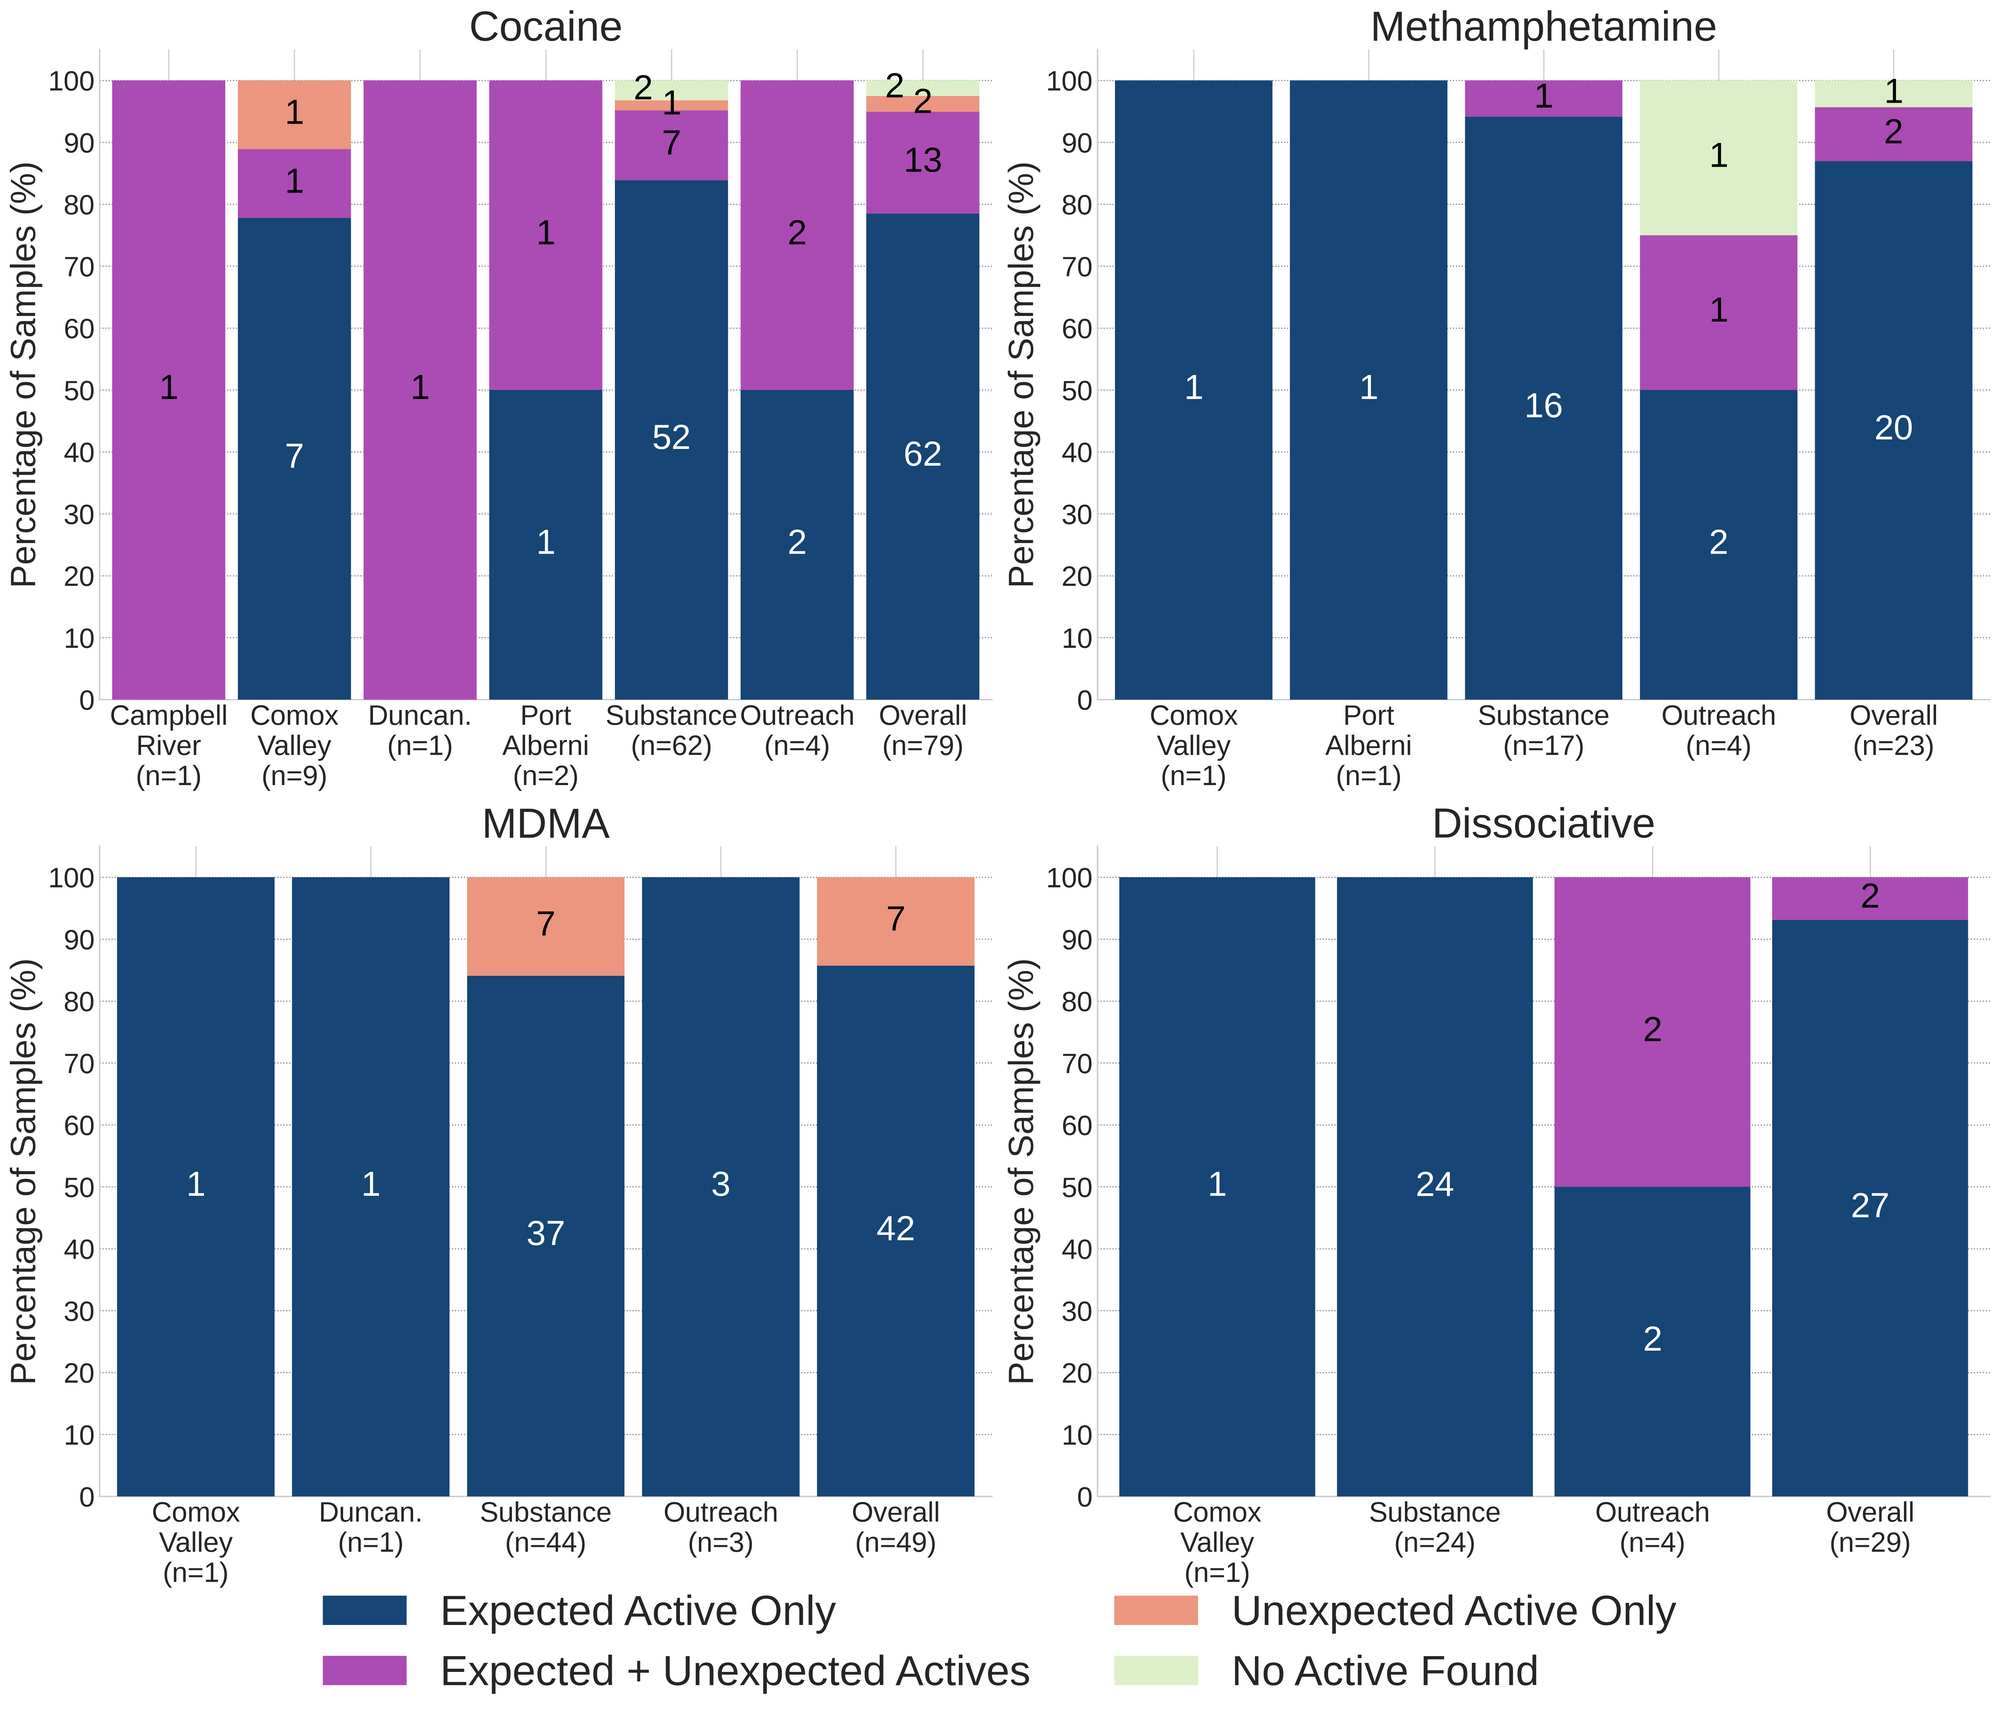
For a majority of samples checked, we confirm that the expected drug was indeed the only active and that no additional active compounds were present. The bar charts below highlight a few classes of drugs, differentiating samples when only the expected active was found from situations when other unexpected active components were detected.
93% (27/29) of expected ketamine samples checked were confirmed to be ketamine with no other active compounds detected. Three of these samples were cut with sugar. The remaining two samples, were found to contain ketamine and an additional active component:
- One sample from Victoria was found to be ketamine cut with 3% phenacetin (a tylenol-like drug, also known as “super-buff” in the context of cuts found within cocaine samples)
- One envelope sample was found to be a mixture of ketamine and MDA
88% (42/49) of expected MDA/MDMA samples checked were confirmed to be MDA/MDMA as expected, with the MDMA-to-MDA mixup representing all remaining samples:
- 7 expected MDMA samples were found to just be MDA
87% (20/23) of expected methamphetamine samples checked in November, across all collection locations/methods, were found to be meth with no other active compounds or cuts detected. One liquid sample contained no meth and was just water. The two remaining samples were found to contain additional active compounds beyond meth; these samples were collected in Victoria:
- One sample was liquid from a syringe that was found to contain methamphetamine, fentanyl, fluorofentanyl, and bromazoalm
- One sample was primarily methamphetamine with trace amounts of fluorofentanyl detected as well (<0.1%). This sample was a clear, crystalline shard with a light dusting of blue powder
78% (62/79) of expected cocaine samples checked were confirmed to be cocaine with no detectable active adulterants. 13 samples contained an active component in addition to cocaine:
- Benzocaine - 4 samples; a local anaesthetic/numbing agent
- 1 sample additionally contained caffeine
- Levamisole - 5 samples; an antihelminthic drug used to treat parasitic worm infections, commonly seen as a cut in cocaine
- 1 sample additionally contained phenacetin (see below)
- Lidocaine - 1 sample; a topical local anaesthetic/numbing agent
- Phenacetin - 4 samples; “super buff” a tylenol-like drug, commonly seen as a cut in cocaine
The remaining 4 expected cocaine samples did not contain cocaine:
- One expected cocaine HCl sample from the Comox Valley was found to be 3-MMC (metaphedrone) instead. 3-MMC is a stimulant-entactogen in the cathinone family with effects described to be between MDMA and cocaine
- One expected cocaine base sample from Victoria was found to contain fentanyl at 11%, heroin at around 15%, and trace amounts of flurofentanyl, cut with caffeine
- Two expected cocaine base samples collected in Victoria contained no active compounds and were found to be BPA plastic instead. These samples were dark grey reflective chunks that were not easily crushed
Benzodiazepines (n=18)
79% (15/19) of the benzodiazepine samples checked in November came to our service in the form of pressed pills; the remaining four samples were powders. 13 of the 15 pills were expected to be alprazolam (Xanax), one was expected to be lorazepam (Ativan), and one was expected to be diclzepam. The diclazepam was confirmed to be diclazepam, while the expected lorazepam pill was found to contain cyclobenzaprine (a muscle relaxant) and only one of the expected alprazolam/Xanax tablets was confirmed to contain alprazolam. The 12 other pressed pills were found to contain a benzo or benzo-related drug other than alprazolam:
- Bromazolam - 1 sample. Bromazolam is comparable in both strength and duration to alprazolam.
- Flualprazolam - 9 samples. Flualprazolam is ~2x stronger than alprazolam in terms of dosage but has a similar duration of effect (5-8 hours)
- Etizolam - 1 sample. Etizolam is ~2x weaker than alprazolam in terms of dosage but has a similar duration of effect (5-8 hours)
Within the four powder samples:
- One unknown benzo powder was found to contain flualprazolam
- One sample was confirmed to be bromazolam powder, as expected
- One sample was confirmed to be bromazolam powder, as expected, but also contained trace amounts of fluorofentanyl
- One sample, a dark brown sticky powder collected in Victoria, was found to contain no benzos and instead was found to contain high concentration fluorofentanyl (>80%) and trace amounts of fentanyl.
Opioid-Down (n=304)
In this section we present results specific to the opioid-down supply, therefore they may differ from the highlighted findings above that are inclusive of all expected drug categories.
- 90% of expected opioid-down samples contained fentanyl (274/304)
- 10 samples contained heroin (3% of expected opioid-down samples), with a median concentration of 68% and a range of 19% to >80%:
- 4 samples were just heroin (and related alkaloids like acetylmorphine (MAM) and acetylcodeine)
- 5 samples additionally contained fentanyl ranging from 0.1% to >80%.
- Benzos were detected in three of these samples with etizolam being detected at >25% in two samples, and a positive strip test detecting an unknown benzo in the other sample.
- One sample also contained Isotodesnitazene at 0.3%. Isotodesnitazene is a benzimidazole opioids (nitazene) that is comparable in strength to fentanyl
- 2 samples were found to contain heroin via mass spectrometry, however these samples were baggie residue that were too sparse for us to quantify how much heroin was present
- 5 samples contained carfentanil, with a median concentration of 0.39% and a range of 0.06% to 0.45%
- 43% of expected opioid-down samples contained a benzodiazepine and/or etizolam (130/304)
- Xylazine was detected in 2% (7/304) of opioid-down samples, with a median concentration of 0.1% and a range of 0.1% to 7.1%
In November, 74% (224/304) of all opioid-down samples checked contained an additional active to the expected fentanyl. Examining Fig 3. we can see that the down supply has remained consistently inconsistent:
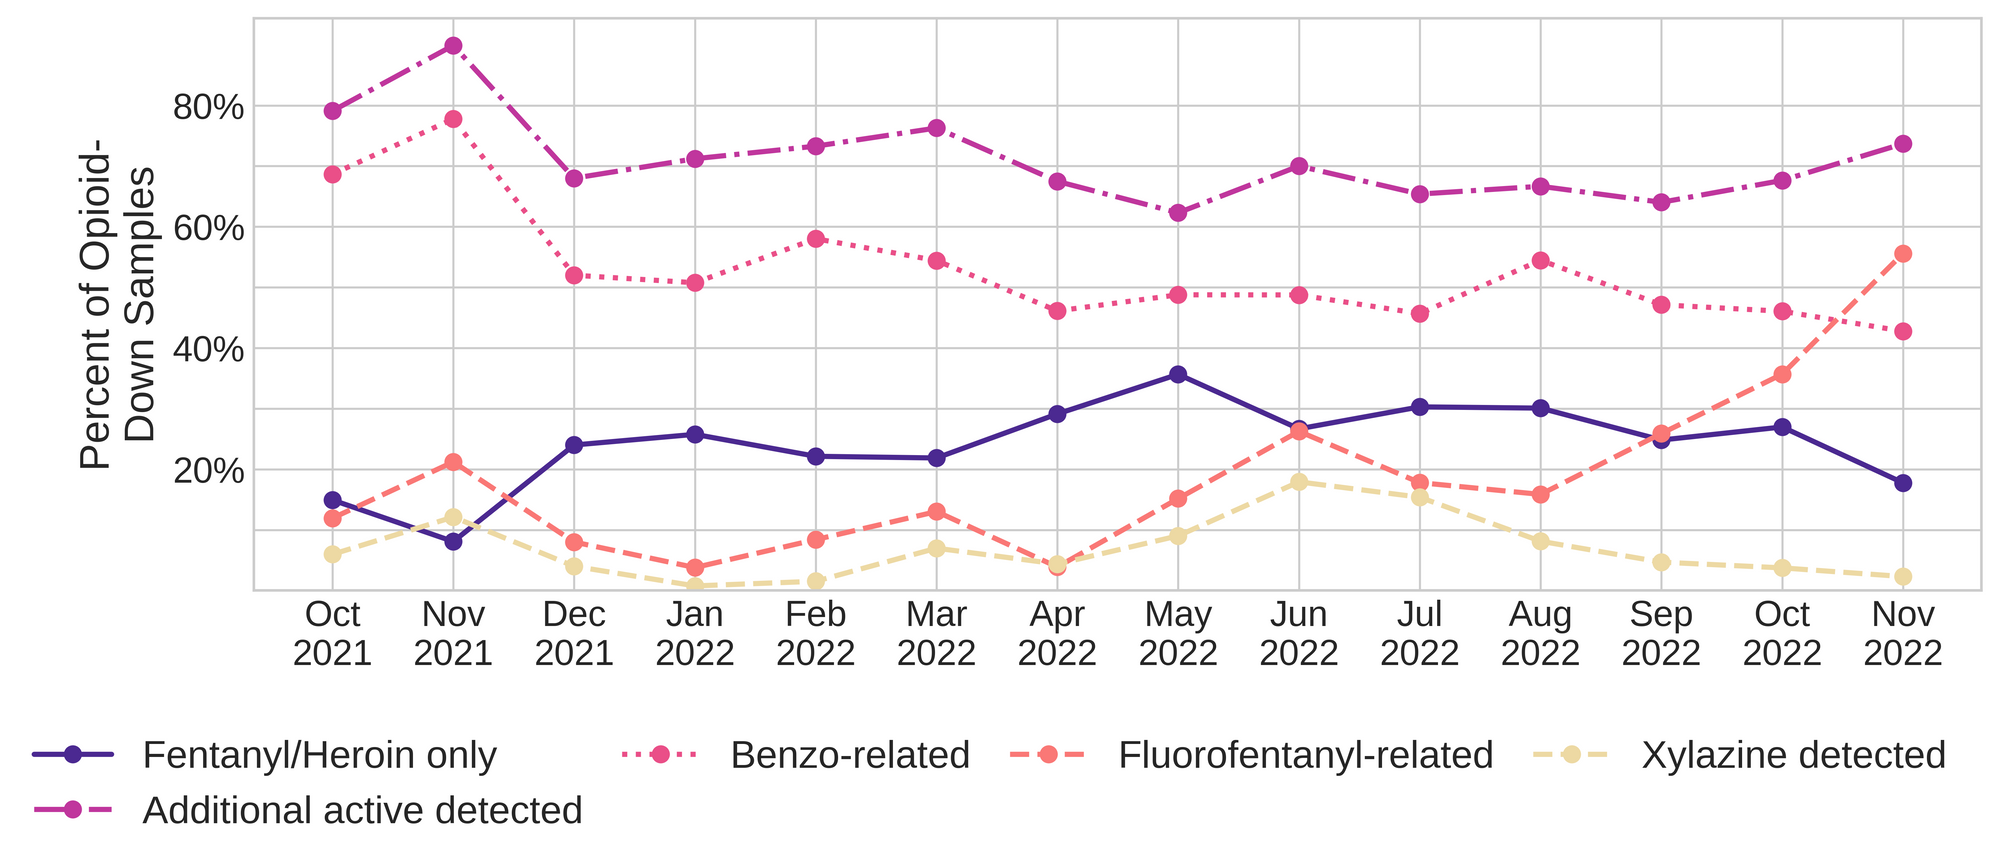
Fluorofentanyl was the most common additional active found within the opioid-down supply, with 50% (150/304) of opioid-down samples containing fluorofentanyl in addition to fentanyl. This level of adulteration has been steadily increasing the past few months. Additionally, fluorofentanyl was the only opioid detected in 20 opioid-down samples (i.e. no fentanyl or heroin was detected in these samples). Fluorofentanyl is a fentanyl analogue that appears to have a range in potency depending on which structural isomer (or combination of isomers) is present. While there is limited clinical data available regarding the strength of the fluorofentanyls, Hassanian et al. (2020) suggest that the fentanyl-equivalency of fluorofentanyl could range from around 0.2x to more than 2x the strength of fentanyl, depending on which isomer is present, and based on the binding affinity to the mu opioid receptor and the EC50 level. While we cannot differentiate the three different isomers via mass spectrometry, the high concentration fluorofentanyl samples that we check on FTIR appear to primarily be para-fluorofentanyl. As always, we recommend starting low and slow with new samples, especially when novel compounds are present.
Benzo-related drugs contribute to a majority of the other additional actives found in expected opioid-down samples, with 43% (130/304) of expected opioid-down samples checked containing a benzo-related drug. Bromazolam continues to be the most common benzo seen in the down supply, with bromazolam being detected in 72% of the benzo positive opioid-down samples. Scattered detections of other drugs are still found and can be reviewed in the pdf report at the end of this blog.
Quantification for Expected Opioid-Down[1]
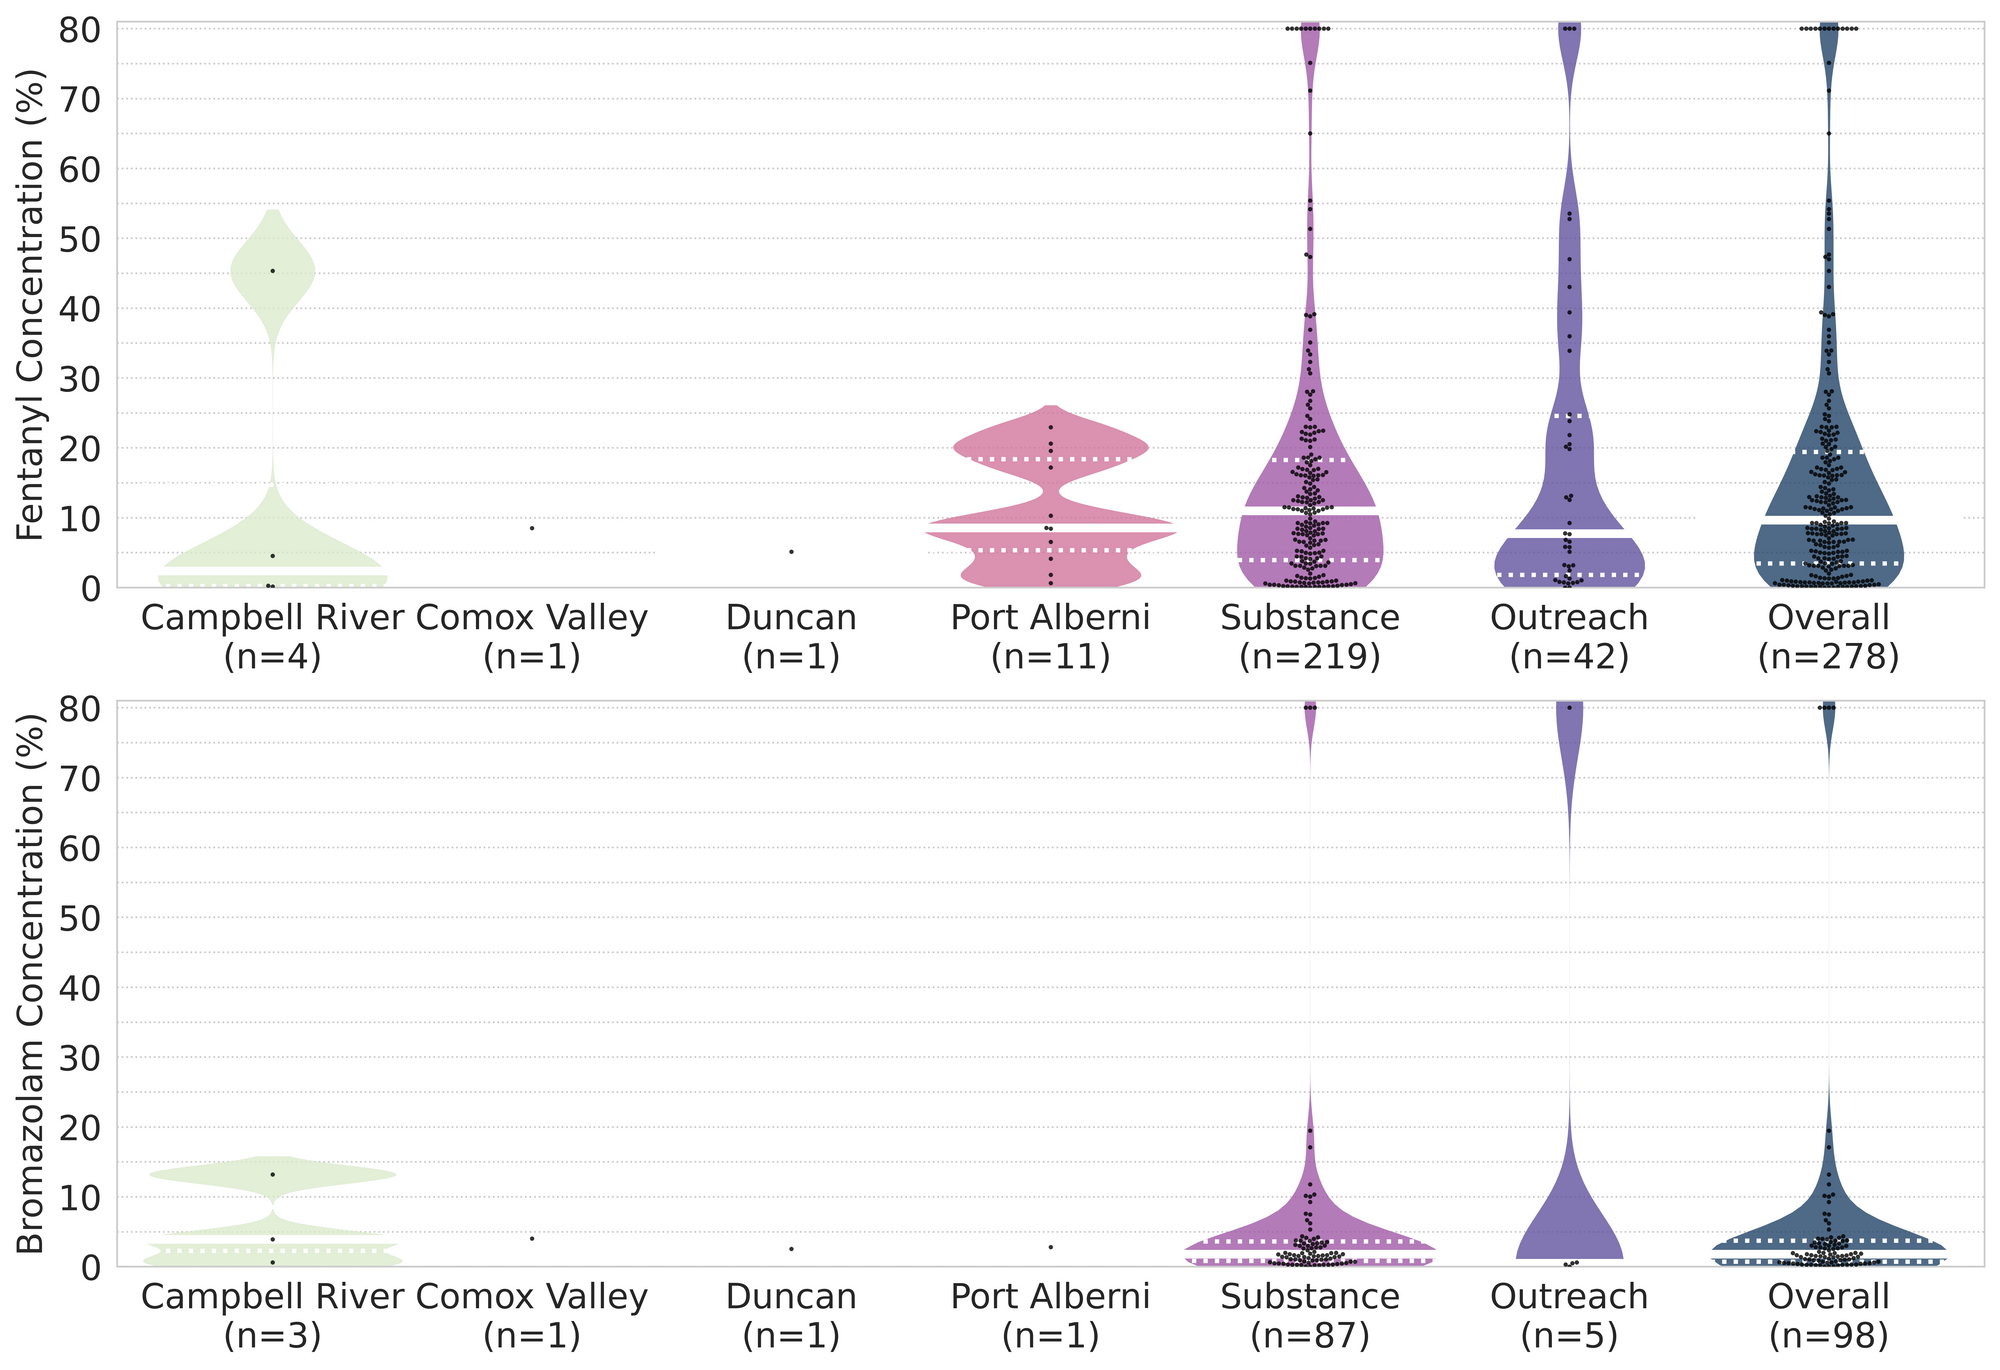
In November, we quantified fentanyl for 262 of the expected opioid-down samples containing fentanyl and found the median concentration to be 10.9%[2] with the average strength of fentanyl we normally see being around 15%. Though the median is a useful indicator, it doesn’t capture the volatility of fentanyl concentrations present in the opioid supply, as 50% of fentanyl positive down samples contained between 4.2% and 20.1% fentanyl, and any one sample might be the lowest strength (0.1%) or the strongest (>80%[3]). Similarly, the concentration of bromazolam was across the board in expected opioid down samples, with samples ranging from 0.1% to >80%[3:1] bromazolam, with a median of 1.8%.
Not all opioid down samples brought to our service can be quantified. This is primarily due to too limited sample collected for our instruments to report a reliable mass percentage. Nevertheless, qualitative detection is still possible. ↩︎
This number is specific to fentanyl quantified in opioid-down samples. The median concentration listed in the Key Findings at the beginning of this blog (9.7%) is inclusive of all samples checked, across all drug classes, that contained fentanyl. ↩︎
For samples that contain more than 80% fentanyl, or more than 25% etizolam by weight, our mass spectrometer is presently unable to reproducibly assign a concentration due to the upper limits of the calibration methods currently adopted. ↩︎ ↩︎

The fentanyl and bromazolam concentrations that we quantified in November, across all expected drug categories, are presented in Fig. 4. Black dots are individual opioid-down samples, solid white lines mark the median concentration of the fentanyl/bromazolam positive samples checked, dotted white lines bound 50% of the samples, and the width of the colored regions is proportional to the number of samples in a concentration range.
Want to be notified when we release these reports? Join our mailing list to receive updates about when our reports are out. You can subscribe and unsubscribe yourself from this list at any time.
Check back next month for the December report!
As always, send us feedback at substance@uvic.ca for how we can continue to offer our drug checking results in a useful way.