September 2021 Monthly Report


In this blog post we discuss our September 2021 report and provide more information on how to interpret the results. The PDF report can be found at the end.
Key findings:
- Carfentanil found in seven samples, six expected to be opioid-down and one unknown
- 95% of expected opioid-down samples contained fentanyl
- Median fentanyl concentration found of 10.5%, with a maximum of 72.9% found in an expected opioid-down sample
- Benzodiazepines and/or etizolam found in 68.3% of expected opioid-down samples
- The maximum concentration of etizolam found was 64.4% in an expected opioid-down sample
Insight for the September 2021 Monthly Report
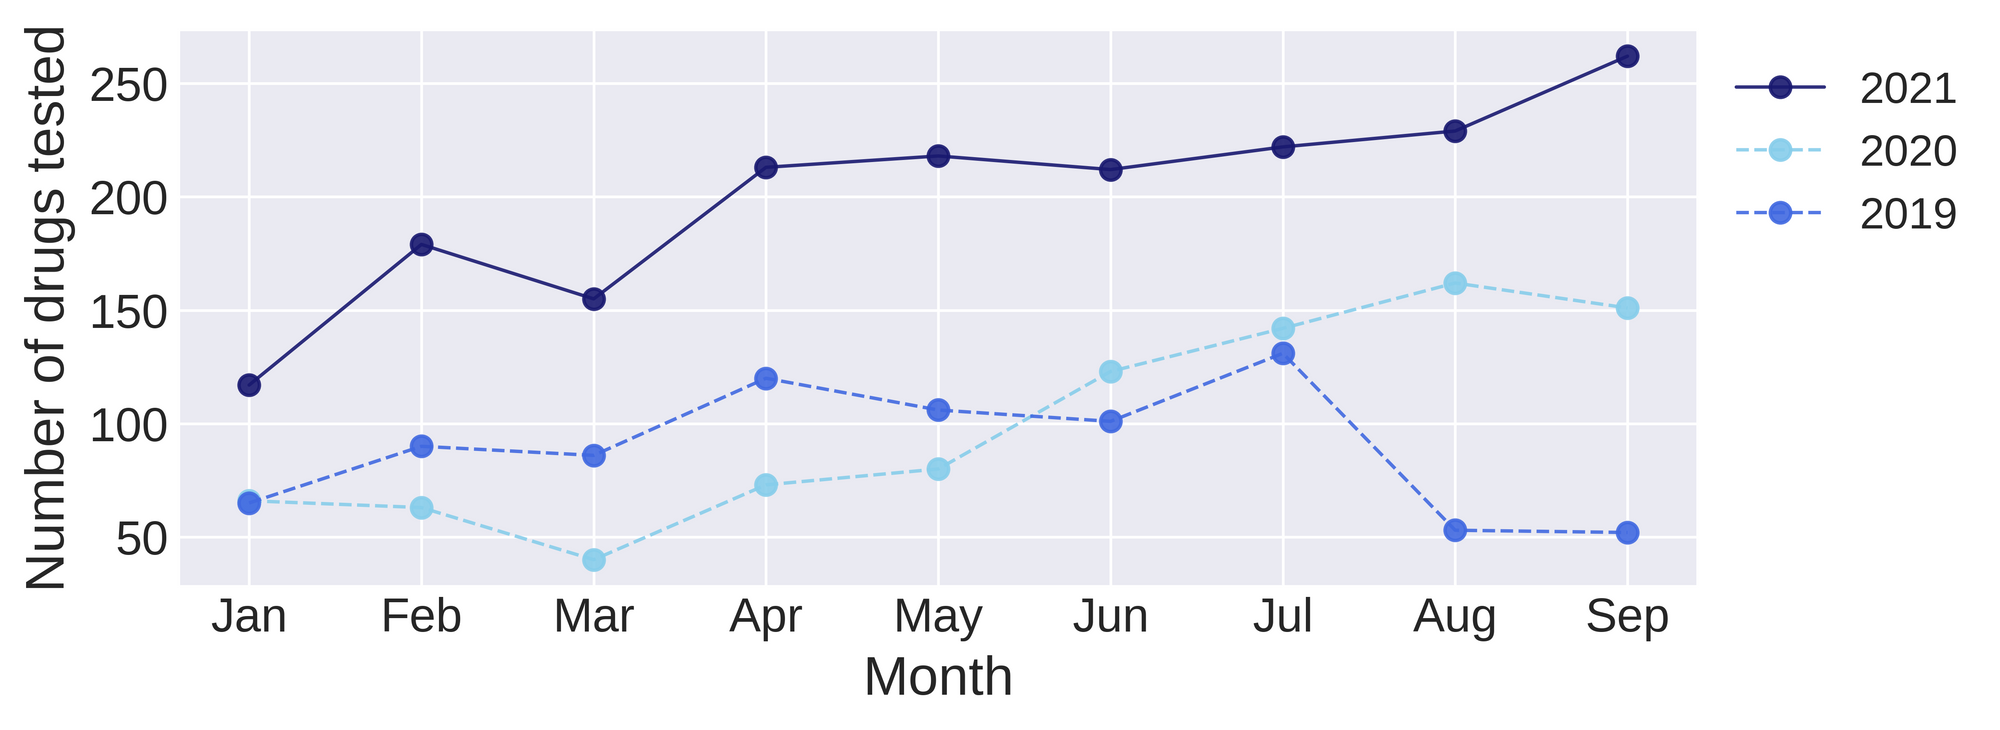
This past September, 262 samples were checked at Substance, a 174% increase from September 2020! Number theorists tell us that 262 is considered a "happy number" and we would agree: we have been delighted to see the surge in service.
Drug Types
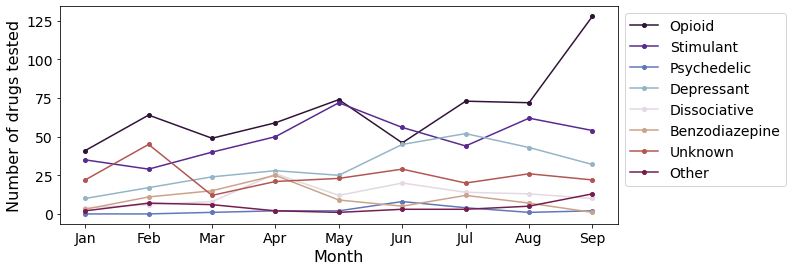
September showed us everything from mescaline to methamphetamine to hydromorphone. Fig. 2 shows the prevalence of each expected drug category checked so far this year, with opioids and stimulants continuing to be our most common samples checked. Check out that swell in opioid samples last month!
Adventures with actives and adulterants
We receive a lot of questions regarding buffs/adulterants, cuts, and actives. For most samples, we actually confirm that the expected drug was indeed the only expected active and that no additional cutting agents were present. The pie charts below highlight a few classes of drugs, differentiating samples when only the expected active was found from situations when other unexpected components were detected.
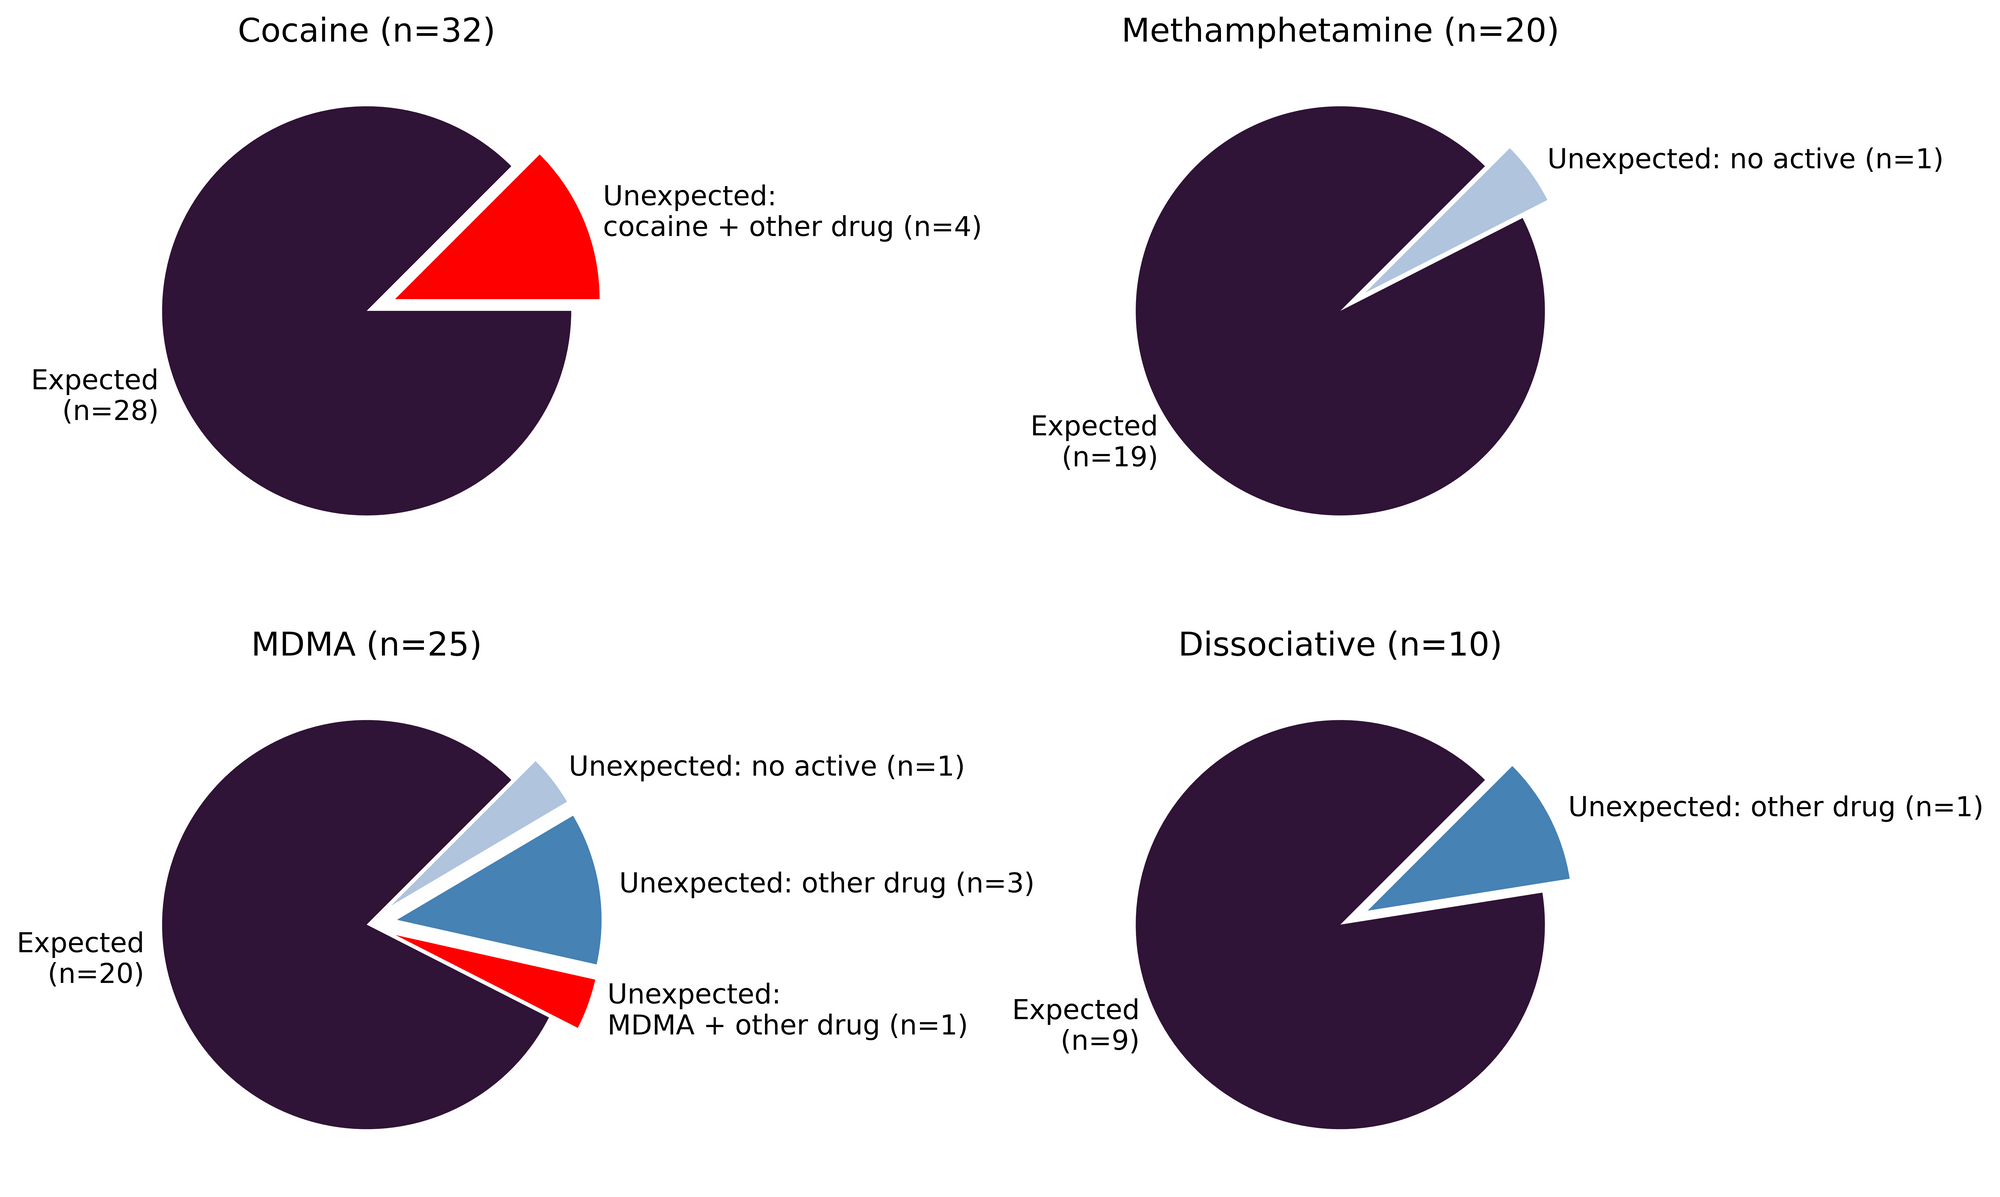
32 expected cocaine samples were checked in September, and 88% were found to only contain cocaine (or cocaine base) as a single ingredient. The remaining four samples contained the following buffs: methamphetamine (one sample), phenacetin (two samples; an acetaminophen-like substance), and levamisole (one sample; an antihelminthic drug commonly seen as a cut in cocaine base).
September yielded 20 expected methamphetamine samples and 19 (95%) samples were found to be meth as a single ingredient. No actives were found in the one remaining sample. Meth continues to be meth!
Compared to last month’s findings, September’s MDMA samples were a more straightforward story. 80% (20/25) of the MDMA samples checked were found to be MDMA as a single ingredient. Three samples contained MDA as the only ingredient, one sample contained MDMA and MDA, and the remaining sample did not contain any active.
Ketamine was found as the only active in all eight expected ketamine samples checked this month. An expected O-PCE (a.k.a eticyclidone, a dissociative arylcyclohexylamine closely related to ketamine) sample was found to only contain O-PCE and an expected DXM (dextromethorphan; a cough suppressant) sample contained only contained ketamine and methoxetamine (MXE) as unexpected actives.
Spotlight samples 1:
Holy research chemicals, Batman! September showed us a suite of synthetic substances whose scintillating spectra were seen at our service site. We’ll leave the Googling and taxonomic trapezing for the eager reader, but September’s novel materials included: 2C-B-FLY, 3-FPM, 3-MMC, 3,4,5-TMA, 4-CMC, 4-HO-MiPT, 5-MAPB, A-PHP, and alpha-PHiP! Gesundheit! 3,4,5-TMA (phenethylamine analgoue, related to mescaline) was found in an expected mescaline sample, and 4-HO-MiPT (a substituted tryptamine) was found in an expected 4-HO-MET sample (another similar substituted tryptamine); otherwise, the number-letter combinations above were the only expected component in each sample!
Benzodiazepines (n=1)
September was a quiet month for expected benzodiazepine samples. Despite the large number of opioid-down samples containing a benzo adulterant, only one sample was brought to our service that was expected to be a benzo as a single ingredient. Expected to be an alprazolam tablet (Xanax), this sample was found to contain etizolam as the only active.
Opioid-Down (n=123)
In this section we present statistics specific to the opioid-down supply, therefore they may differ from the highlighted findings above that are inclusive of all expected drug categories.
- 95% expected opioid-down samples contained fentanyl (117/123)
- 5% samples contained carfentanil (6/123)
- 68% samples contained a benzo and/or etizolam (84/123)
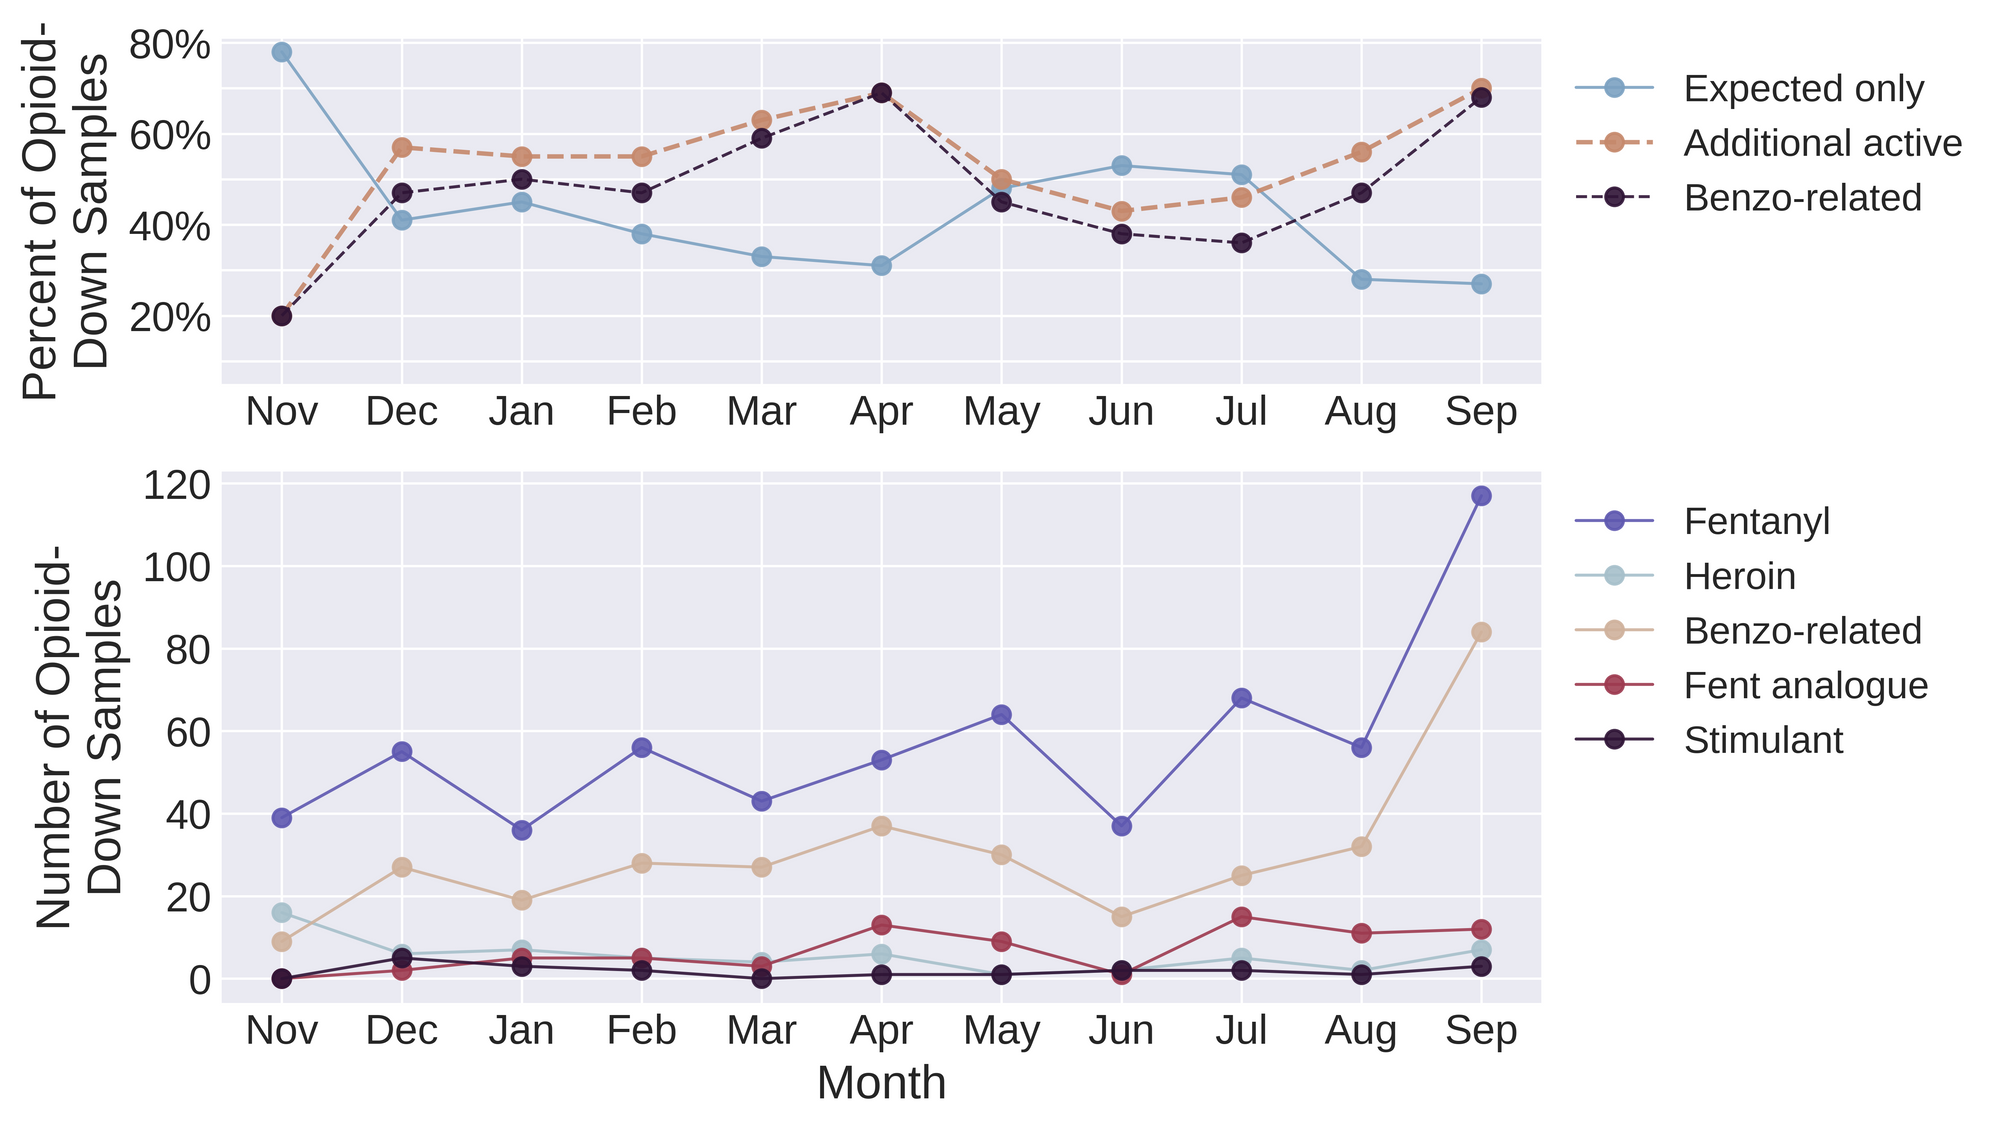
This September, 70% of opioid down samples contained an additional active to the expected fentanyl and/or heroin, with benzo-related drugs being the major contributor. This category represents the complex opioid down supply when adulterants are present, which is different from misrepresented samples where no expected active is found.
Spotlight samples 2:
Seven expected heroin samples were checked in September. All seven samples were found to contain heroin, though only one sample was found to contain heroin as the only active. Five samples contained fentanyl, carfentanil, and etizolam as additional actives; one sample contained heroin and etizolam as the only actives. Considering the combined potency of heroin, fentanyl, carfentanil, and etizolam, quantitative concentrations are valuable for service users to determine a dosage appropriate for their needs. We look forward to the day when safe and accessible supply puts us drug checking folks out of a job and provides people with the drugs and dosages they desire.
Figure 4 illustrates the consistently high percentage of adulterants found in opioid down over time, highlighting the ever-changing conditions of prohibited markets. The only consistency we have is in knowing that each month there will be a high level of inconsistencies in the supply. People who use drugs have been pointing to the remedies to this unregulated supply for years, with calls for safer supply and decriminalization as effective interventions in the unregulated market. It’s long past time we listen.
Quantification for Expected Opioid-Down[1]
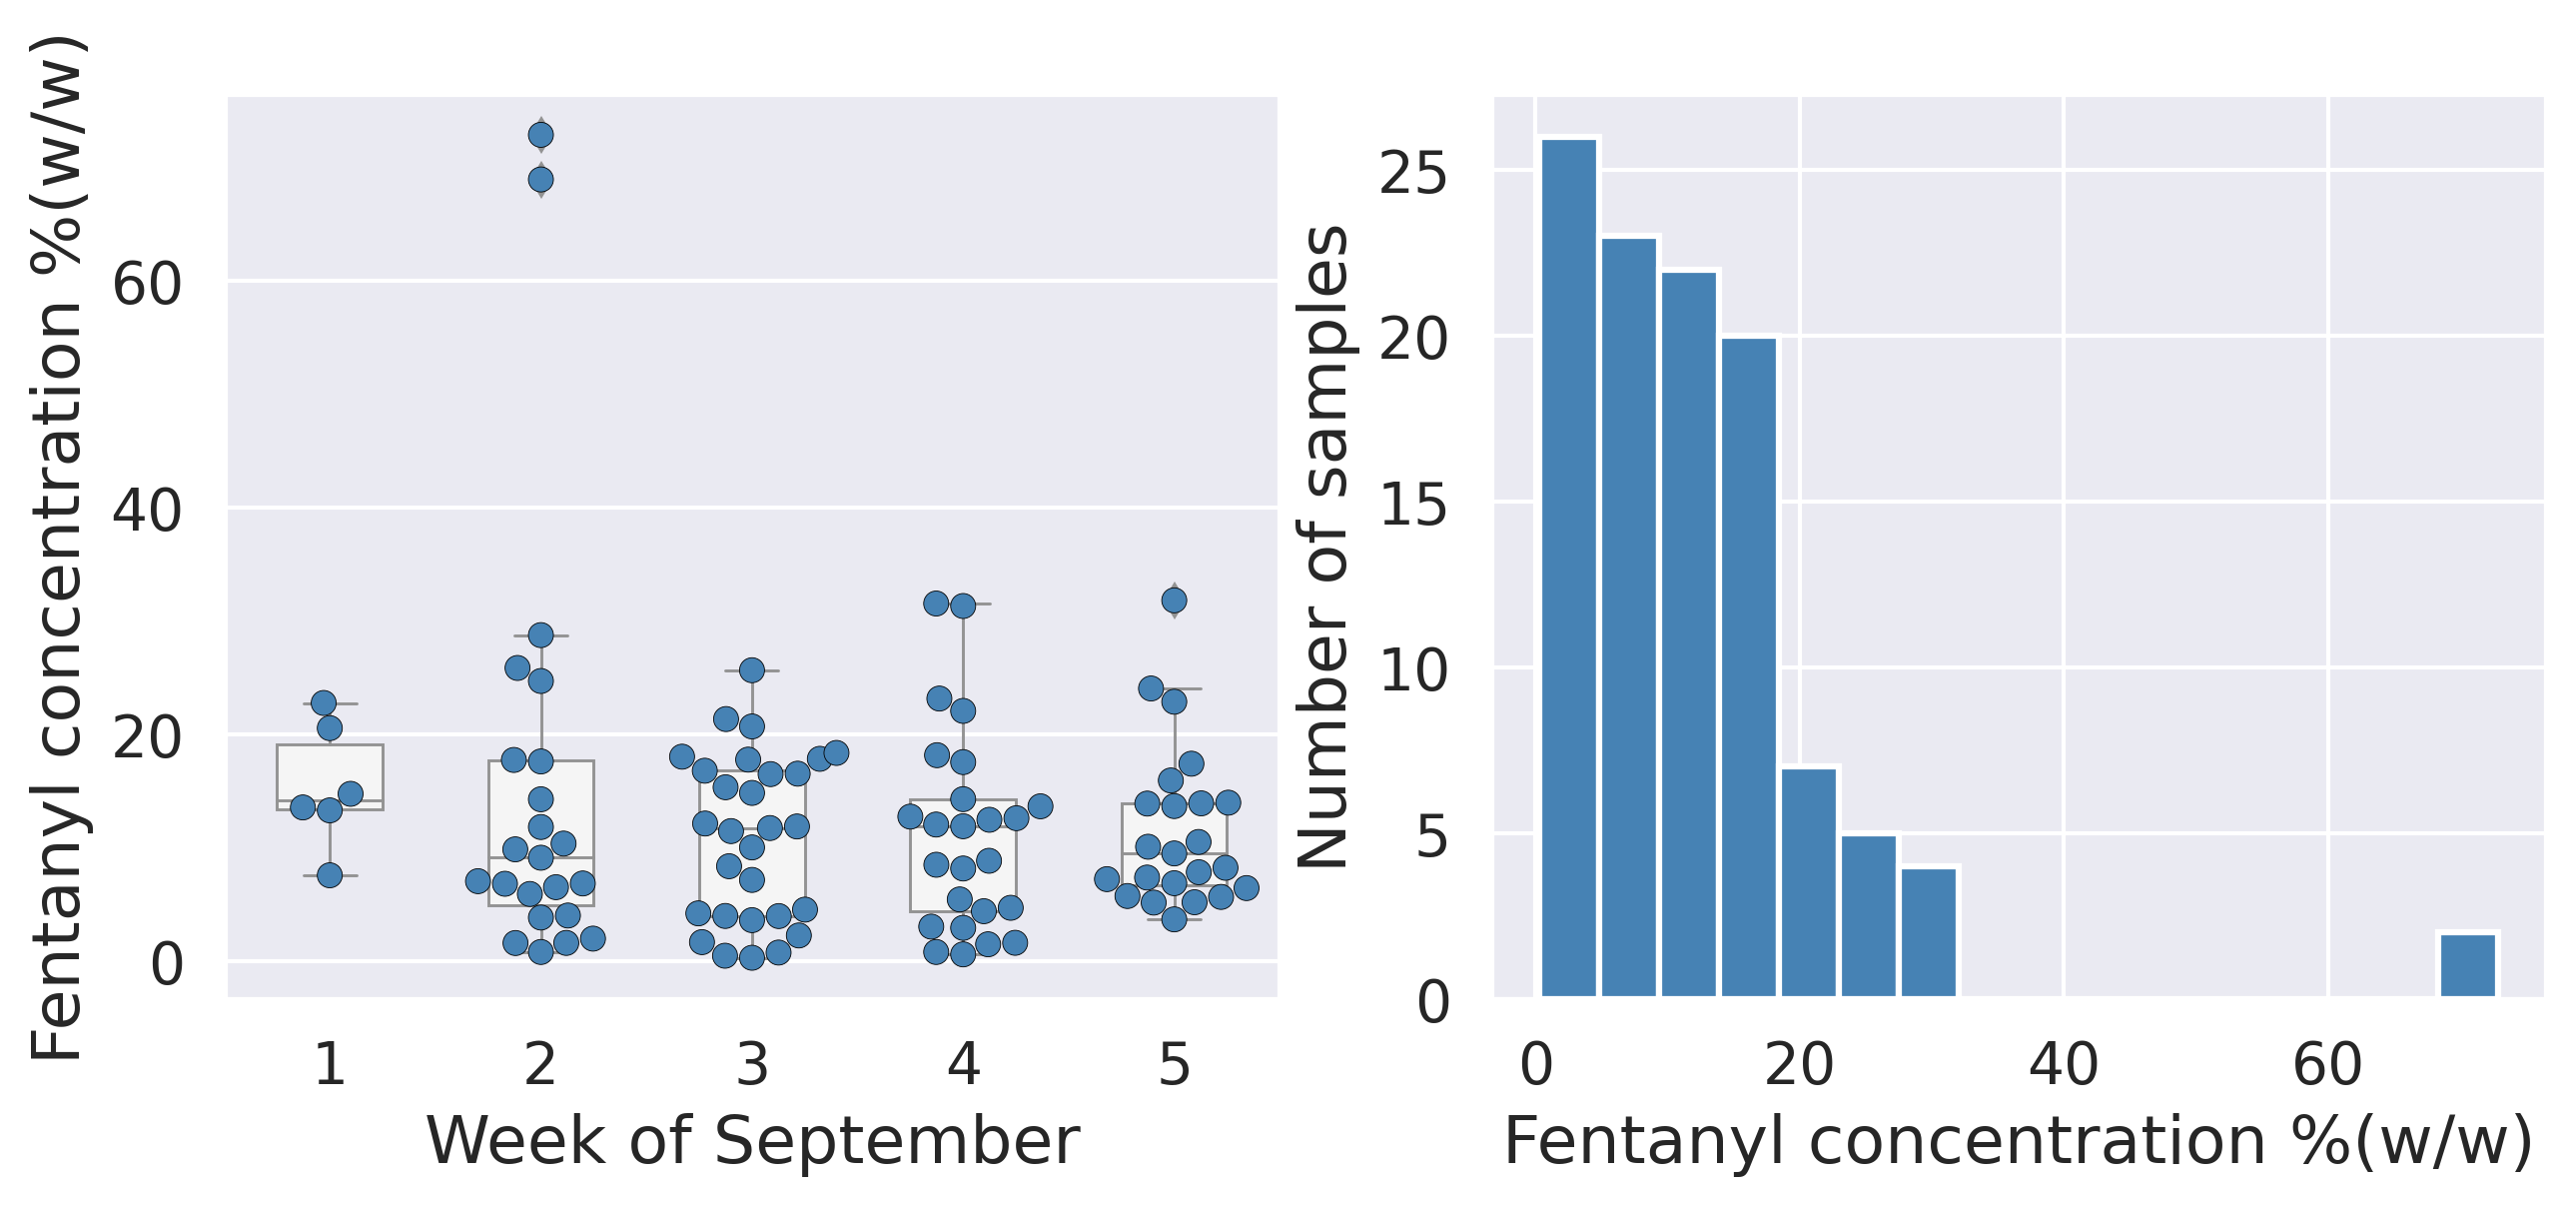
In September, we quantified fentanyl for 106/123 of the opioid down samples containing fentanyl and found the median concentration to be 10.4%, with the average strength of fentanyl we normally see being around 10% as well. Though the median is a useful indicator, it doesn’t capture the volatility of fentanyl concentrations present in the opioid supply, as any one sample might be the lowest strength (0.3%) or the strongest (72.9%). Similarly, the concentration of etizolam was across the board in expected opioid down samples, ranging from 0.1% to 64.4%, with a median of 6%.
Not all opioid down samples brought to our service can be quantified. This is primarily due to too limited sample collected for our instruments to report a reliable mass percentage. Nevertheless, qualitative detection is still possible. ↩︎

Spotlight samples 3:
"You got your etizolam in my down!" "No, you got your down in my etizolam!" Two expected opioid down samples collected in September were found to contain approximately 60% etizolam and less than 5% fentanyl. Fentanyl and etizolam are paired at the hip these days, and when the concentrations of both span the full spectrum, the conversation about “expected active” vs. “adulterant/buff” in an expected down sample becomes messier than a melted Reese’s in your pocket.
Figure 5 demonstrates the spread of concentrations we found in September by week (left) and for the month overall (right).
Want to be notified when we release these reports? Join our mailing list to receive updates about when our reports are out. You can subscribe and unsubscribe yourself from this list at any time.
Check back next month for the October report!
As always, send us feedback at substance@uvic.ca for how we can continue to offer our drug checking results in a useful way.