October 2022 Monthly Report

In this blog post we discuss our October 2022 report and provide more information on how to interpret the results. The PDF report can be found at the end.
Key findings:
- The median fentanyl concentration found, across all expected drug categories, was 13.9%, with a maximum of over 80%
- Carfentanil was found in 4 expected opioid-down samples, with a median concentration of 0.23% and maximum concentration of 0.56%
- Benzodiazepines and/or etizolam were found in 46% of expected opioid-down samples
- The median concentration of bromazolam, the most common benzodiazepine found across all expected drug categories, was 1.7%, with a maximum of over 80%
- Xylazine, a veterinary sedative, was found in 7 expected opioid-down samples with a median concentration of 0.2% and a maximum concentration of 32.2%
Insight for the October 2022 Monthly Report
There is a sixth dimension beyond that which is known. It is a dimension as vast as the number of psychoactive compounds and as timeless as people’s love of drugs. It is a middle ground between safer supply and the unregulated market, between science and community knowledge, and it lies between the pit of failed drug policy and the summits of harm reduction. This is the dimension of drug checking reporting. It is an area which we call…the Substance Blog.
This blog, and the associated pdf report, breakdown our sample counts into five categories:
-
samples received through direct service provision in Victoria, where service users are bringing samples into the Substance storefront. These samples are labelled as “Substance” samples in the figures/tables of this blog post
-
samples received through direct service provision in Campbell River, where service users are bringing samples to the Vancouver Island Mental Health Society (VIHMS). These samples are labelled as “Campbell River” samples in the figures/tables of this blog post
-
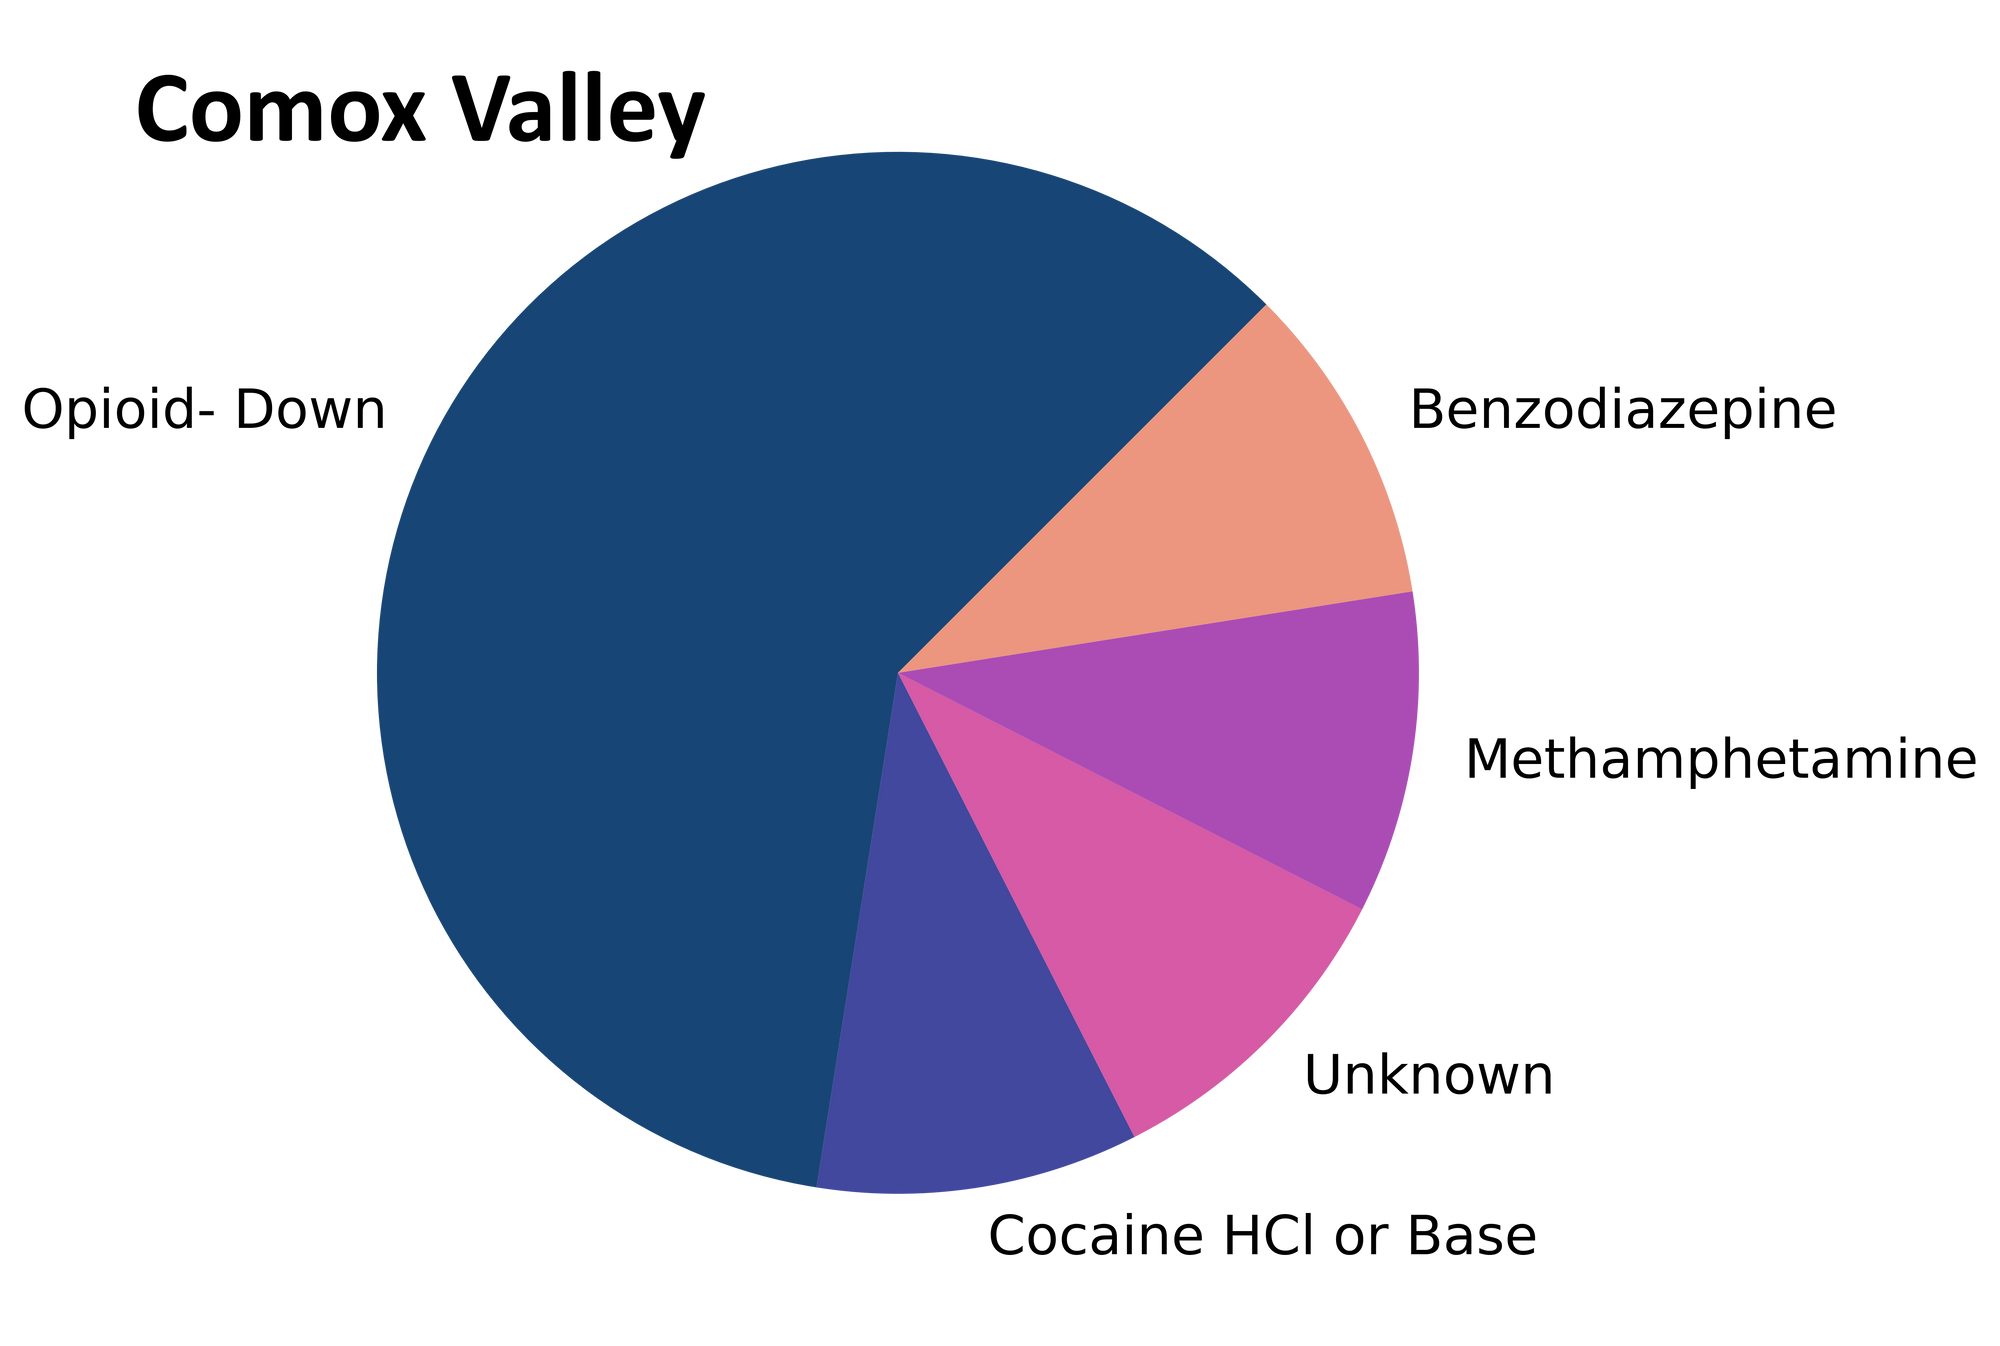
samples received through direct service provision in the Comox Valley, where service users are bringing samples to AVI Health & Community Services in Courtenay, BC. These samples are labelled as “Comox Valley” samples in the figures/tables of this blog post.
-
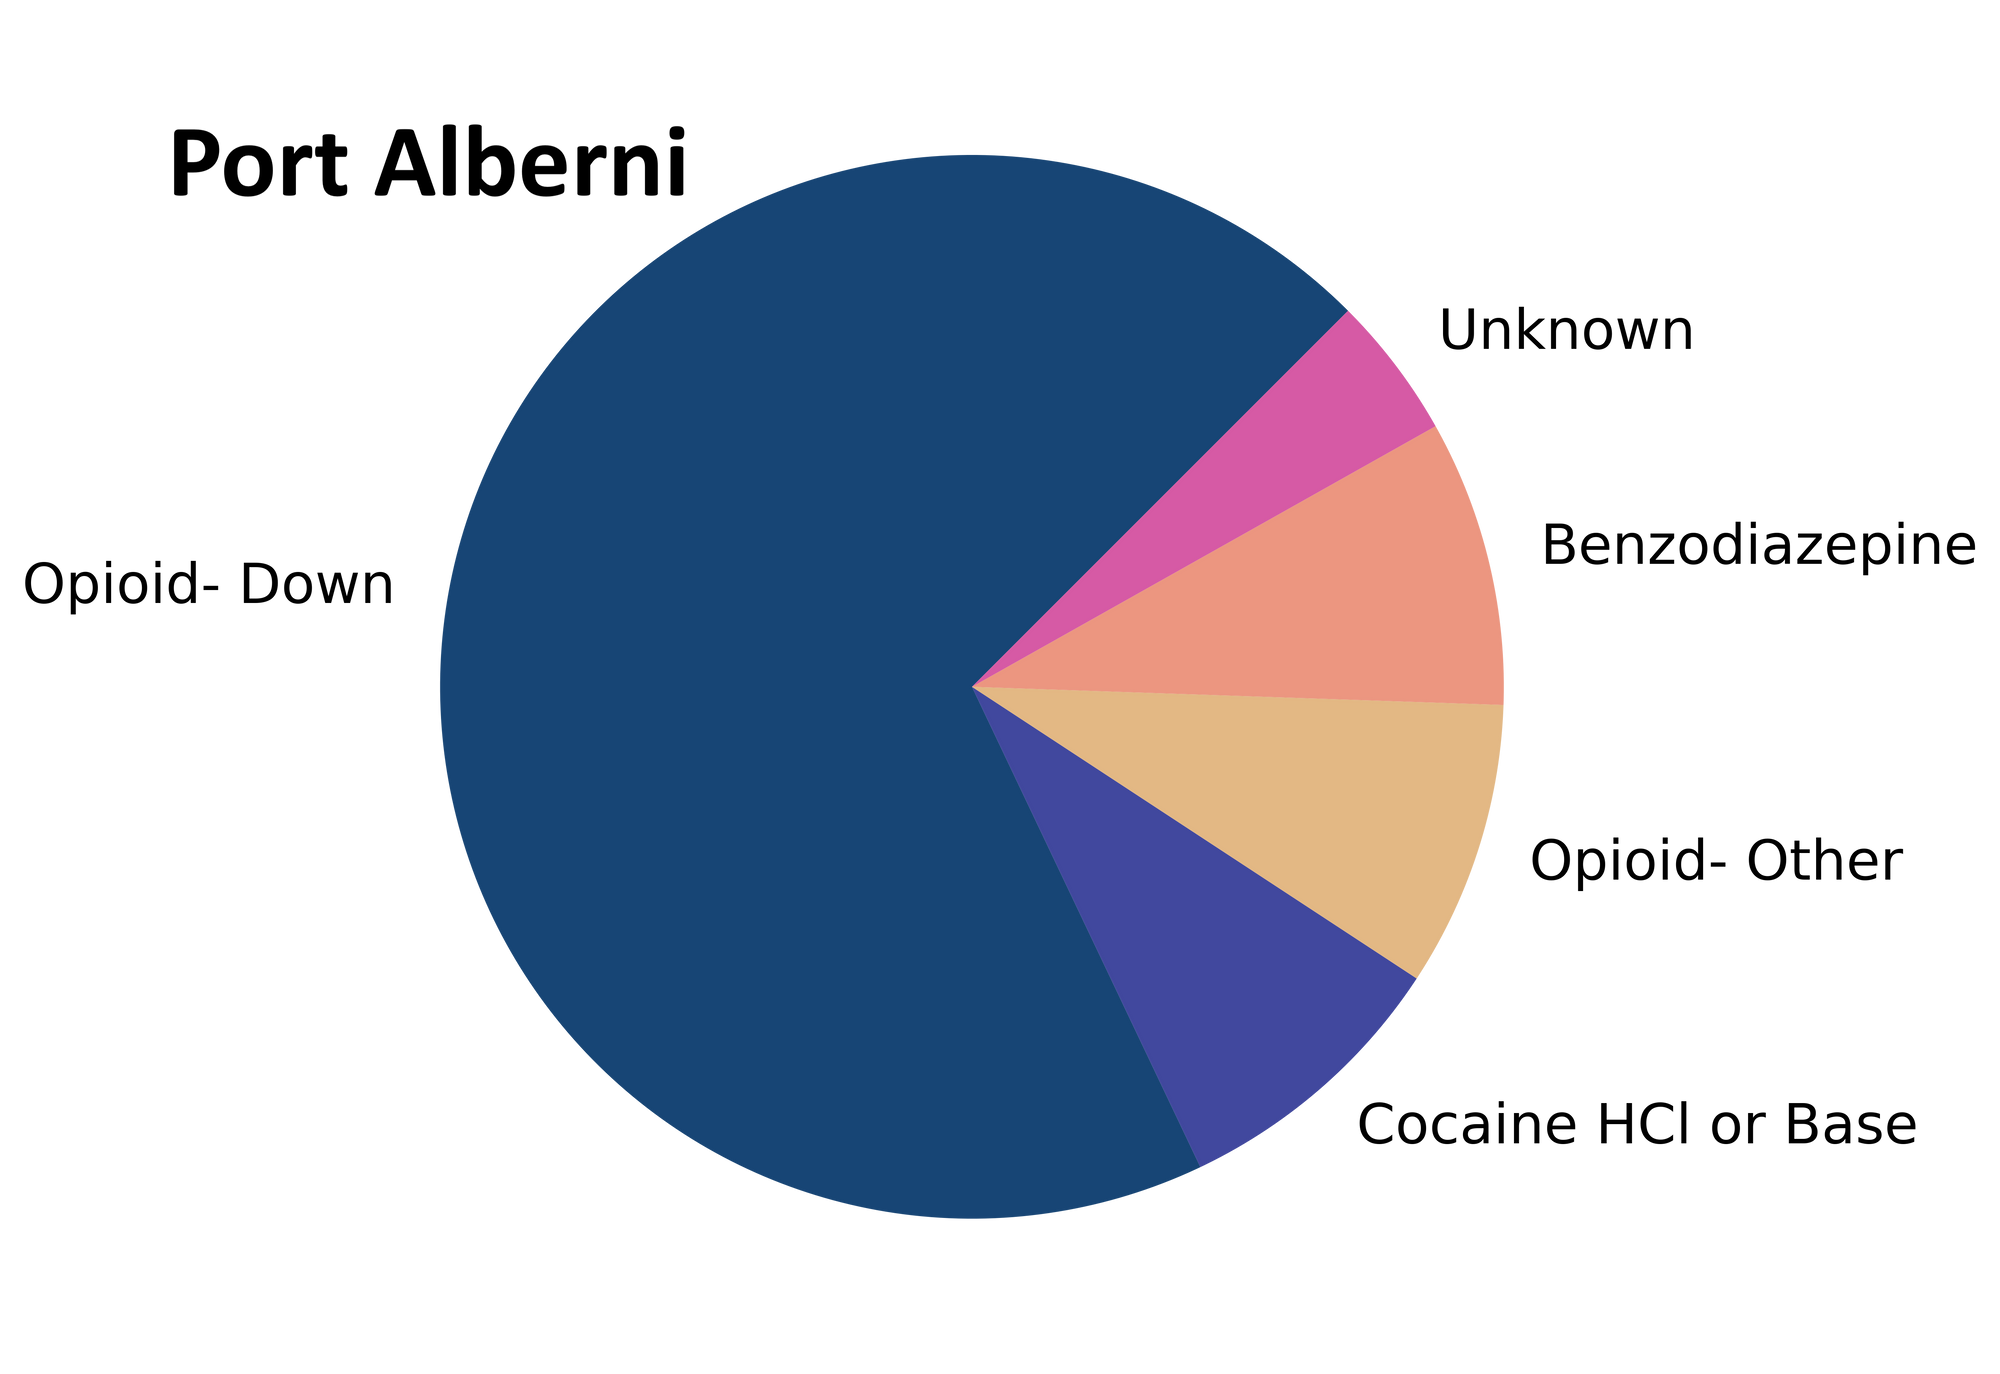
samples received through direct service provision in Port Alberni, where service users are bringing samples into PASS’s OPS. These samples are labelled as “Port Alberni” samples in the figures/tables of this blog post.
-
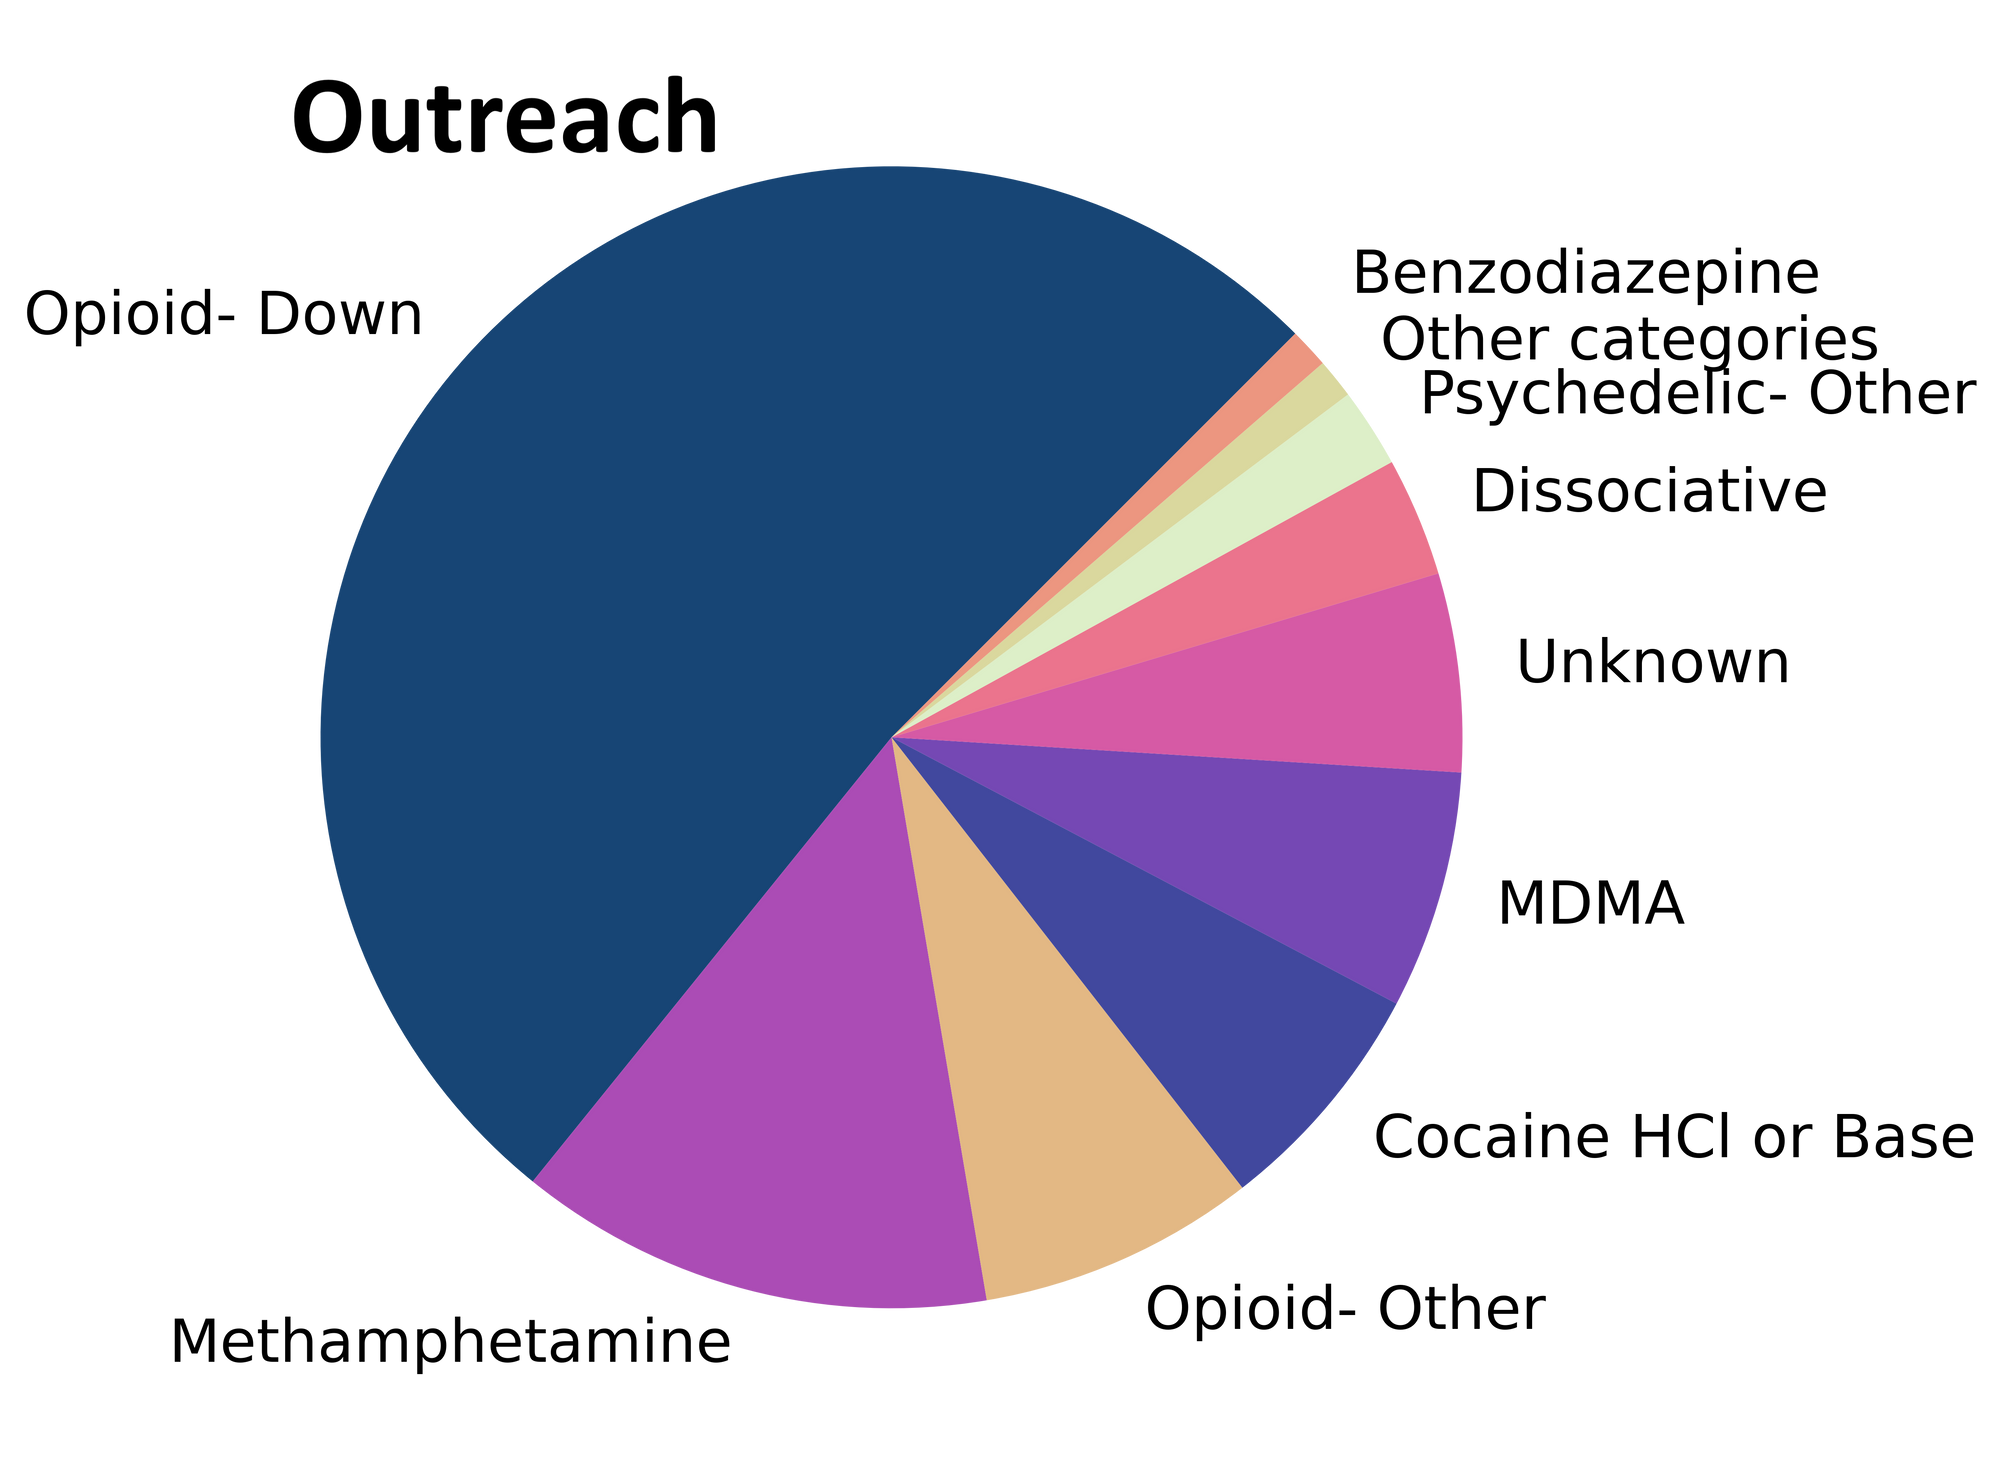
samples received through outreach services, where samples are being collected through no contact drop-off envelopes, mail-in envelopes, or are being collected by harm reduction workers and/or other community members at supported housing sites, at overdose prevention sites, and supervised consumption locations. October’s outreach data also includes samples collected during pop-up drug checking at the Cowichan Overdose Prevention Site/Lookout Housing and Health Society in Duncan and at the Oceanside Task Force on Homelessness in Parksville. These samples are labelled as “Outreach” samples in the figures/tables herein.
Drug types
Molecules of methamphetamine, MDMA, and morphine, who, on a chilly afternoon in October, induced a charge within the quadrupoles of a mass spectrometer - and never returned. Look for their identities under 'D' for 'Drug Types' in a historical ledger located in a reading room known as the Substance Blog.
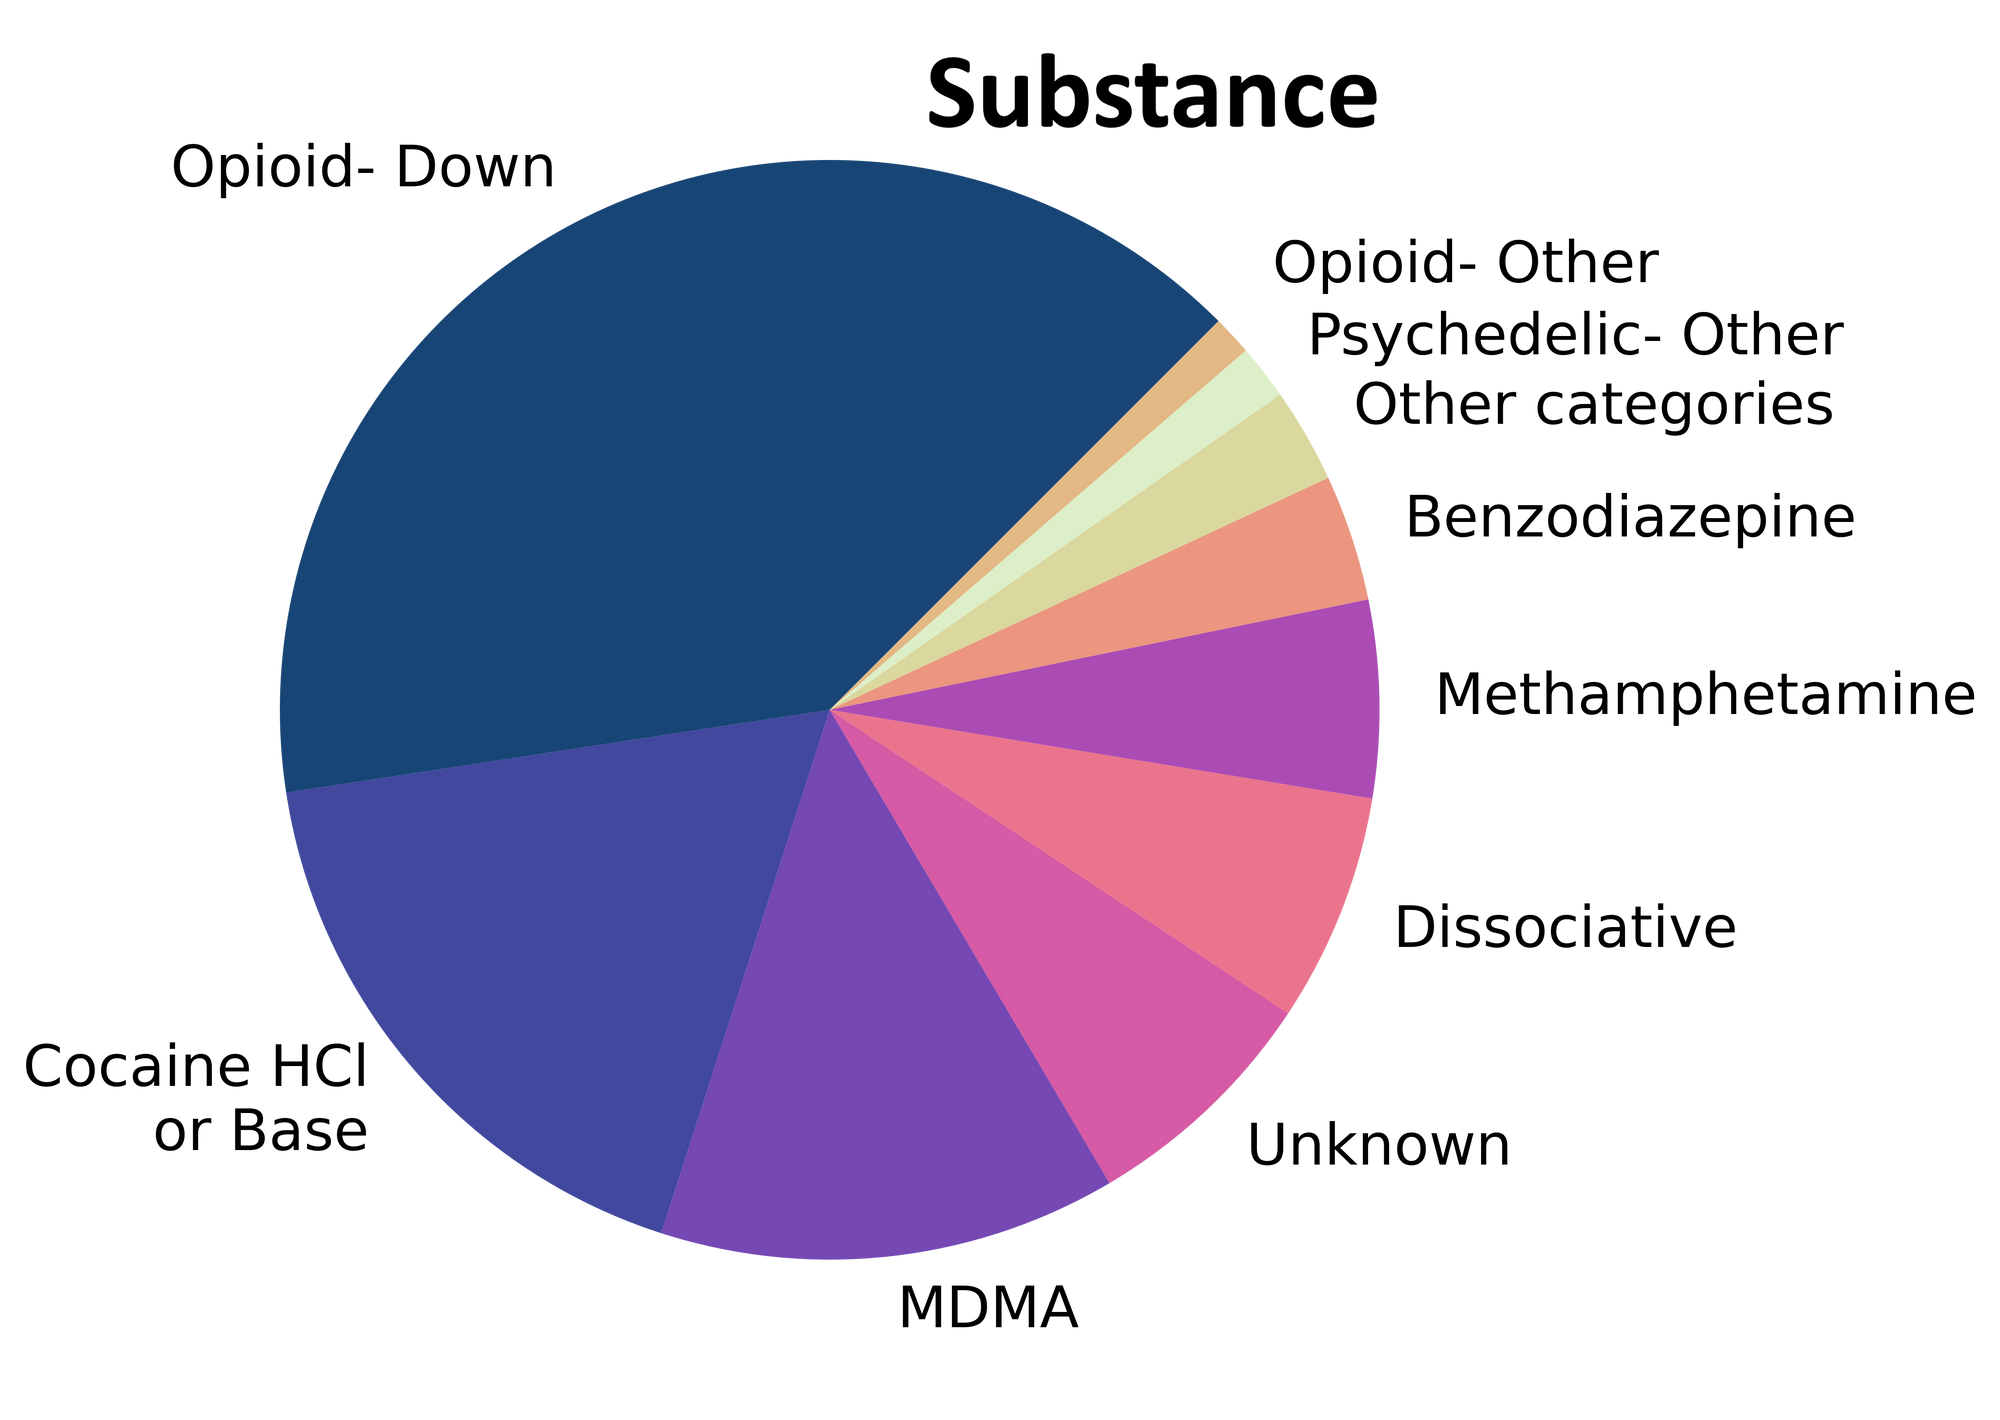
Fig. 1 shows the prevalence of each expected drug category checked within October, split by sample collection location/method.


Optics on the ordinary and the obscure within October’s supply
You're looking at a tableau of reality, the drugs of Substance, of physical material: meth samples, cocaine, MDMA. These drugs exist within the context of prohibition and criminalization. They have actives and adulterants, binders and cutting agents, and in just a moment we will see how thin a line separates that which we assume to be “as expected” with that manufactured inside the unregulated market.
Echoing our usual sentiments about adulteration, there were surprisingly few samples that appeared to be from the Twilight Zone, as most were simply as expected. For a majority of samples checked, we confirm that the expected drug was indeed the only active and that no additional active compounds were present. The bar charts below highlight a few classes of drugs, differentiating samples when only the expected active was found from situations when other unexpected active components were detected.
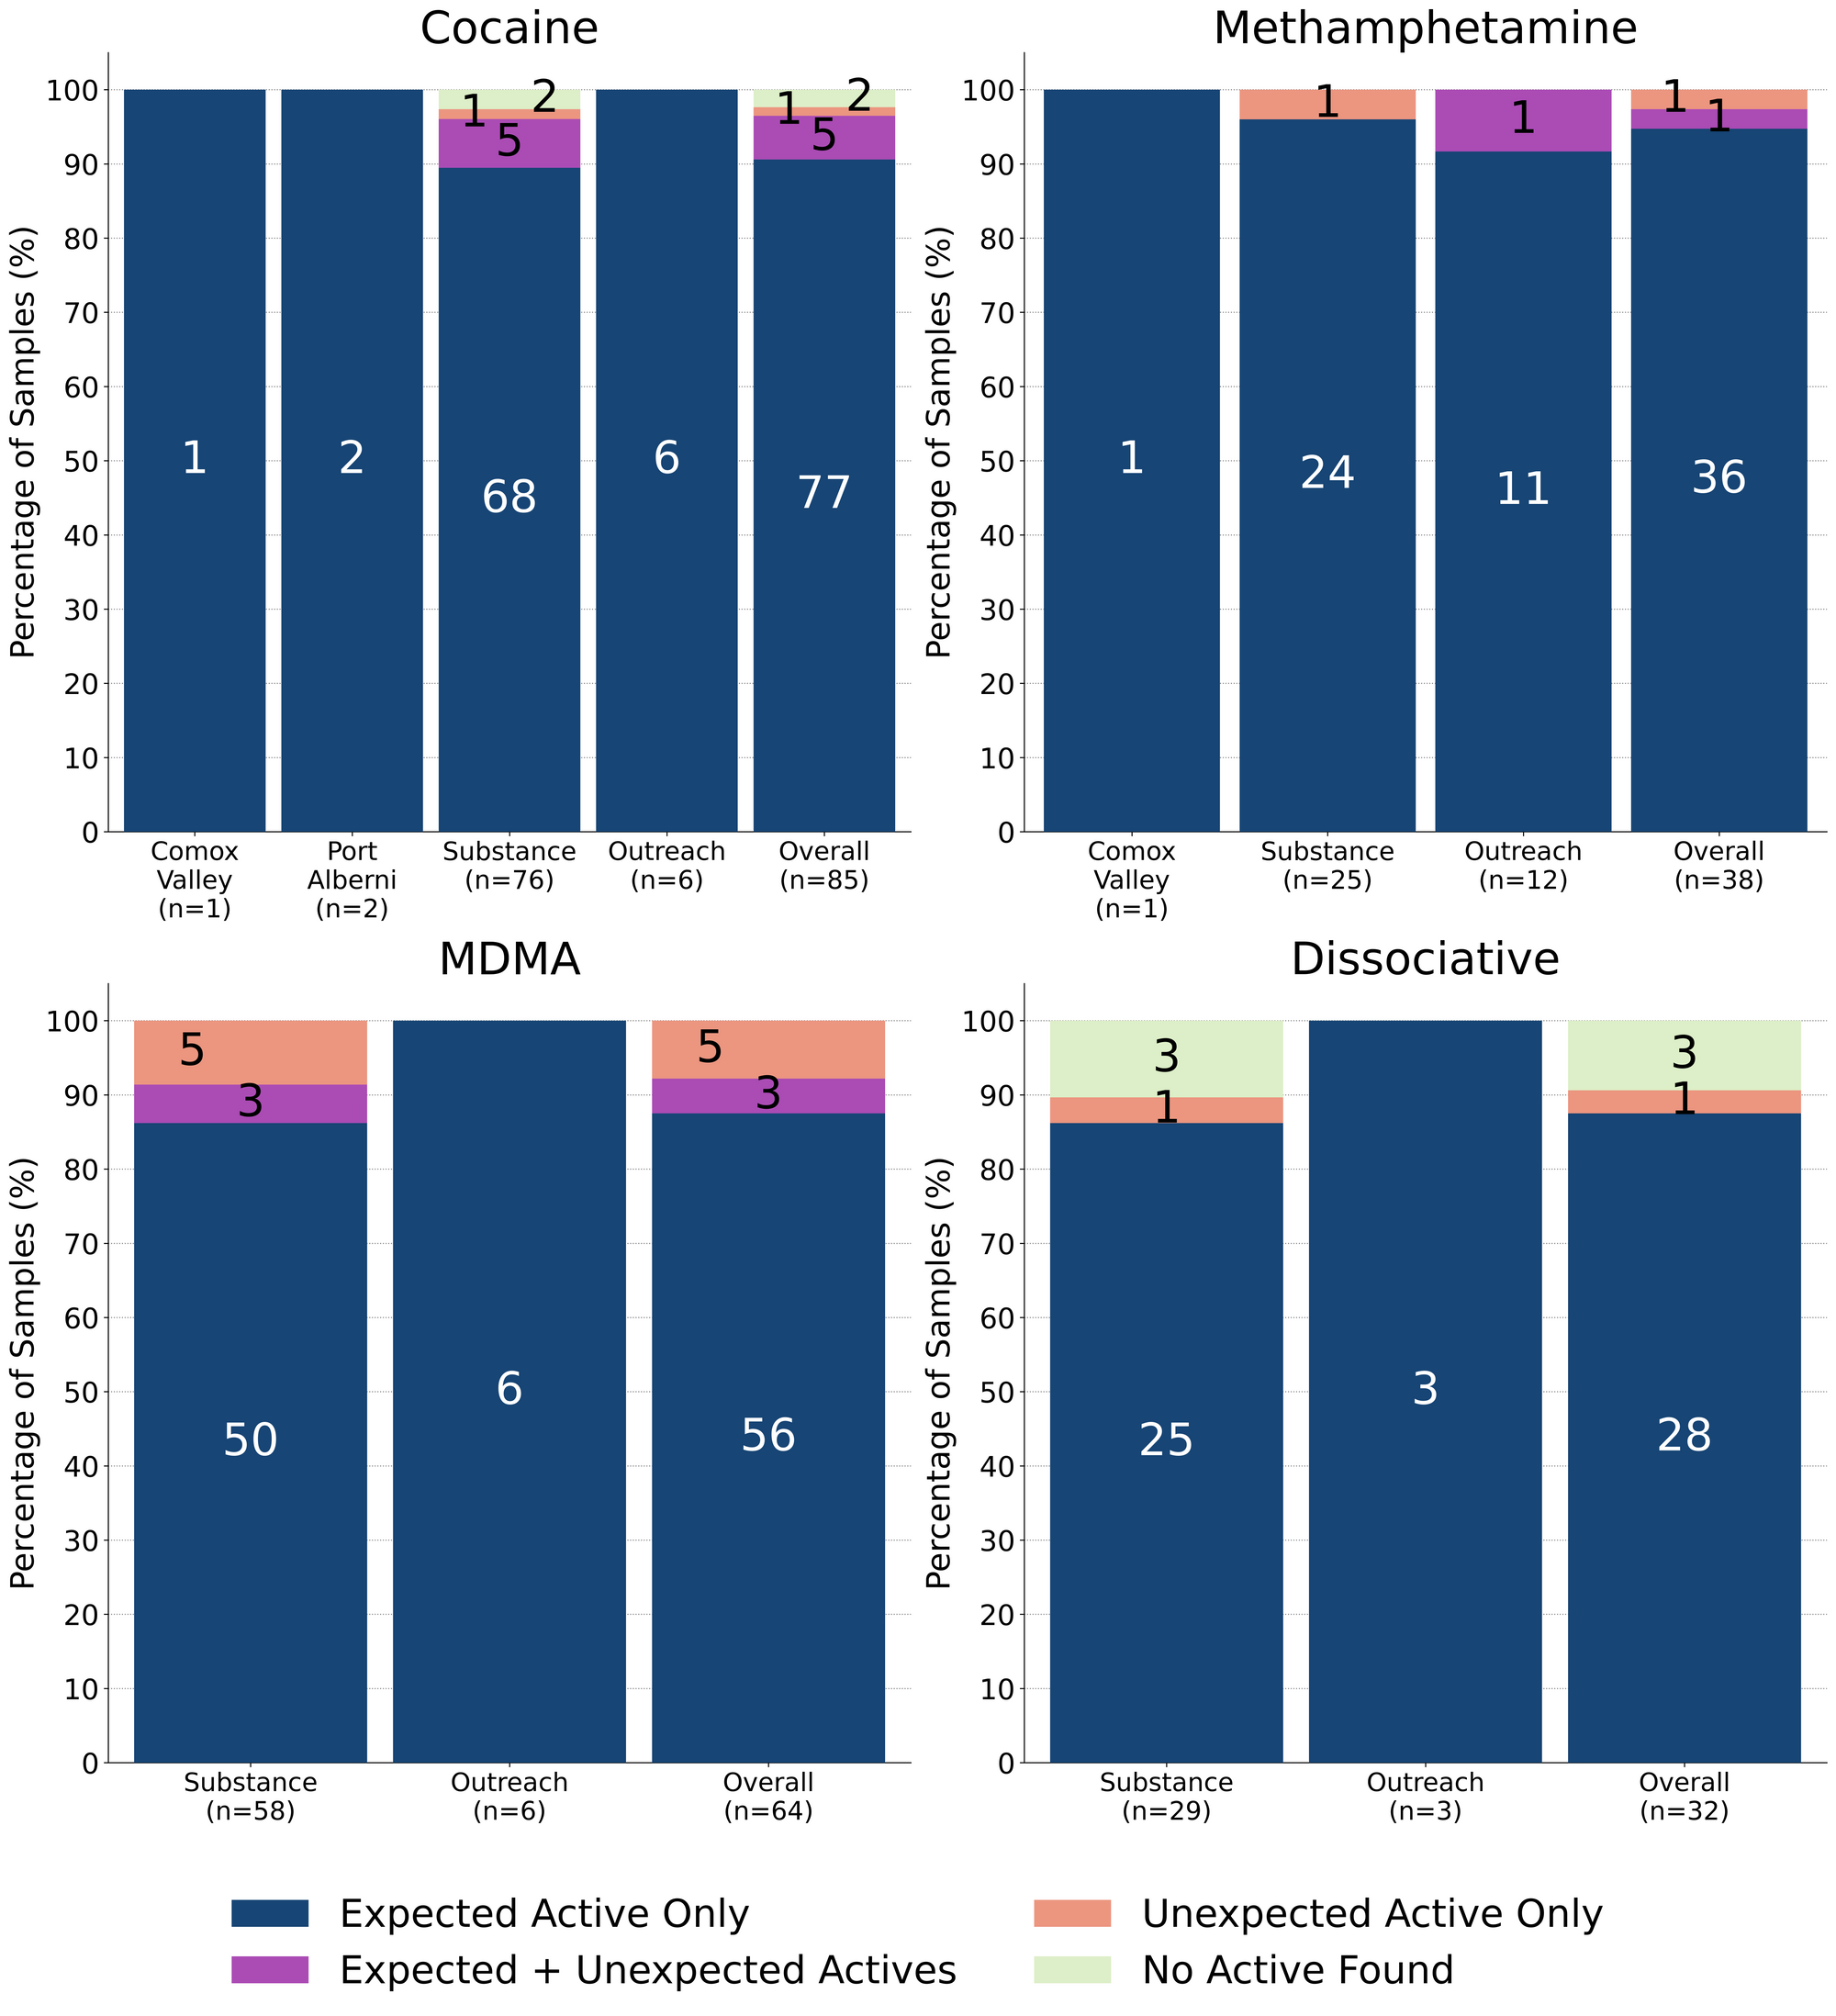
88% (56/64) of expected MDA/MDMA samples checked were confirmed to be the expected MDA/MDMA, with the MDMA-to-MDA mixup representing a majority of the remaining samples:
- 4 expected MDMA samples were found to just be MDA
- 1 expected MDMA sample were found to be ketamine instead
- 3 samples were found to contain both MDMA and MDA
Meth is meth! 95% (36/38) of expected methamphetamine samples checked in October, across all collection locations/methods, were found to be meth with no cuts or other active compounds detected. The remaining two samples were found to contain other active compounds beyond meth:
- One sample from Duncan was found to primarily be meth with a trace amount (0.2%) of fentanyl detected. This service user reported that they anticipated cross-contamination with fentanyl and that they wanted to verify their expectations.
- One sample from Victoria was found to contain no meth and instead was found to be a mix of fluorofentanyl and flubromazepam. This sample was residue collected from a pipe that was linked to multiple accidental poisoning events.
K is K! 90% (27/30) expected ketamine samples checked were confirmed to be ketamine with no other active compounds detected, though two of these samples were found to be cut with dimethyl sulfone (MSM, an inactive cut). The remaining three expected ketamine samples were found to just be sugar with no ketamine detected. A case of mistaken identity or a nightmare turned inside out? A simple baggie mixup or a sugary apocalypse? We may never find the answers, but you can be sure to find Rod-Serling-styled commentary about sample mix-ups in the Substance Blog.
Rounding out the dissociative class, an expected dextromethorphan (DXM) sample was confirmed to be DXM while an expected PCP sample was found to be 3-HO-PCP instead.
91% (77/85) of expected cocaine samples checked were confirmed to be cocaine with no detectable active adulterants. Inactive cuts (i.e. cutting agents without a psychoactive effect) were detected in only one cocaine-positive sample: an expected cocaine base sample from Victoria was found to be cut with around 70% sodium bicarbonate (baking soda).
5 samples contained an active component in addition to cocaine:
- Levamisole - 4 samples; an antihelminthic drug used to treat parasitic worm infections, commonly seen as a cut in cocaine
- Phenacetin - 1 sample; “super buff” a tylenol-like drug, commonly seen as a cut in cocaine
The remaining 3 expected cocaine samples were found to contain no cocaine: two samples from Victoria were just sodium bicarbonate and the remaining sample (also from Victoria) was found to be a mixture of 4% fentanyl and caffeine. Regarding the latter sample, the service user reported that they had already tried the sample and that the effects were more similar to what they expected from down than from what they expected from cocaine.
People often ask us about the value of post-consumption drug checking and cases like this are a great example that highlight some of the benefits. The knowledge gained from a post-consumption drug check can help one to understand an experience, can aid in avoiding future negative effects, can provide guidance to repeat positive experiences, and can support conversations between buyers and suppliers about product quality. People know their drugs and this service user was spot on with their suspicions about sample misrepresentation. The data that we extract from samples through spectroscopy and spectrometry are often drops in the bucket compared to the ocean of drug knowledge that people cultivate through lived experience; we believe that the union of these ways of knowing benefit the service user and the drug checker alike.
Benzodiazepines (n=20)
Autumnal October day, the present. Order of events: multiple drug checks from curious community members notating online purchases of pressed Xanax tabs. Then, the drug checks you’re about to witness, with two technicians verifying the results – but with nothing more enlightening to add beyond evidence of some microcrystalline cellulose statically adhered to the inside of a baggie. You've heard of trying to find a needle in a haystack? Well, stay with us now, and you'll be part of an investigating team whose mission is not to find that proverbial needle. No, their task is even harder. They've got to identify benzodiazepines within a complex powder matrix, and in just a moment you'll ponder with them, because you've just landed in the Substance Blog.
90% (18/20) of the benzodiazepine samples checked in October came to our service in the form of pressed pills; the remaining two samples were powders. 15 of the 18 pills were expected to be alprazolam (Xanax), two pills were expected to be lorazepam (Ativan), and one pill was expected to be diclazepam. The lorazepam and diclazepam pills were confirmed to contain their expected lorazepam and diclazepam, with no other actives detected.
Only one of the expected alprazolam tablets contained alprazolam, but this sample was also found to contain etizolam and flualprazolam as well. It is uncommon for us to find multiple benzos in a single sample, and this combination could result in heavily sedating effects with a very long duration of effect (on the order of 12-18 hours).
13 of the 14 other pressed pills were found to contain a benzo or benzo-related drug other than alprazolam:
- Flualprazolam - 9 samples. Flualprazolam is ~2x stronger than alprazolam in terms of dosage but has a similar duration of effect (5-8 hours)
- Etizolam - 2 samples. Etizolam is ~2x weaker than alprazolam in terms of dosage but has a similar duration of effect (5-8 hours)
- Bromazolam - 1 sample. Bromazolam is comparable in both strength and duration to alprazolam
- Undifferentiated benzodiazepine - 1 sample. This sample tested positive for benzos via the immunoassay strip test, but we could not identify which benzo was present with our other instruments
Due to instrumental issues and limited sample size, the remaining pressed pill did not yield any data that was useful in determining the sample’s composition.
Both of the powder samples were collected in Victoria; both were expected to be, and were confirmed to be bromazolam with no cuts or adulterants detected.
Opioid-Down (n=241)
Respectfully submitted for your perusal – the local opioid-down supply. Sample colours: every shade under the iridescent rainbow. Number of samples checked: in the neighbourhood of two hundred and forty. Origin: unknown. Composition? Therein hangs the tale, for in just a moment, we're going to ask you to shake hands, figuratively, with a spectrometer from another galaxy and another time. These are the opioid-down specific results of the Substance Blog.
In this section we present results specific to the opioid-down supply, therefore they may differ from the highlighted findings above that are inclusive of all expected drug categories.
- 87% of expected opioid-down samples contained fentanyl (210/241)
- 23 (10%) samples contained heroin, with a median concentration >80% and a range of 23% to >80%
- 5 samples contained carfentanil, with a median concentration of 0.25% and a range of 0.10% to 0.56%
- 46% of expected opioid-down samples contained a benzodiazepine and/or etizolam (111/241)
- Xylazine was detected in 3% (7/241) of opioid-down samples, with a median concentration of 0.2% and a range of 0.1% to 32.2%
This October, 68% of all opioid-down samples checked contained an additional active to the expected fentanyl. Examining Fig 3. we can see that the down supply has remained consistently inconsistent:
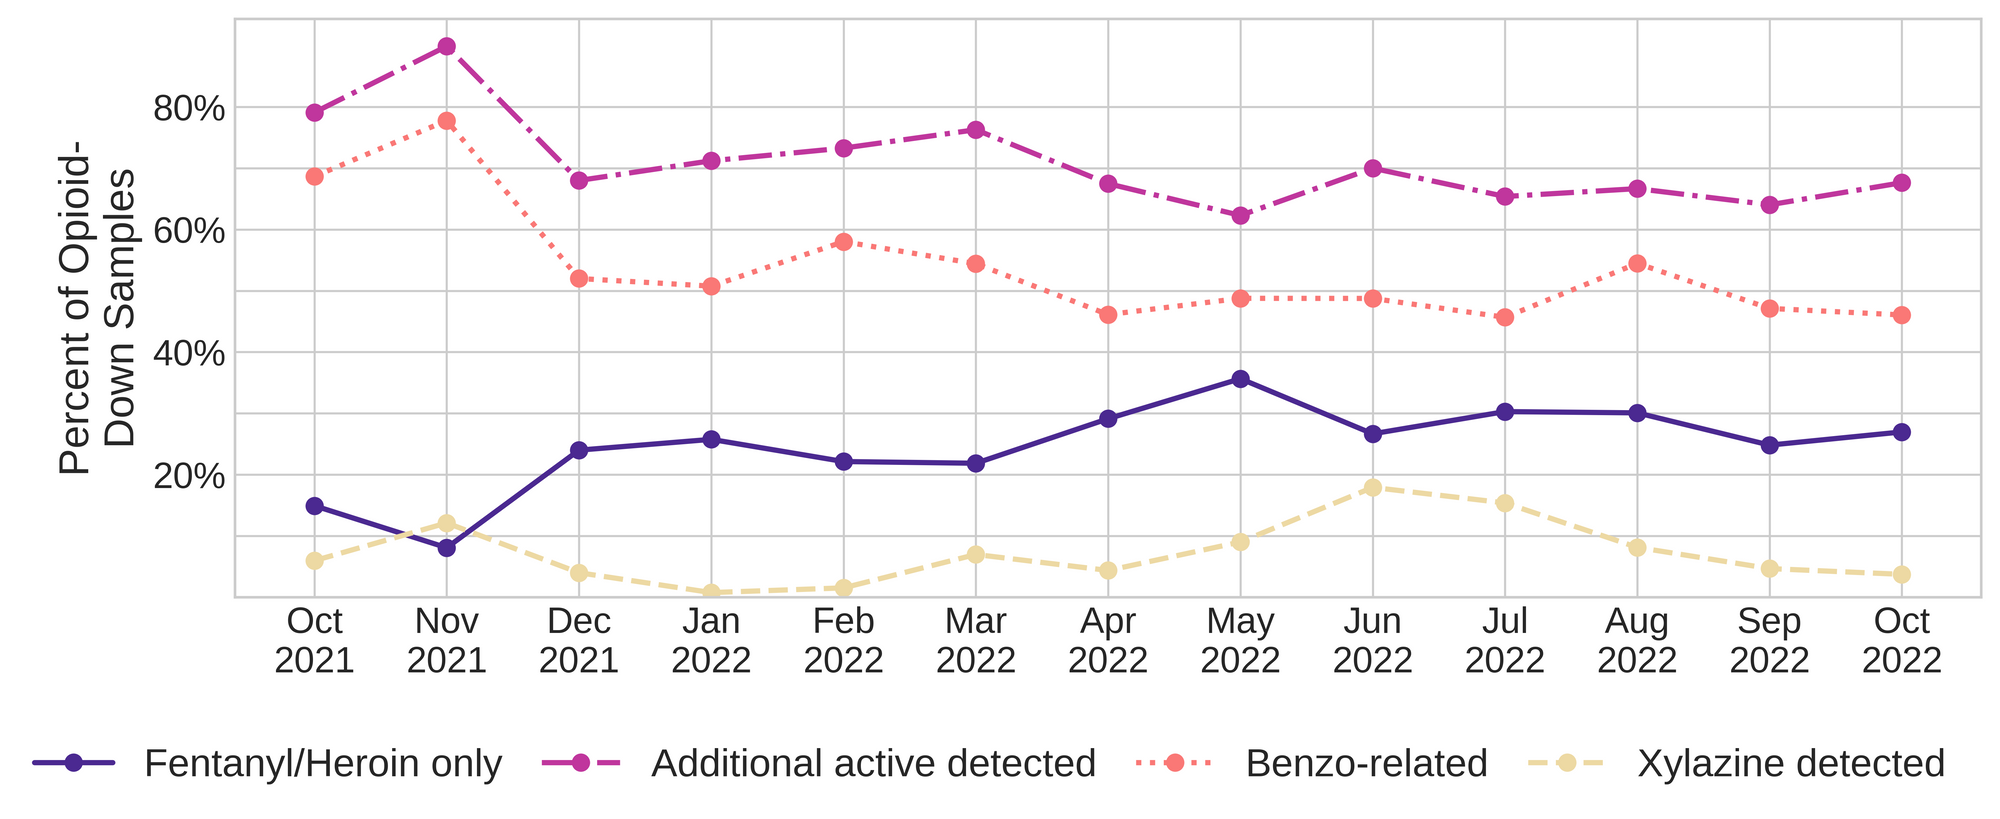
Benzo-related drugs remain the primary contributor to the additional actives found in expected opioid-down samples with 46% (111/241) of expected opioid-down samples checked containing a benzo-related drug.
Bromazolam continues to be the most common benzo seen in the down supply with 25% of opioid-down samples containing bromazolam in October (60/241). Unexpected fentanyl analogues like fluorofentanyl (88 samples), and the sedative xylazine (9 samples) represent a majority of the remaining adulterants, though scattered detections of other drugs are still found and can be reviewed in the pdf report at the end of this blog.
Over the past few months, we have been seeing an increase in the number of samples that contained heroin. Of the 23 heroin-positive down samples checked in October, a majority (78%, 18/23) were found to just contain heroin and related alkaloids/synthesis byproducts like acetylmorphine (MAM) and acetylcodeine. The remaining five heroin-positive down samples were found to be high potency polysubstance mixtures:
- Three samples, all light greyish-purple powders collected in Victoria, all had a similar composition of heroin at ~30%, fentanyl at ~20%, etizolam at >25%, lidocaine at ~5%, and acetylmorphine at ~1%.
- One minty green sample from Port Alberni was found to contain heroin at 25%, fentanyl at 11%, carfentanil at 0.56%, acetylcodeine at 1% and acetylmorphine at 1%.
- One purple and green sample from Victoria contained heroin at 23%, fentanyl at 27%, fluorofentanyl 1%, and trace amounts of acetylcodeine and bromazolam (less than 0.1% each).
Submitted for your disapproval: portraits of the unregulated drug market, proof positive that the opioid-down supply is as erratic and volatile as ever.
Proof also of something else: that despite four years of our best efforts to inform drug buyers and suppliers about their samples to encourage market intervention and stability, no matter how much evidence we collect to highlight how volatile the unregulated market is, no matter how many times we reiterate the recommendations from people who use drugs on solutions to the drug poisoning crisis, until safe supply is accessible for all and prohibition is ended, the drug supply will remain unpredictable and unstable.
Policy maker’s potential to enact meaningful, life saving changes continues, as always, to be stifled by their milquetoast political ambitions and their blatant disregard for human wellness (considering that 5-6 people continue to die every day in so-called British Columbia as a result of drug poisoning, a rate that appears to still be increasing even six years after the declaration of the public health emergency). Their mediocrity and inaction continues to exacerbate harms against, perpetuate stigma towards, and outright kill, people who use drugs. All for which countless condemnations and unwavering calls for accessible safe supply are rendered from the Substance Blog.
Quantification for Expected Opioid-Down[1]
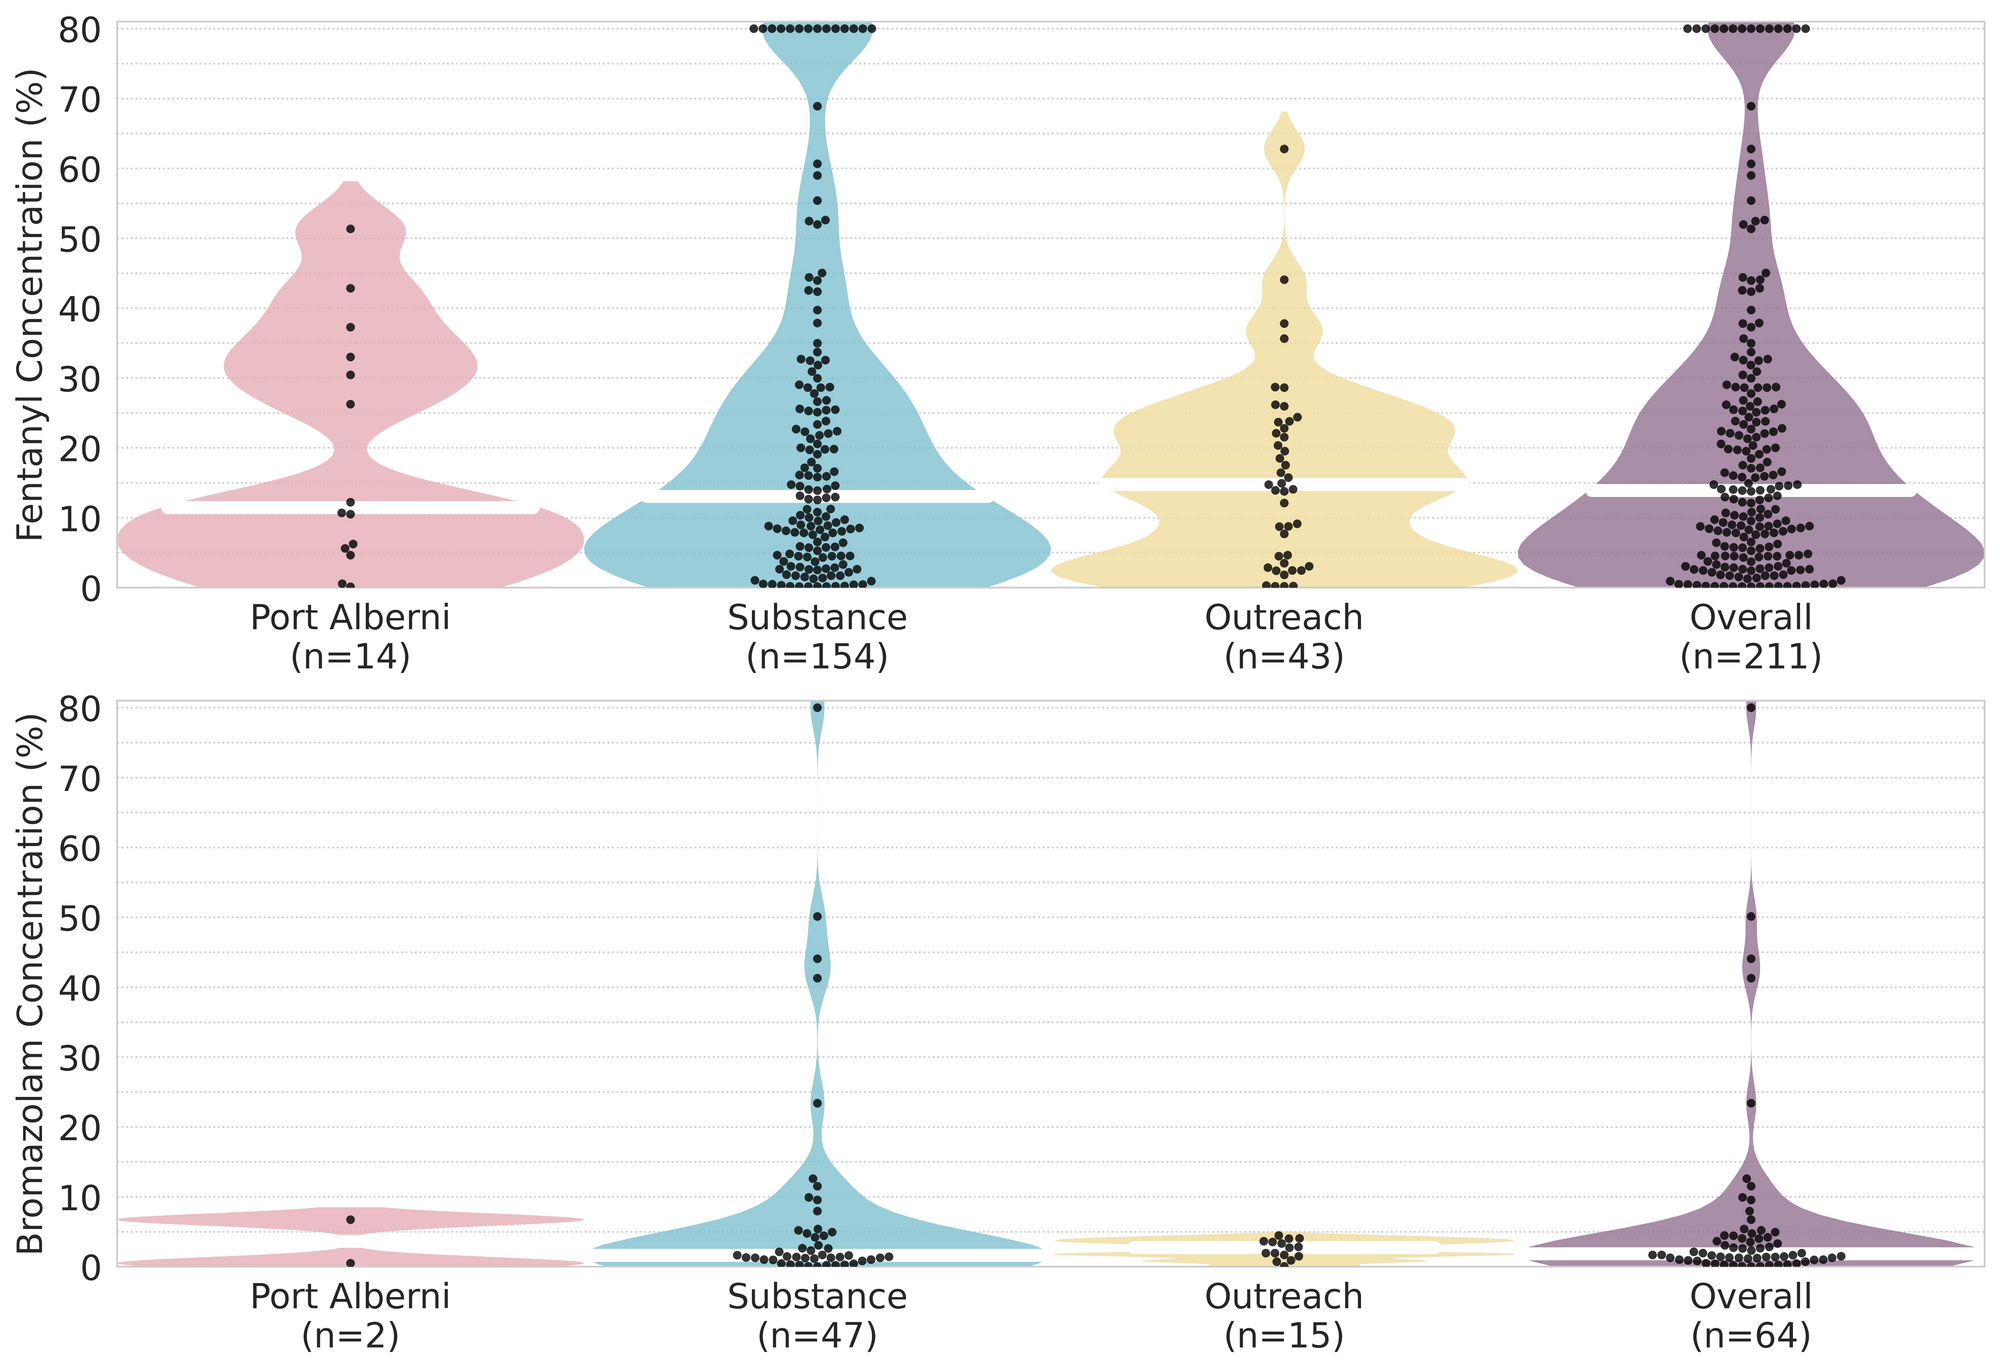
In October, we quantified fentanyl for 199 of the expected opioid-down samples containing fentanyl and found the median concentration to be 14.1%[2] with the average strength of fentanyl we normally see being around 15%. Though the median is a useful indicator, it doesn’t capture the volatility of fentanyl concentrations present in the opioid supply, as any one sample might be the lowest strength (0.1%) or the strongest (>80%[3]) Similarly, the concentration of bromazolam, our ongoing benzo-representative, was across the board in expected opioid down samples, ranging from 0.1% to 50.1% , with a median of 1.7%.
Not all opioid down samples brought to our service can be quantified. This is primarily due to too limited sample collected for our instruments to report a reliable mass percentage. Nevertheless, qualitative detection is still possible. ↩︎
This number is specific to fentanyl quantified in opioid-down samples. The median concentration listed in the Key Findings at the beginning of this blog (13.9%) is inclusive of all samples checked, across all drug classes, that contained fentanyl. ↩︎
For samples that contain more than 80% fenanyl, or more than 25% etizolam by weight, our mass spectrometer is presently unable to reproducibly assign a concentration due to the upper limits of the calibration methods currently adopted. ↩︎

The fentanyl and bromazolam concentrations that we quantified in October across all expected drug categories, are presented in Fig. 4. Black dots are individual opioid-down samples, Horizontal white bars show the median concentrations of fentanyl and bromazolam quantified, the width of the shaded regions mirrors the number of samples at a given concentration.
Final comment: you take this with a grain of salt or a shovelful of earth, as sugar or Substance, we leave it up to you. And for any further research check under 'R’ for Reports in the Substance Blog.
Want to be notified when we release these reports? Join our mailing list to receive updates about when our reports are out. You can subscribe and unsubscribe yourself from this list at any time.
Check back next month for the November report!
As always, send us feedback at substance@uvic.ca for how we can continue to offer our drug checking results in a useful way.