October 2021 Monthly Report

In this blog post we discuss our October 2021 report and provide more information on how to interpret the results. The PDF report can be found at the end.
Key findings:
- No carfentanil was seen in the month of October
- 94% of expected opioid-down samples contained fentanyl
- Median fentanyl concentration found of 9.0%, with a maximum over 80% found in an expected opioid-down sample
- Benzodiazepines and/or etizolam found in 69% of expected opioid-down samples
- The maximum concentration of etizolam found was 39.2% in an expected opioid-down sample
- Four expected opioid-down samples contained xylazine
Insight for the October 2021 Monthly Report
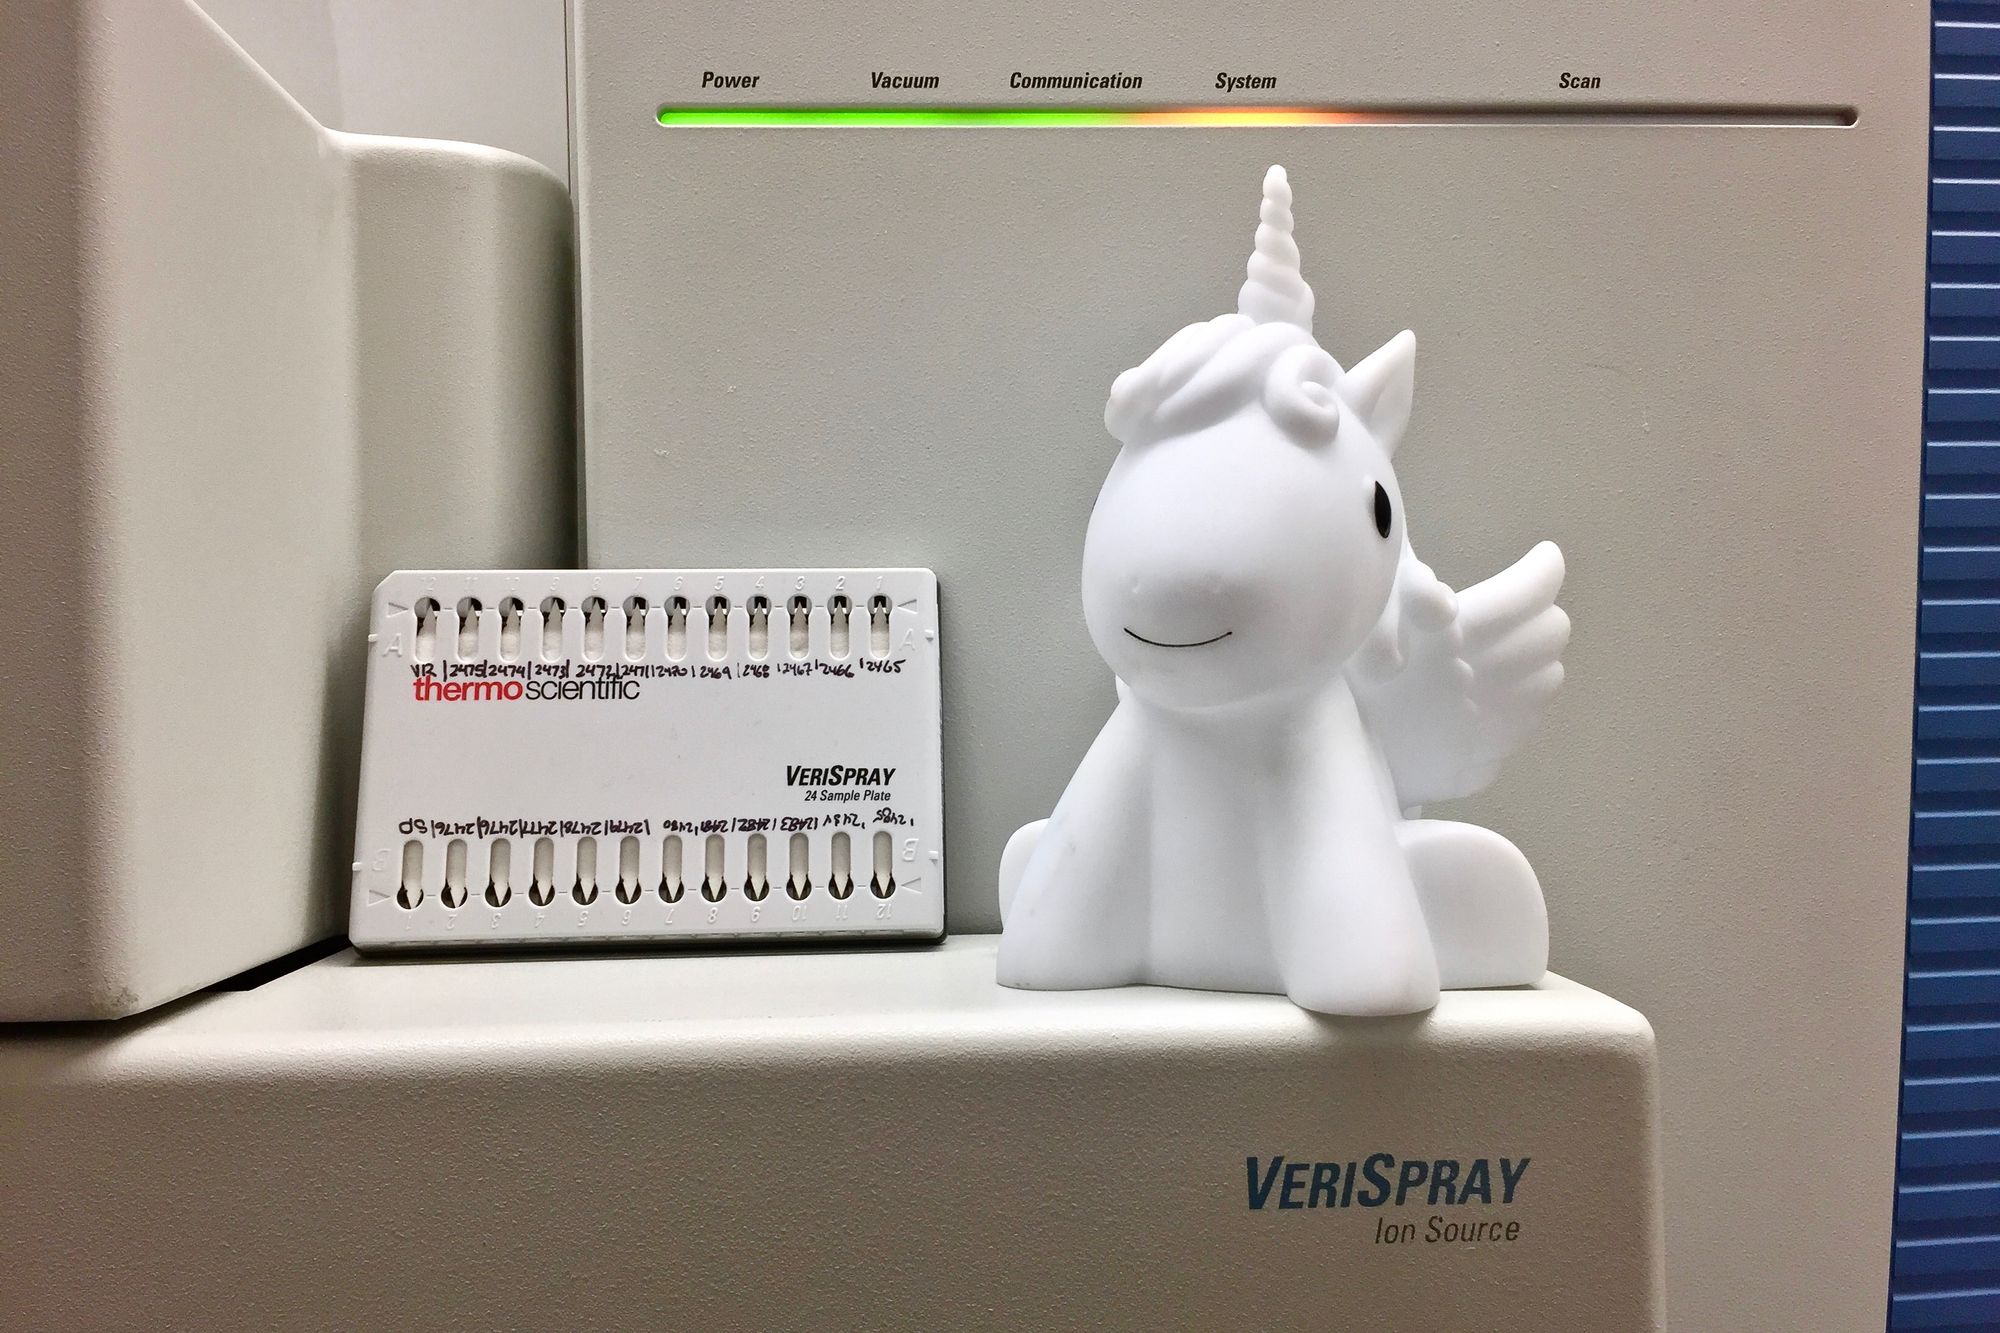
Ah, October. Fruiting fungi and fiery falling foliage further fulfill a flannel-clad Fall aesthetic while whispers of witches and wraiths waft on whirling winds. While it is fair to feel a little frightened in October, especially in regards to an unregulated drug supply, we have exciting news that will hopefully replace some distress and doubts with detailed information about the drug samples we check: a paper spray mass spectrometer (PS-MS) is now in house!
The PS-MS, lovingly nicknamed Matilda, previously lived up in Nanaimo with Dr. Chris Gill and his team at Vancouver Island University, and has been used for our confirmatory testing the past year. Those of you who have visited Substance this past month have undoubtedly met Matilda and have listened to it sing us the song of its people: the incessant whirr of the turbo pump and the monosyllabic freestyle rap of the solvent wetting procedure - “wheh-wheh-wheh-wheh...”
Aside from it’s dashing dishwasher-like appearance and smooth sonic stylings, the PS-MS is an invaluable asset within our suite of technologies. Capable of providing precision concentrations for 94 substances in a manner of minutes, and additionally able to identify thousands of other substances when library mass spectra exist, we are ecstatic to have the PS-MS on site.
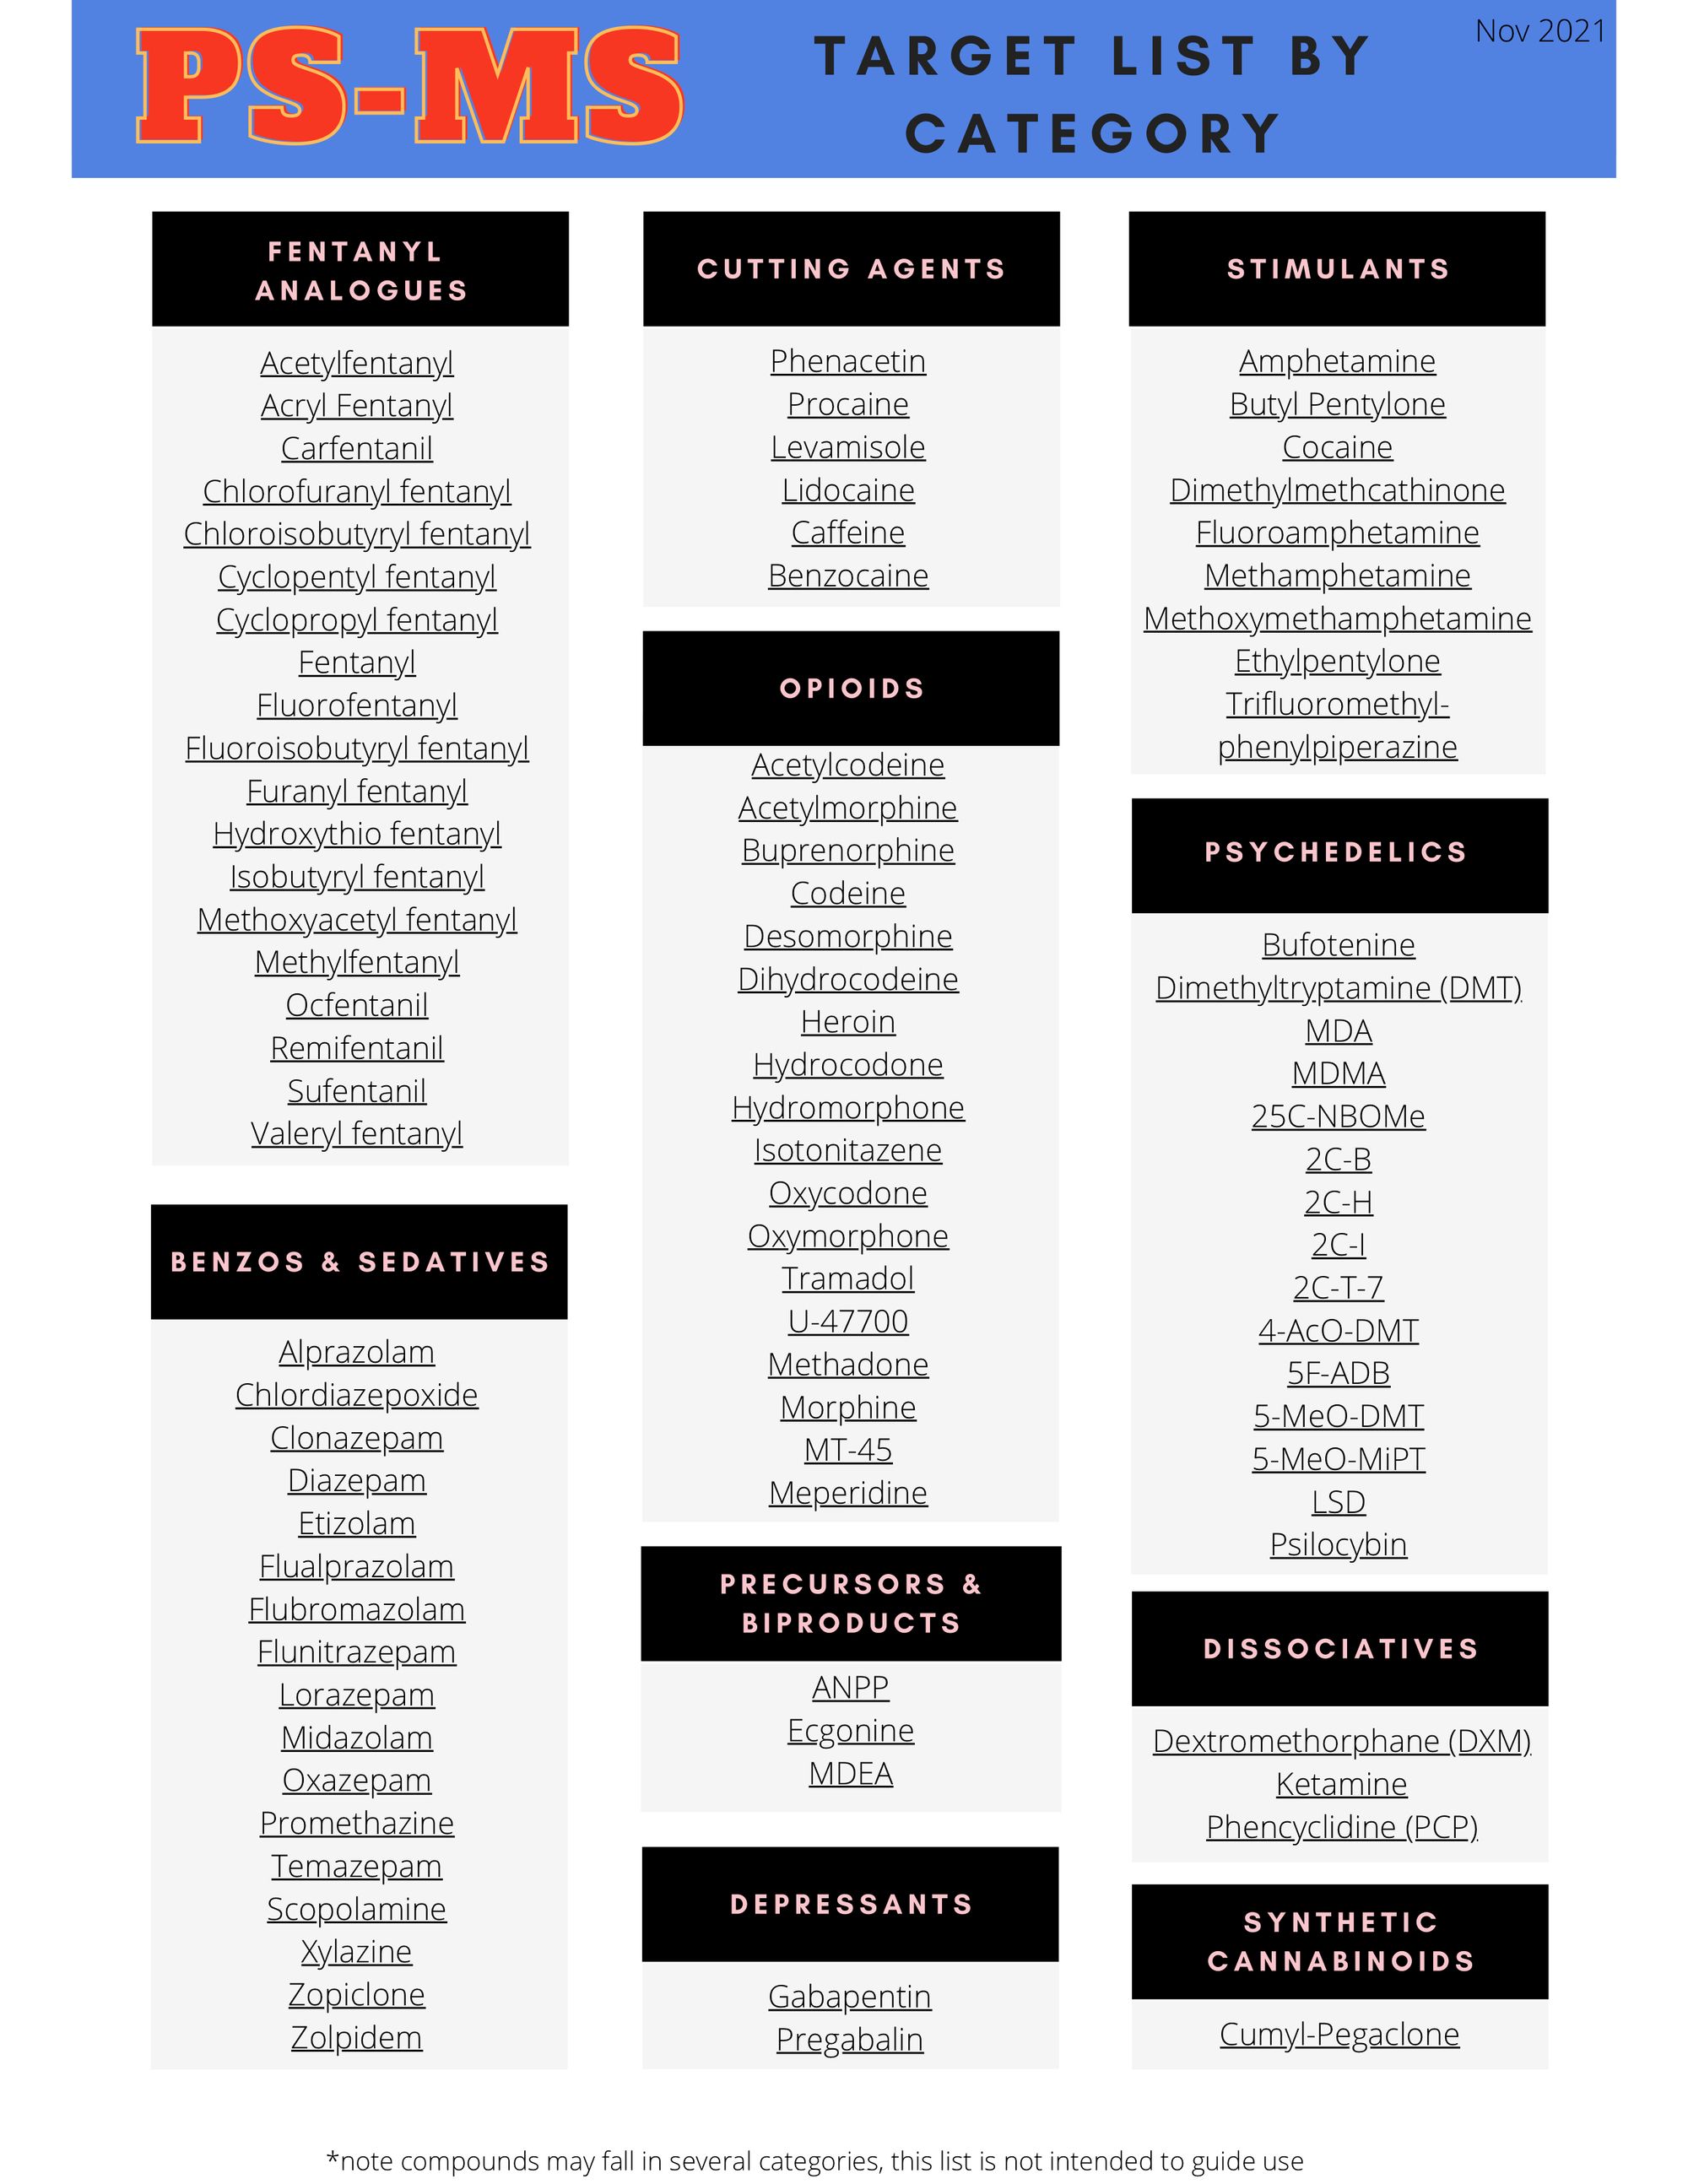
There are still limitations to the instrument in what it cannot detect, especially in regards to novel research chemicals and bulk cutting agents (where our FTIR and Raman instruments excel), but the ability to detect low concentration drugs, such as carfentanil, down to ~0.01% concentration by weight, is unmatched. A complete list of the quantifiable drugs within our target suite is given below.
An extraordinary amount of gratitude goes to Dr. Gill’s team for their exquisite work this past year, running samples and developing the methods needed for us to hit the ground running with the PS-MS. We look forward to continued collaboration with, and guidance from, our friends at VIU to explore what Matilda is fully capable of.
Back to your usual programming:
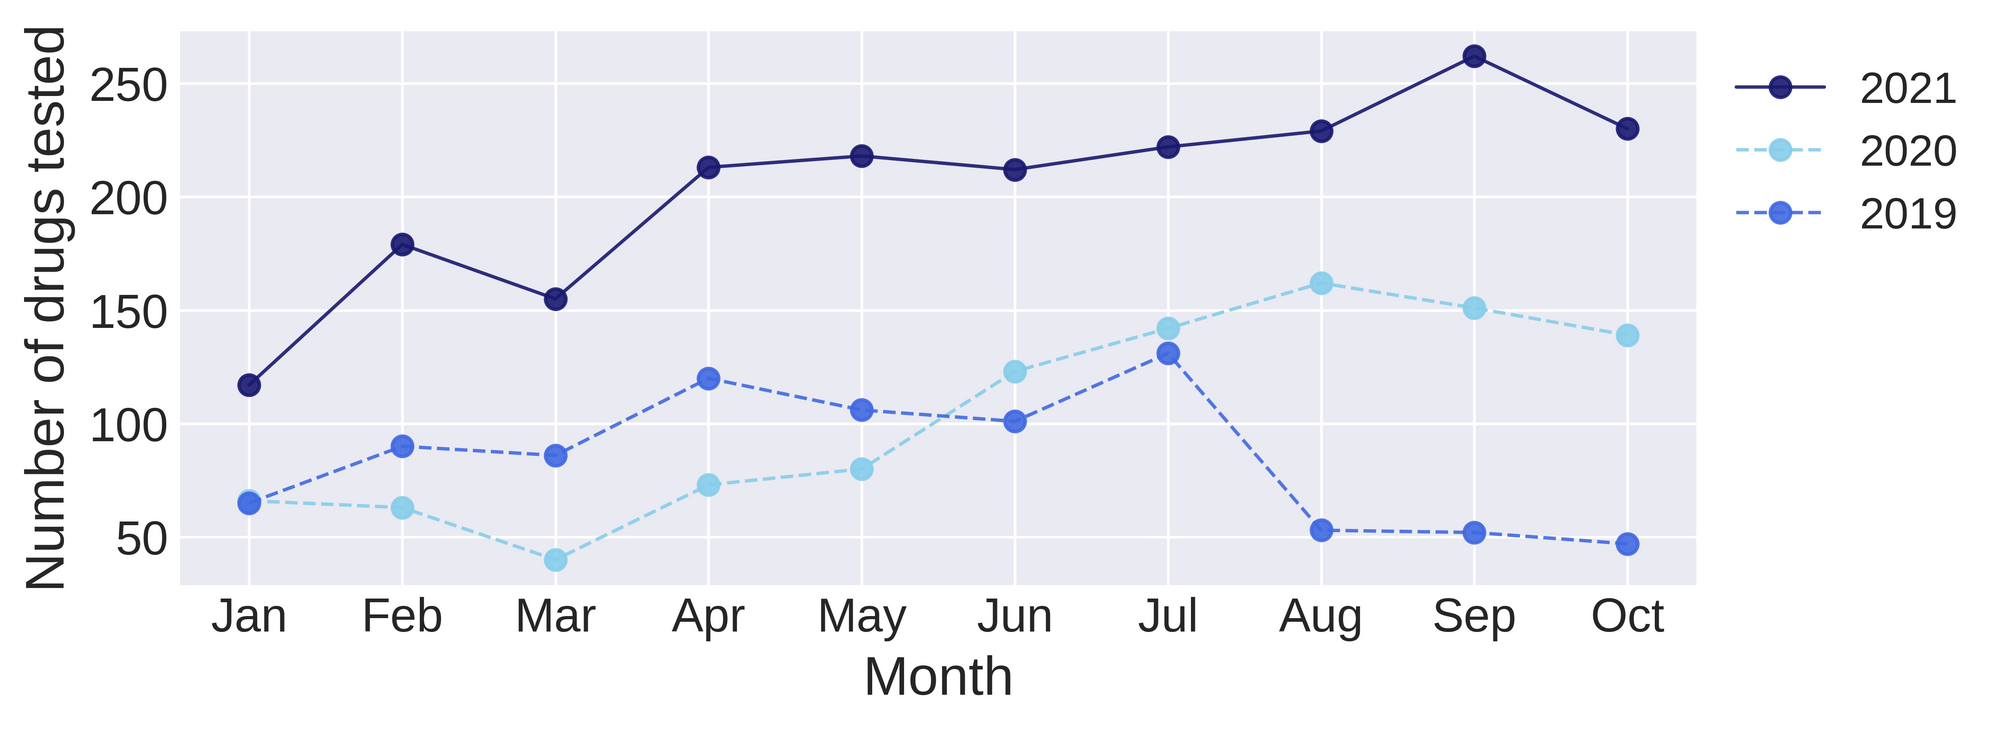
230 samples were checked at Substance in October, a 166% increase from October 2020.
Drug types
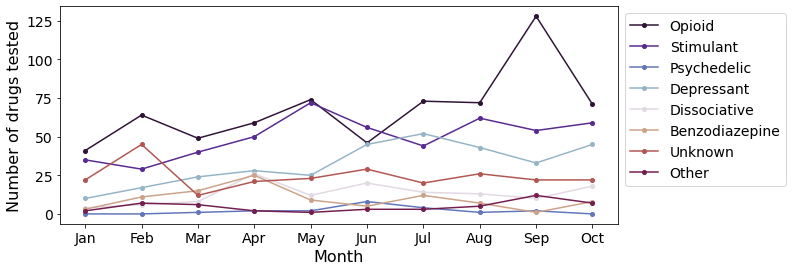
October showed us everything from cryptic sounding tryptamines, to mysterious monikers for methamphetamine-like drugs, to etizolam’s eerie essence. Fig. 2 shows the prevalence of each expected drug category checked so far this year, with opioids and stimulants continuing to be our most common samples checked. September’s surge in opioids occurs to have returned to ordinary operations in October.
Demonic delinquents in the drugs? Ha! We ain't afraid of no ghosts.
Despite October’s spooky ambiance, there are surprisingly few ghouls lurking in the drug supply once you turn on a light...or laser...or mass spectrometer. For most samples, we actually confirm that the expected drug was indeed the only expected active and that no additional cutting agents were present. The pie charts below highlight a few classes of drugs, differentiating samples when only the expected active was found from situations when other unexpected components were detected.
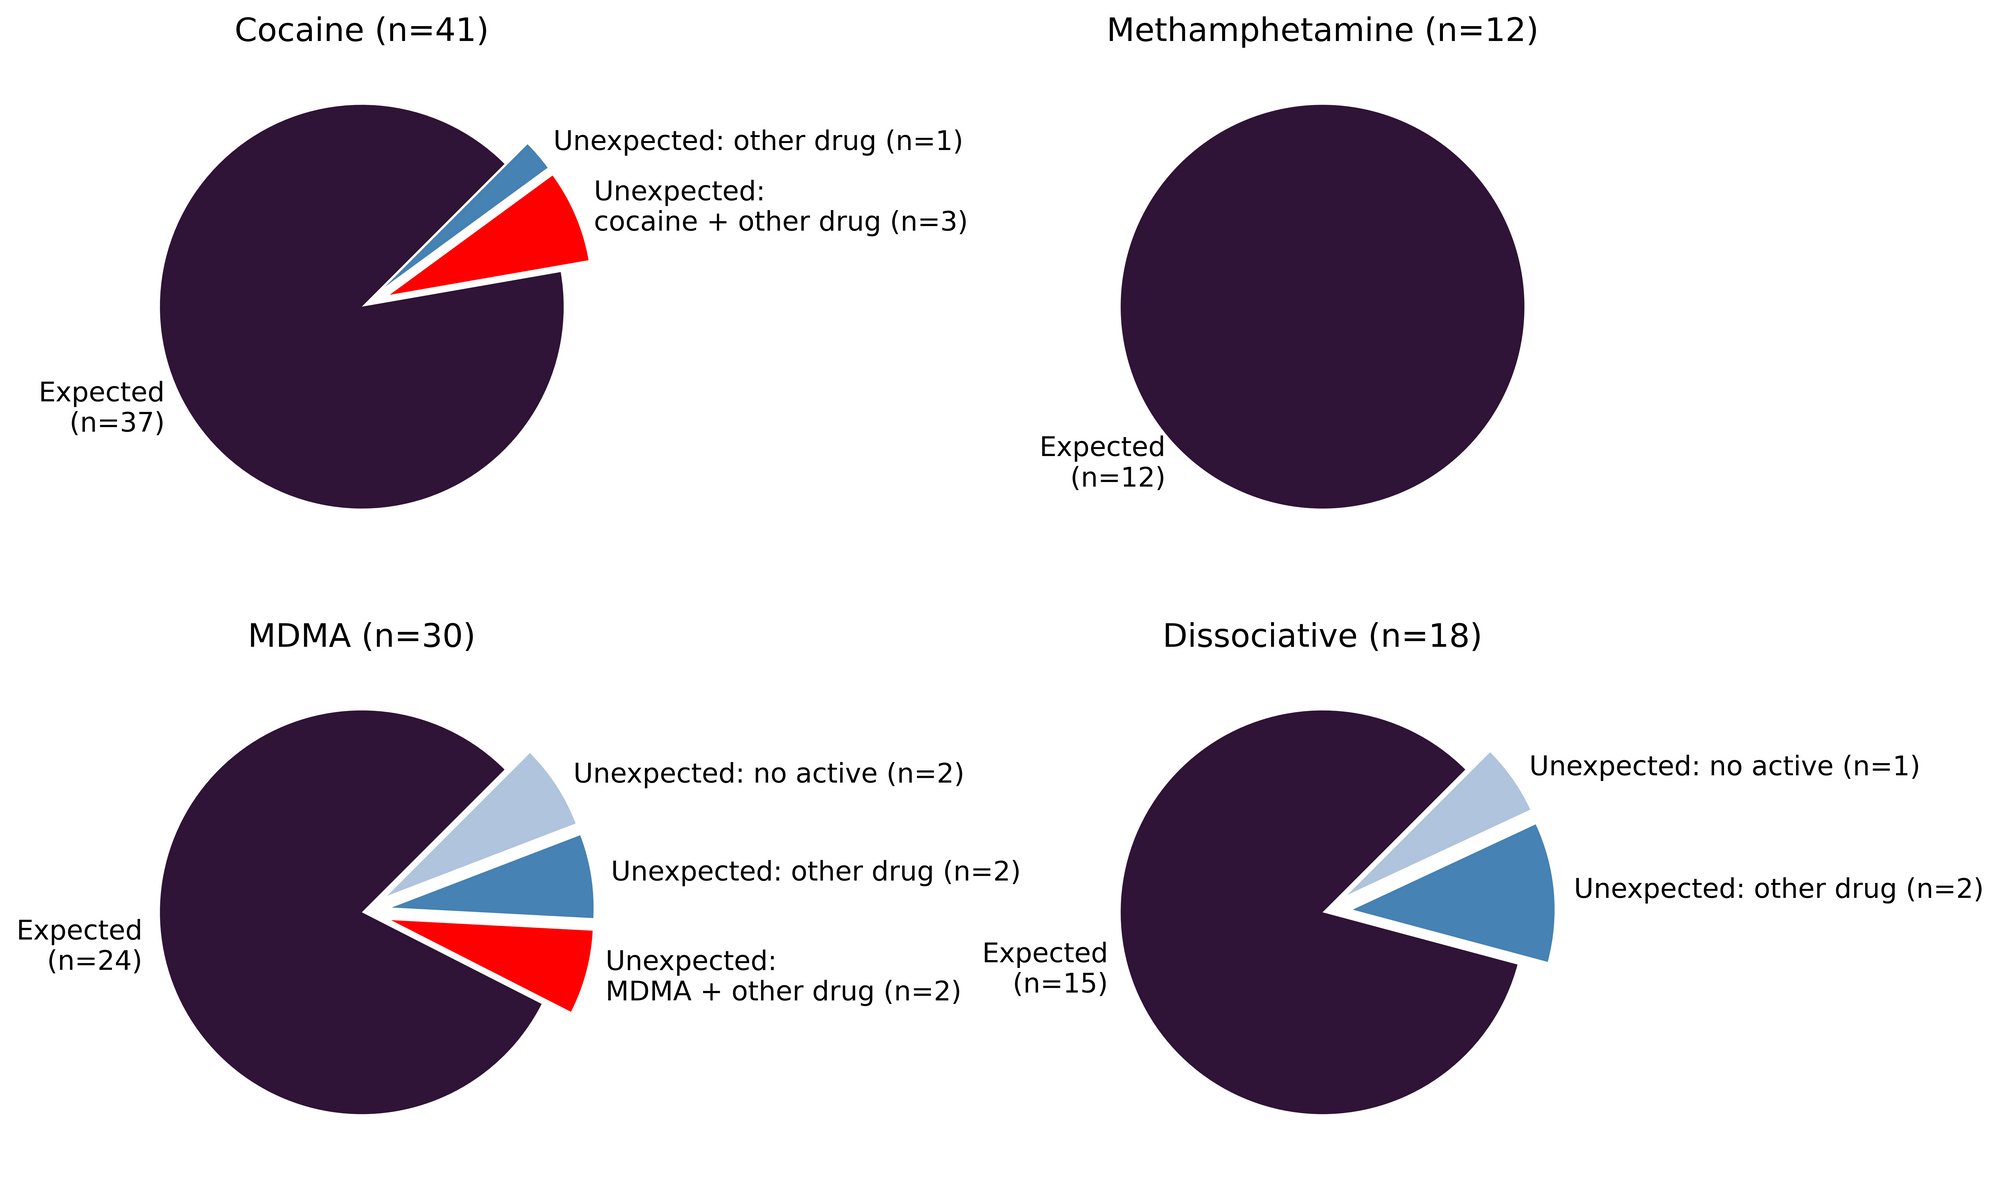
41 expected cocaine samples were checked in October, and 90% were found to only contain cocaine (or cocaine base) as a single ingredient. The remaining four samples contained the following buffs: levamisole (three samples; an antihelminthic drug commonly seen as a cut in cocaine base) and pantoprazole (one sample; a medication used to treat stomach ulcers).
Meth continues to be meth! All 12 expected methamphetamine samples checked in October were found to be meth as a single ingredient. No shadowy figures to be found.
80% (24/30) of the expected MDA/MDMA samples checked were found to be MDA/MDMA as a single ingredient. One expected MDMA sample was found to contain just MDA, while one expected MDA sample was found to be MDMA. One expected MDMA sample contained both MDMA and MDA, and another expected MDMA sample contained MDMA and cocaine. The remaining two samples did not contain any active compounds.
Spotlight Sample 1:
A curious quartz-like crystal - a phantasmic purple palantír - gaze deeply into its stormy structure and recite your enchanted incantations before you swallow its sympathetic spells and summon a session of swaying and swinging to saccharine, soulful sounds with your fellow sorcerers. This beautiful crystal was found to be MDMA as a single ingredient.
Ketamine was found as the only active in 88% (15/17) ketamine samples checked. One expected ketamine sample contained methamphetamine as a single component (confirming the service user’s seasoned assessment as suspicion), and the remaining expected ketamine sample contained no active. An expected O-PCE (a.k.a eticyclidone, a dissociative arylcyclohexylamine closely related to ketamine) sample was found to contain its chemical cousin O-PCM.
Benzodiazepines (n=8)
Eight samples were brought to our service that were expected to be a benzodiazepine as a single ingredient; all eight were in the form of pressed tablets. Three samples contained the expected benzodiazepine (two alprazolam samples and a flualprazolam sample), two expected alprazolam contained a different benzo (flualprazolam and etizolam), two samples were only identified as benzo-postive via the benzodiazepine immunoassay strip test, and one sample did not contain any identifiable active.
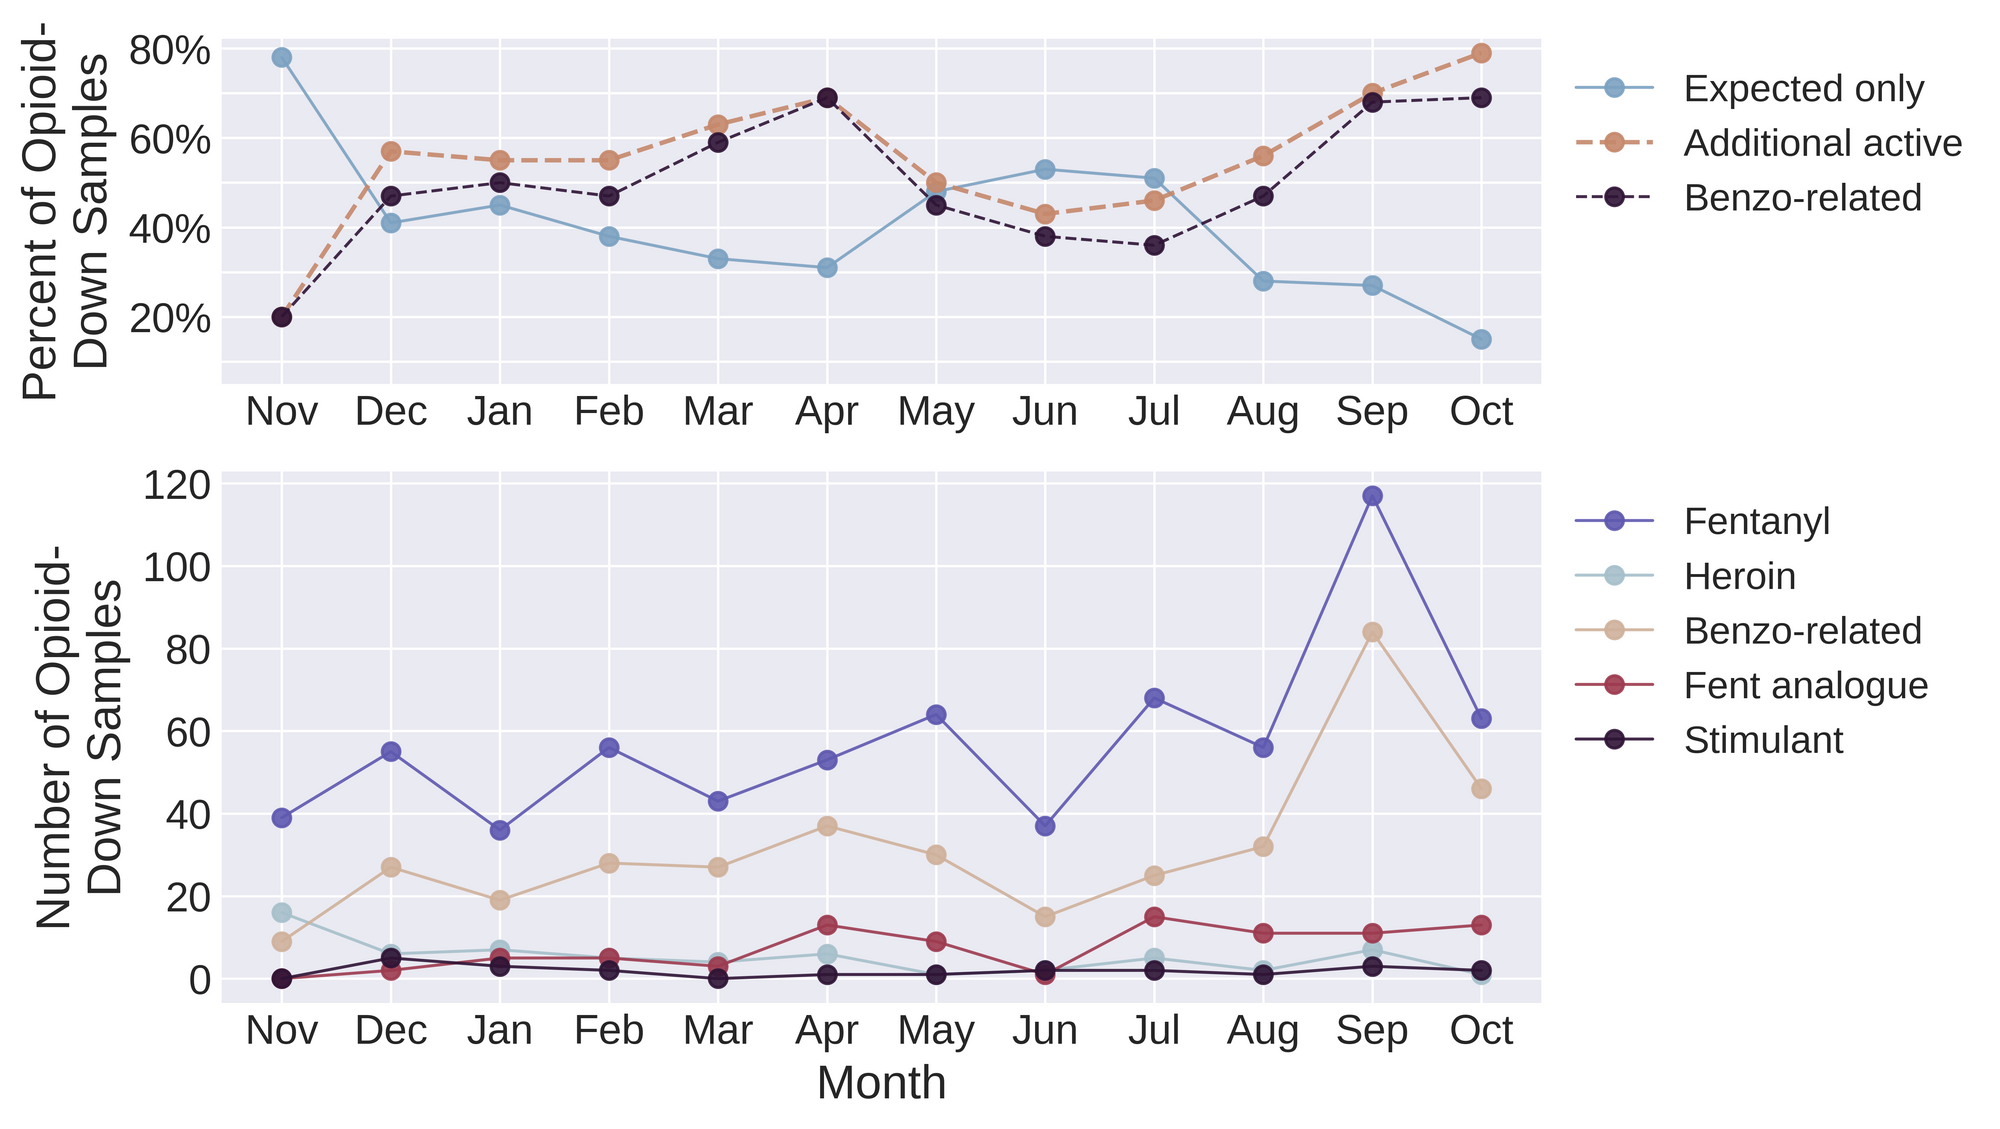
Opioid-Down (n=67)
In this section we present statistics specific to the opioid-down supply, therefore they may differ from the highlighted findings above that are inclusive of all expected drug categories.
- 94% expected opioid-down samples contained fentanyl (63/67)
- No samples contained carfentanil in the month of October
- Eight samples contained fluorofentanyl (12%)
- 69% samples contained a benzo and/or etizolam (46/67)
This October, 79% of opioid down samples contained an additional active to the expected fentanyl and/or heroin, with benzo-related drugs being the major contributor. This category represents the complex opioid down supply when adulterants are present, which is different from misrepresented samples where no expected active is found.
Figure 4 illustrates the consistently high percentage of adulterants found in opioid down over time, highlighting the ever-changing conditions of prohibited markets.
Spotlight Samples 2:
Xylazine was seen in four expected opioid-down samples. Despite the name sounding like it could be a self-published booklet by the loving fans of carpenter bees (genus Xylocopa), Xylazine is a non-narcotic clonidine analogue used in veterinary medicine for general anesthesia, sedation, and analgesia. While not intended for human use, it’s sedative properties have made it a drug of choice. When used in tandem with opioids and/or benzos, severe respiratory depression can result, increasing the risk of overdose. More information about the presence of Xylazine in the opioid supply can be found here and the references therein.
If there are any haunting spectres seen at our service, it is the disembodied presence of the policy responsible for allowing a volatile and inconsistent supply to exist as long as it has. The unacceptably slow pace of policy change to address the needs of people who use drugs, and to alleviate a toxic drug supply, is far more unsettling and upsetting than the identity of any of the substances we check at Substance.
People who use drugs have been pointing to the remedies to this unregulated supply for years, with calls for safer supply and decriminalization as effective interventions in the unregulated market. It’s long past time we listen.
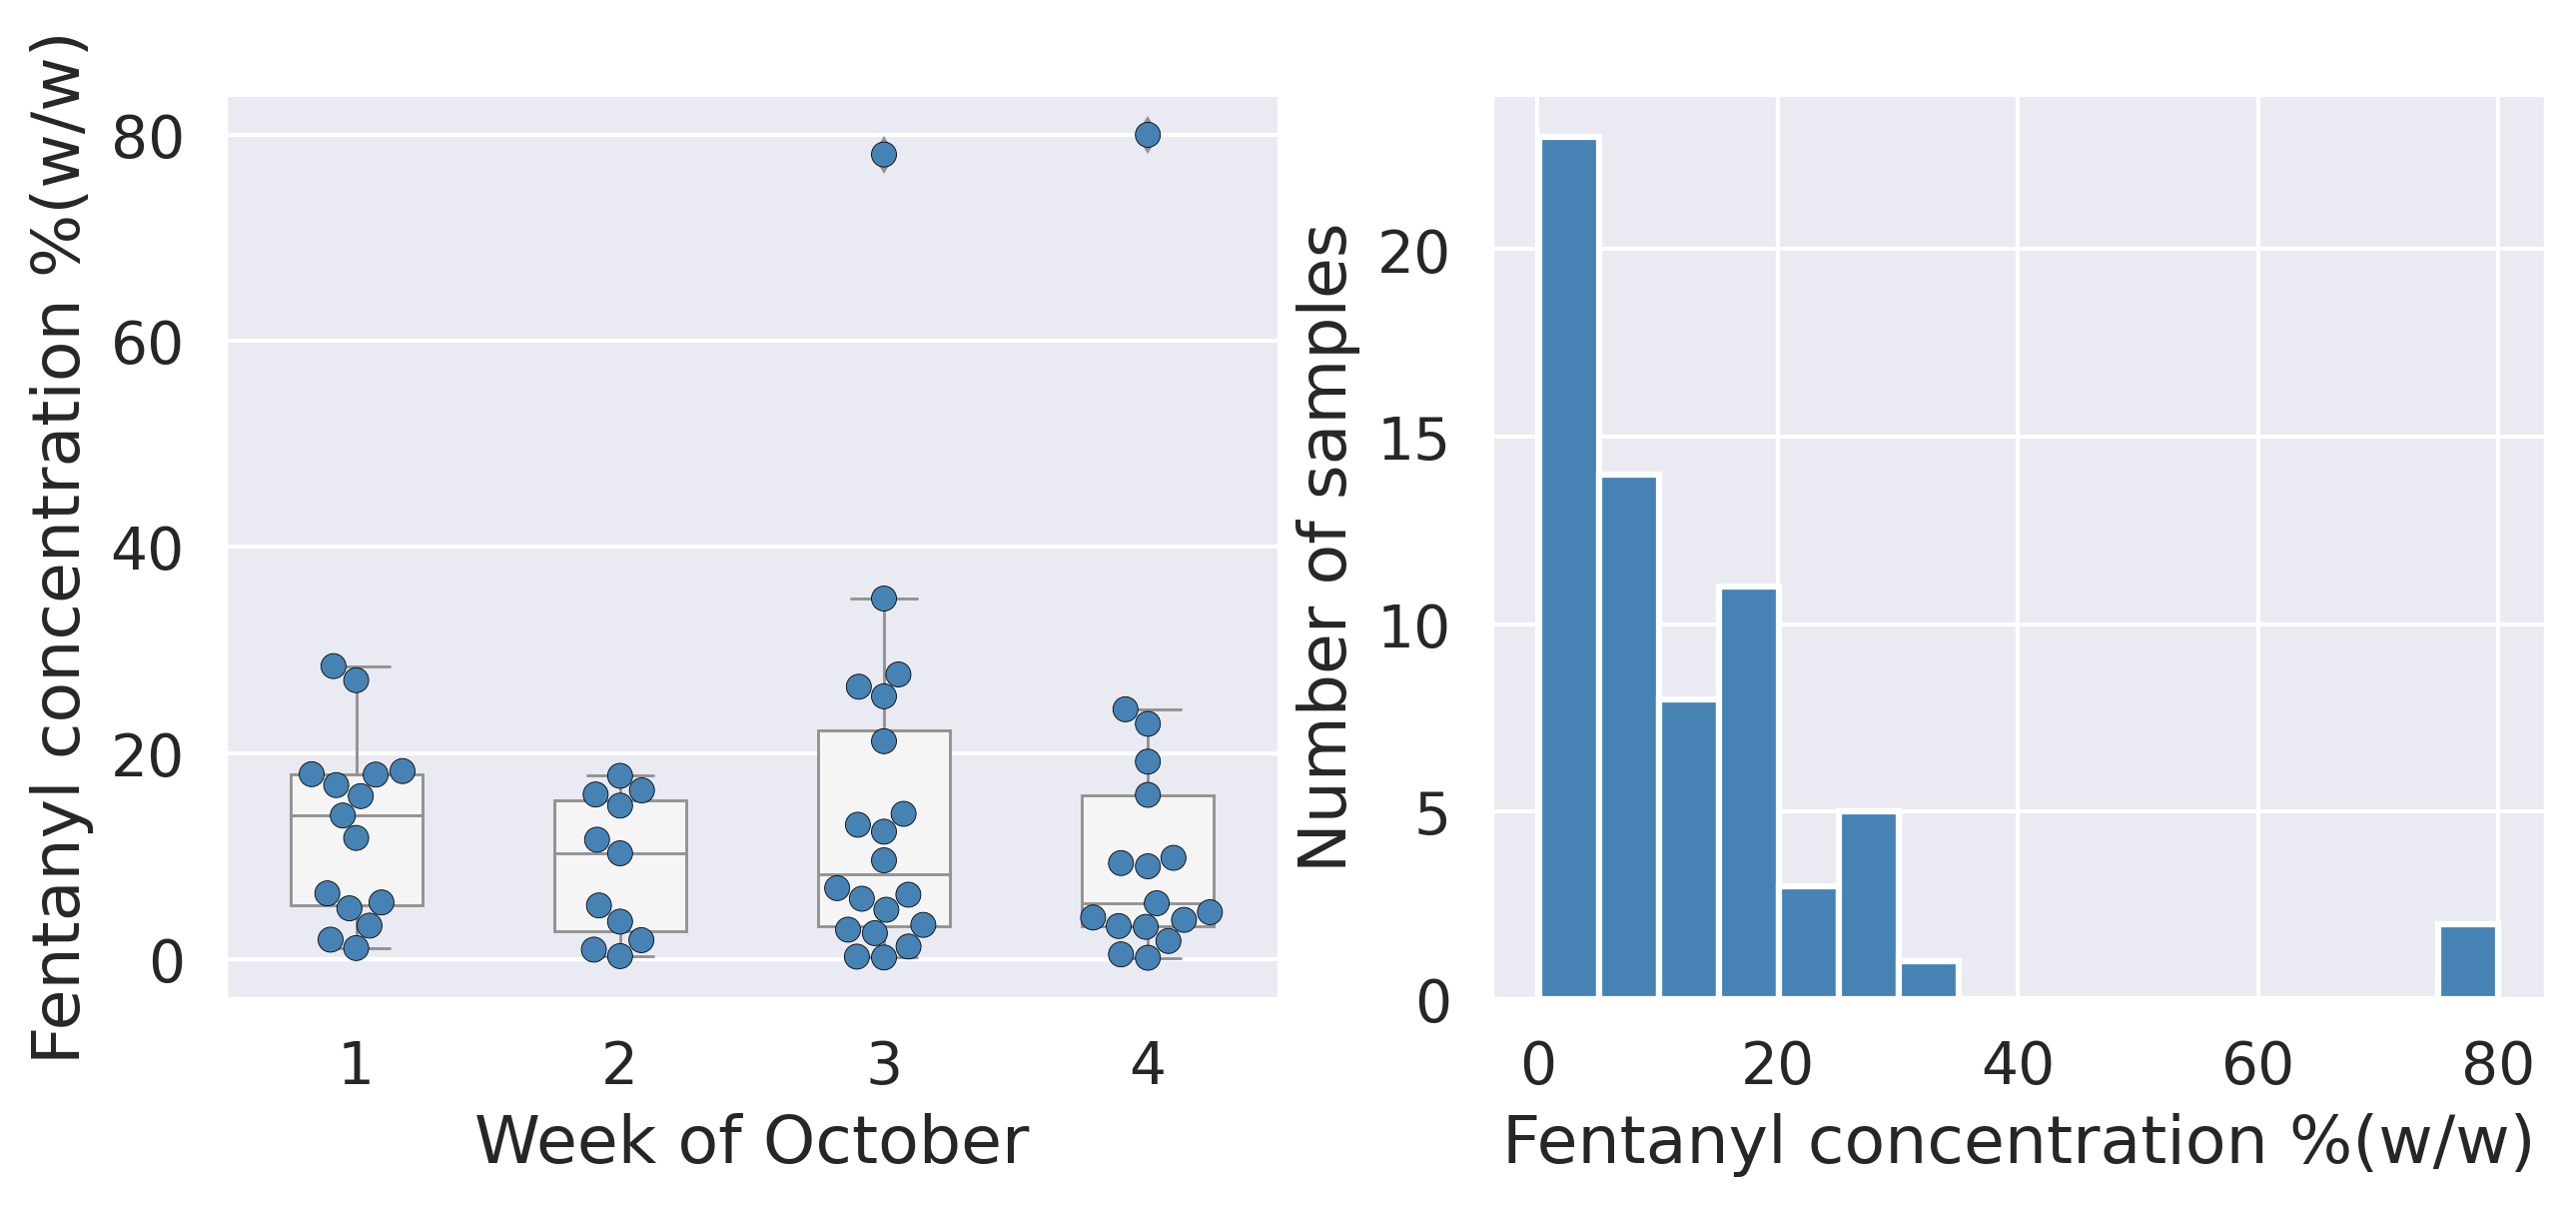
Quantification for Expected Opioid-Down [1]
In October, we quantified fentanyl for 67 of the opioid down samples containing fentanyl and found the median concentration to be 9.0%, with the average strength of fentanyl we normally see being around 10% as well. Though the median is a useful indicator, it doesn’t capture the volatility of fentanyl concentrations present in the opioid supply, as any one sample might be the lowest strength (0.1%) or the strongest (80+%[2]). Similarly, the concentration of etizolam was across the board in expected opioid down samples, ranging from 0.2% to 39.2%, with a median of 3.8%.
Not all opioid down samples brought to our service can be quantified. This is primarily due to too limited sample collected for our instruments to report a reliable mass percentage. Nevertheless, qualitative detection is still possible. ↩︎
For samples that contain more than 80% fentanyl by weight, our mass spectrometer is presently unable to reproducibly assign a concentration due to the upper limits of the calibration methods currently adopted. ↩︎

Figure 5 demonstrates the spread of concentrations we found in October by week (left) and for the month overall (right).
Want to be notified when we release these reports? Join our mailing list to receive updates about when our reports are out. You can subscribe and unsubscribe yourself from this list at any time.
Check back next month for the November report!
As always, send us feedback at substance@uvic.ca for how we can continue to offer our drug checking results in a useful way.