May 2021 Monthly Report

In this blog post we discuss our May 2021 report and provide more information on how to interpret the results. The PDF report can be found at the end.
Key findings:
- Fentanyl analogues found in 10 samples expected to be opioid-down or unknown, including carfentanil (8) and fluorofentanyl (2)
- Overall median fentanyl concentration of 10.4%, with a maximum concentration of 62.2% found in an expected opioid-down sample
- Overall median etizolam concentration of 1.8%, with a maximum concentration of 17.8% found in an expected opioid-down sample
- Benzodiazepines and/or etizolam found in 45% of expected opioid-down samples
- N-ethylpentylone found in an expected MDMA sample
Insight for the May 2021 Monthly Report
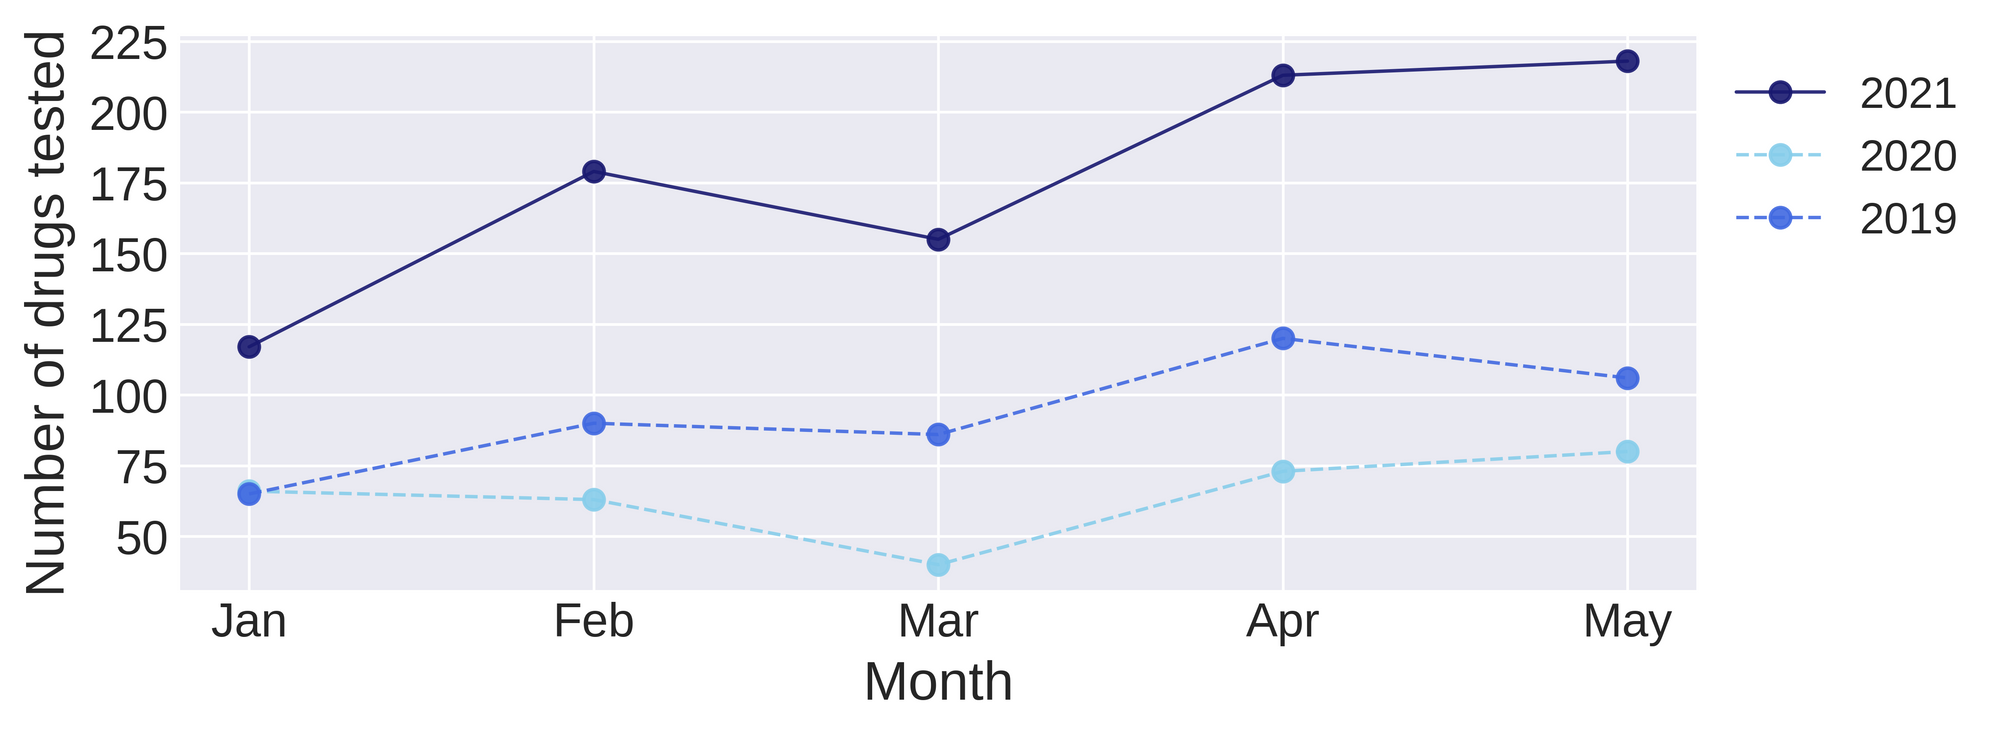
Service continues to keep us busy as we have set yet another record for busiest month, checking 218 samples! This is a 172% increase from May 2020.
Drugs and cuts
Not all the drugs we test are cut or full of unexpected actives. In many cases we actually confirm that the expected drug was indeed the only expected drug and that no additional cutting agents were present. The blue boxes below demonstrate that this is often the case for many drug types.
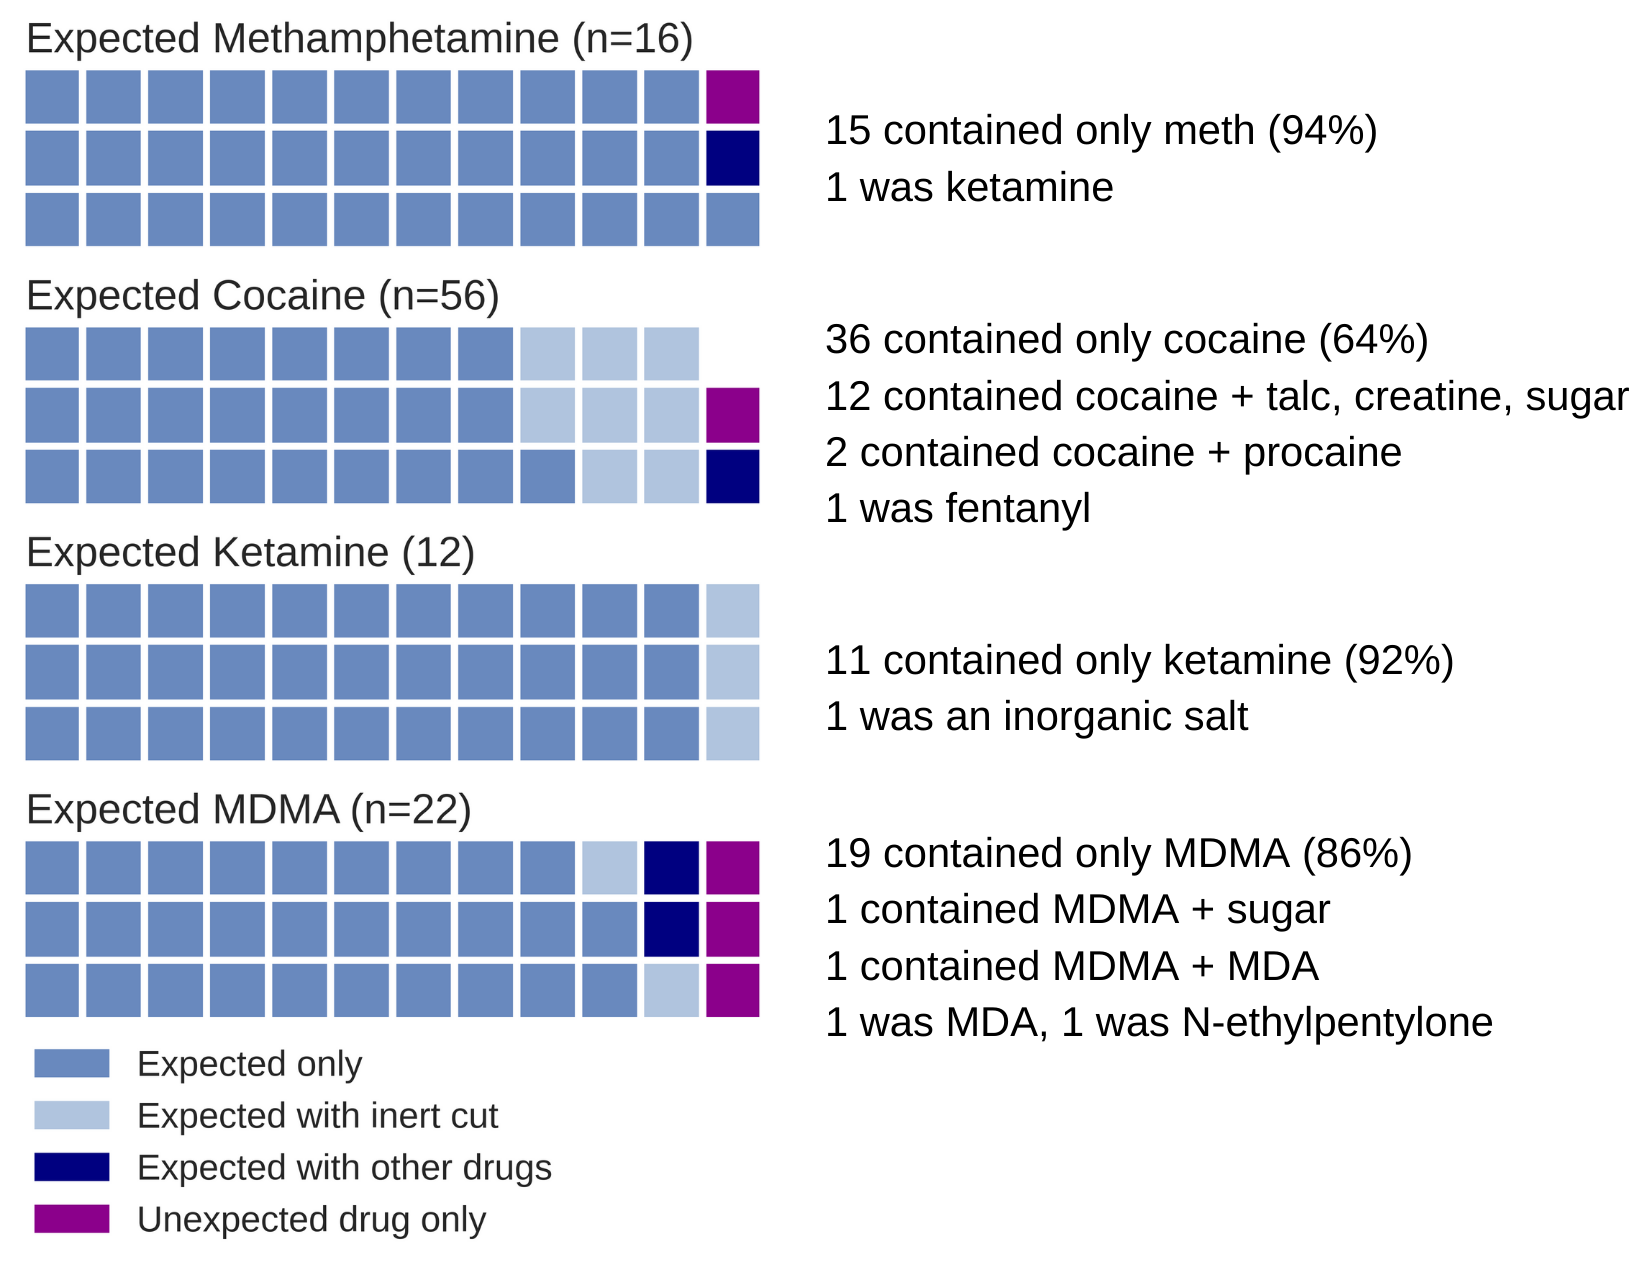
Spotlight sample 1. A pretty baggy with skulls and rainbows and unicorns, but only a tiny bit of residual cocaine inside. There was only enough sample to run test strips on. This occurred with 5 cocaine samples, which is why the values listed above don’t add up to 56.
Spotlight sample 2. Yet another white powder was brought in. It was expected to be cocaine, but rather was found to contain fentanyl and caffeine, a common mixture in a down sample. This was either a misrepresented down sample, as it didn’t contain any cocaine, or it was a misclassified sample, as the sample was brought in by a third party user.
Spotlight sample 3. An expected MDMA sample was found to be N-ethylpentylone, which is sometimes found in thought-to-be MDMA samples. N-ethylpentylone is a cathinone-substituted stimulant, so it gives similar effects to MDMA, however it has been linked to overdoses. Read more here.
Expected Benzodiazepines
Although benzodiazepine adulteration in the opioid-down supply is alarming and ongoing, we still check substances that are thought to be benzos as a single ingredient, usually in tablet form. This month, 8 samples were expected to be Xanax (alprazolam) and one sample was expected to be clonazepam. In no cases was the expected active benzo drug found. Instead, five samples were found to contain etizolam and three samples were found to contain flualprazolam.
Within these expected benzodiazepine samples, etizolam (n=5) was found at a median concentration of 0.79%, minimum of 0.23% and maximum of 5.0%.
Opioid-Down
In an article titled “The Dangers of Rampant Fentanyl Misinformation”, Dr. Stea interviews an expert medical toxicologist, Dr. Marino, about the stigma associated with illicit drugs and their use. Dr. Marino highlights how much misinformation we are exposed to through the media, with his preliminary research showing 92% of articles contain misinformation towards fentanyl.
While it’s impossible to be an expert of all topics, Dr. Marino offers guidance for identifying misinformation:
(1) look at the source - if written by the news or a police bulletin, ask yourself why we would trust them to inform us on how these chemicals work when they may have no requisite background in chemistry, drug science, medicine, or even addiction.
(2) ask logical questions - If you could overdose on drugs by touching them, then why would people go to the extremes of injecting them? Dr. Marino explains, if you aren’t ingesting drugs then fentanyl cannot easily get into your system, meaning it doesn’t easily cross the skin barrier on its own nor does it spontaneously aerosolize into the air.
Hearing about a substance that contributed to a provincial public health emergency and where mere milligrams can be fatal sparks a natural fear, but as Dr. Marino states, this does not mean that fentanyl is a threat to everybody like some kind of boogeyman. Fentanyl has been used safely as a medicine for decades. Potential dangers come when it’s a surprise or when used in unknown amounts, as is common in the illicit supply where drugs are unregulated due to prohibition. Misinformation only increases harms to already marginalized and vulnerable people without improving our drug problem. Let’s put things into the proper perspective! Read the article here.
Our Findings (n=66):
In this section we present statistics specific to the opioid-down supply, therefore they may differ from the highlighted findings above that are inclusive of all expected drug categories.
- 97% expected opioid-down samples contained fentanyl (53/54)
- 7 samples contained carfentanil
- 2 samples contained fluorofentanyl
- 45% samples contained a benzo and/or etizolam (30/66)
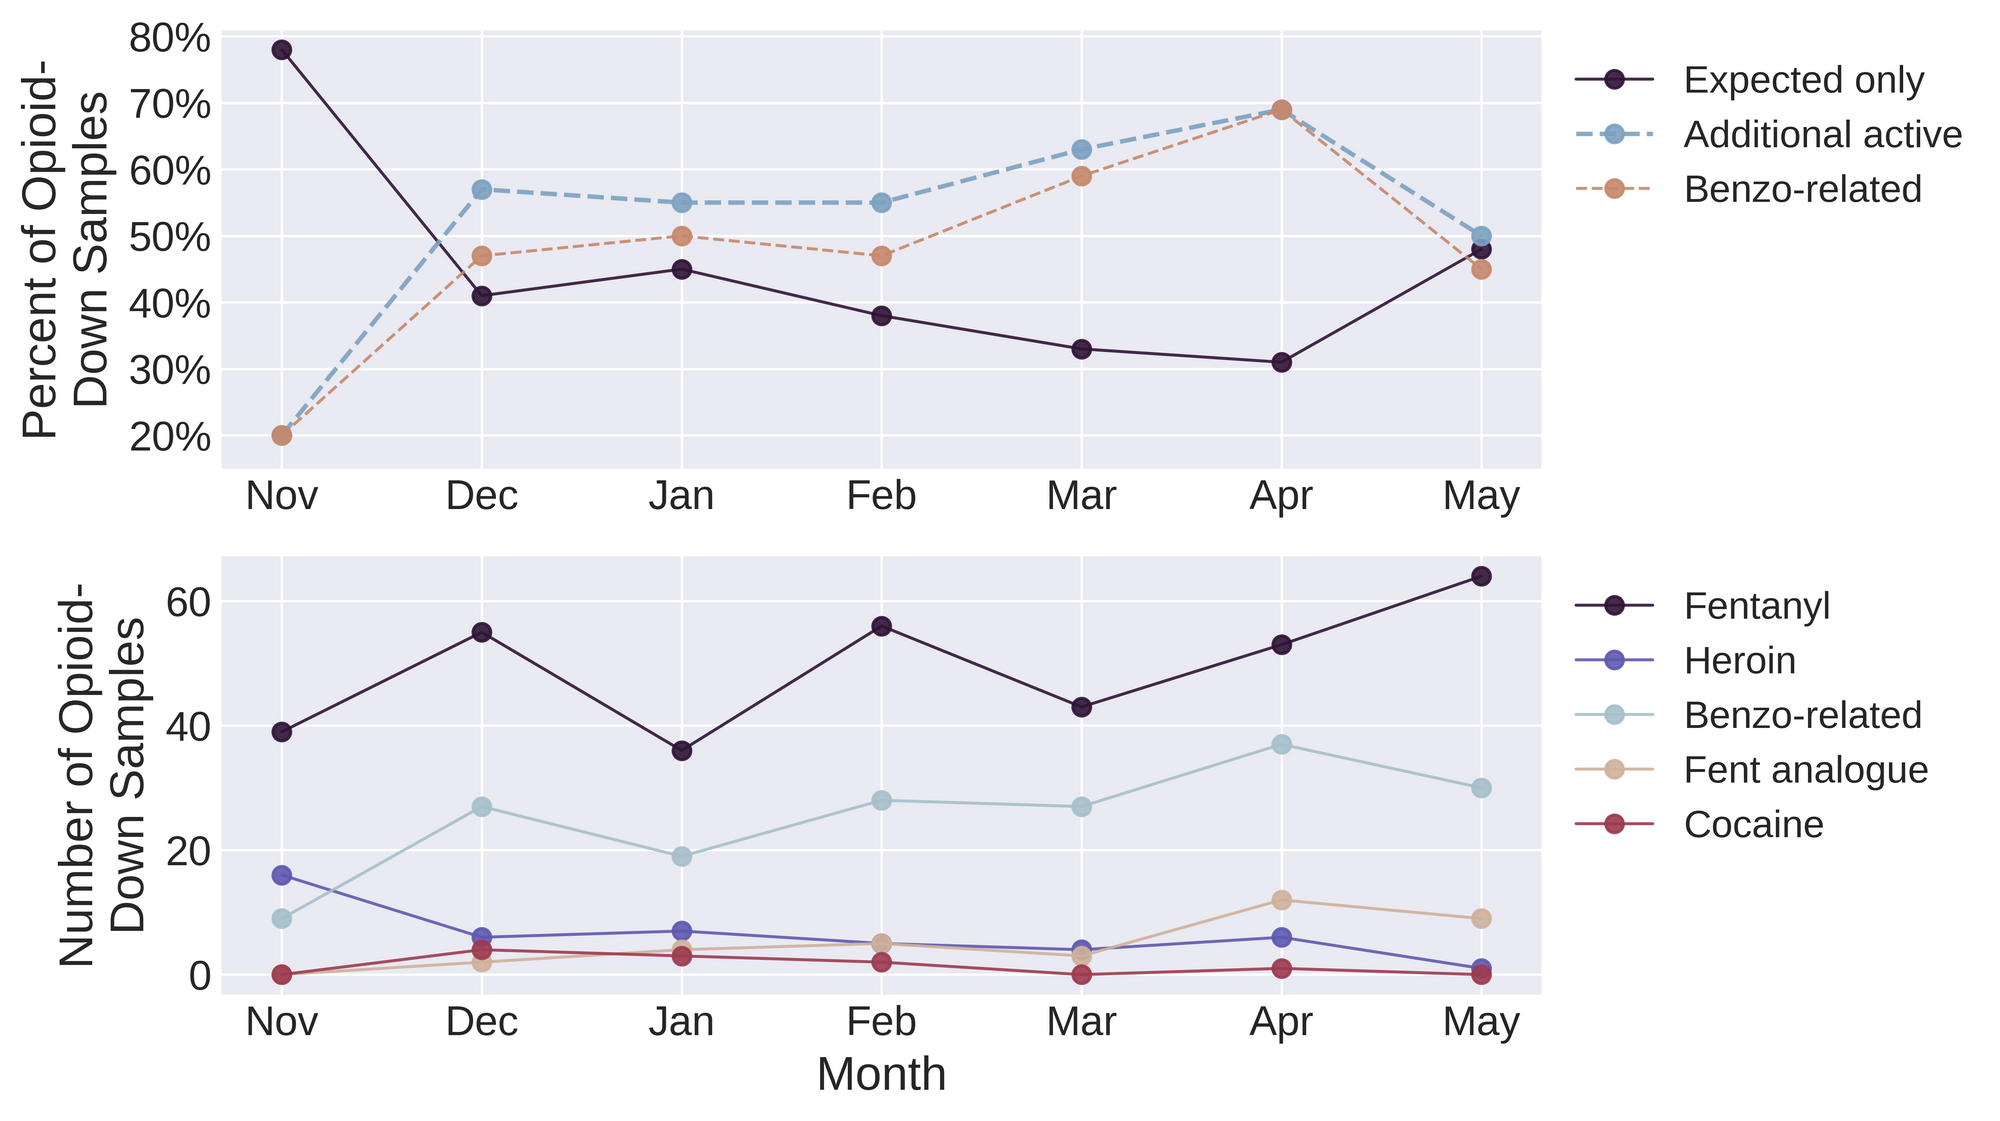
This May, 50% of opioid-down samples contained an active in addition to fentanyl and/or heroin. Benzodiazepine-related drugs make up the majority of these additional actives, along with fentanyl analogues and methamphetamine. Figure 2 shows the percent of additional active drugs found over time, which highlights the ever-changing conditions of prohibited markets. The only consistency we have is in knowing that each month there will be a high level of inconsistencies in the supply. People who use drugs have been pointing to the remedies to this unregulated supply for years, with calls for decriminalization and safer supply as effective interventions in the unregulated market. It’s long past time we listen.
Quantification for Opioid-Down

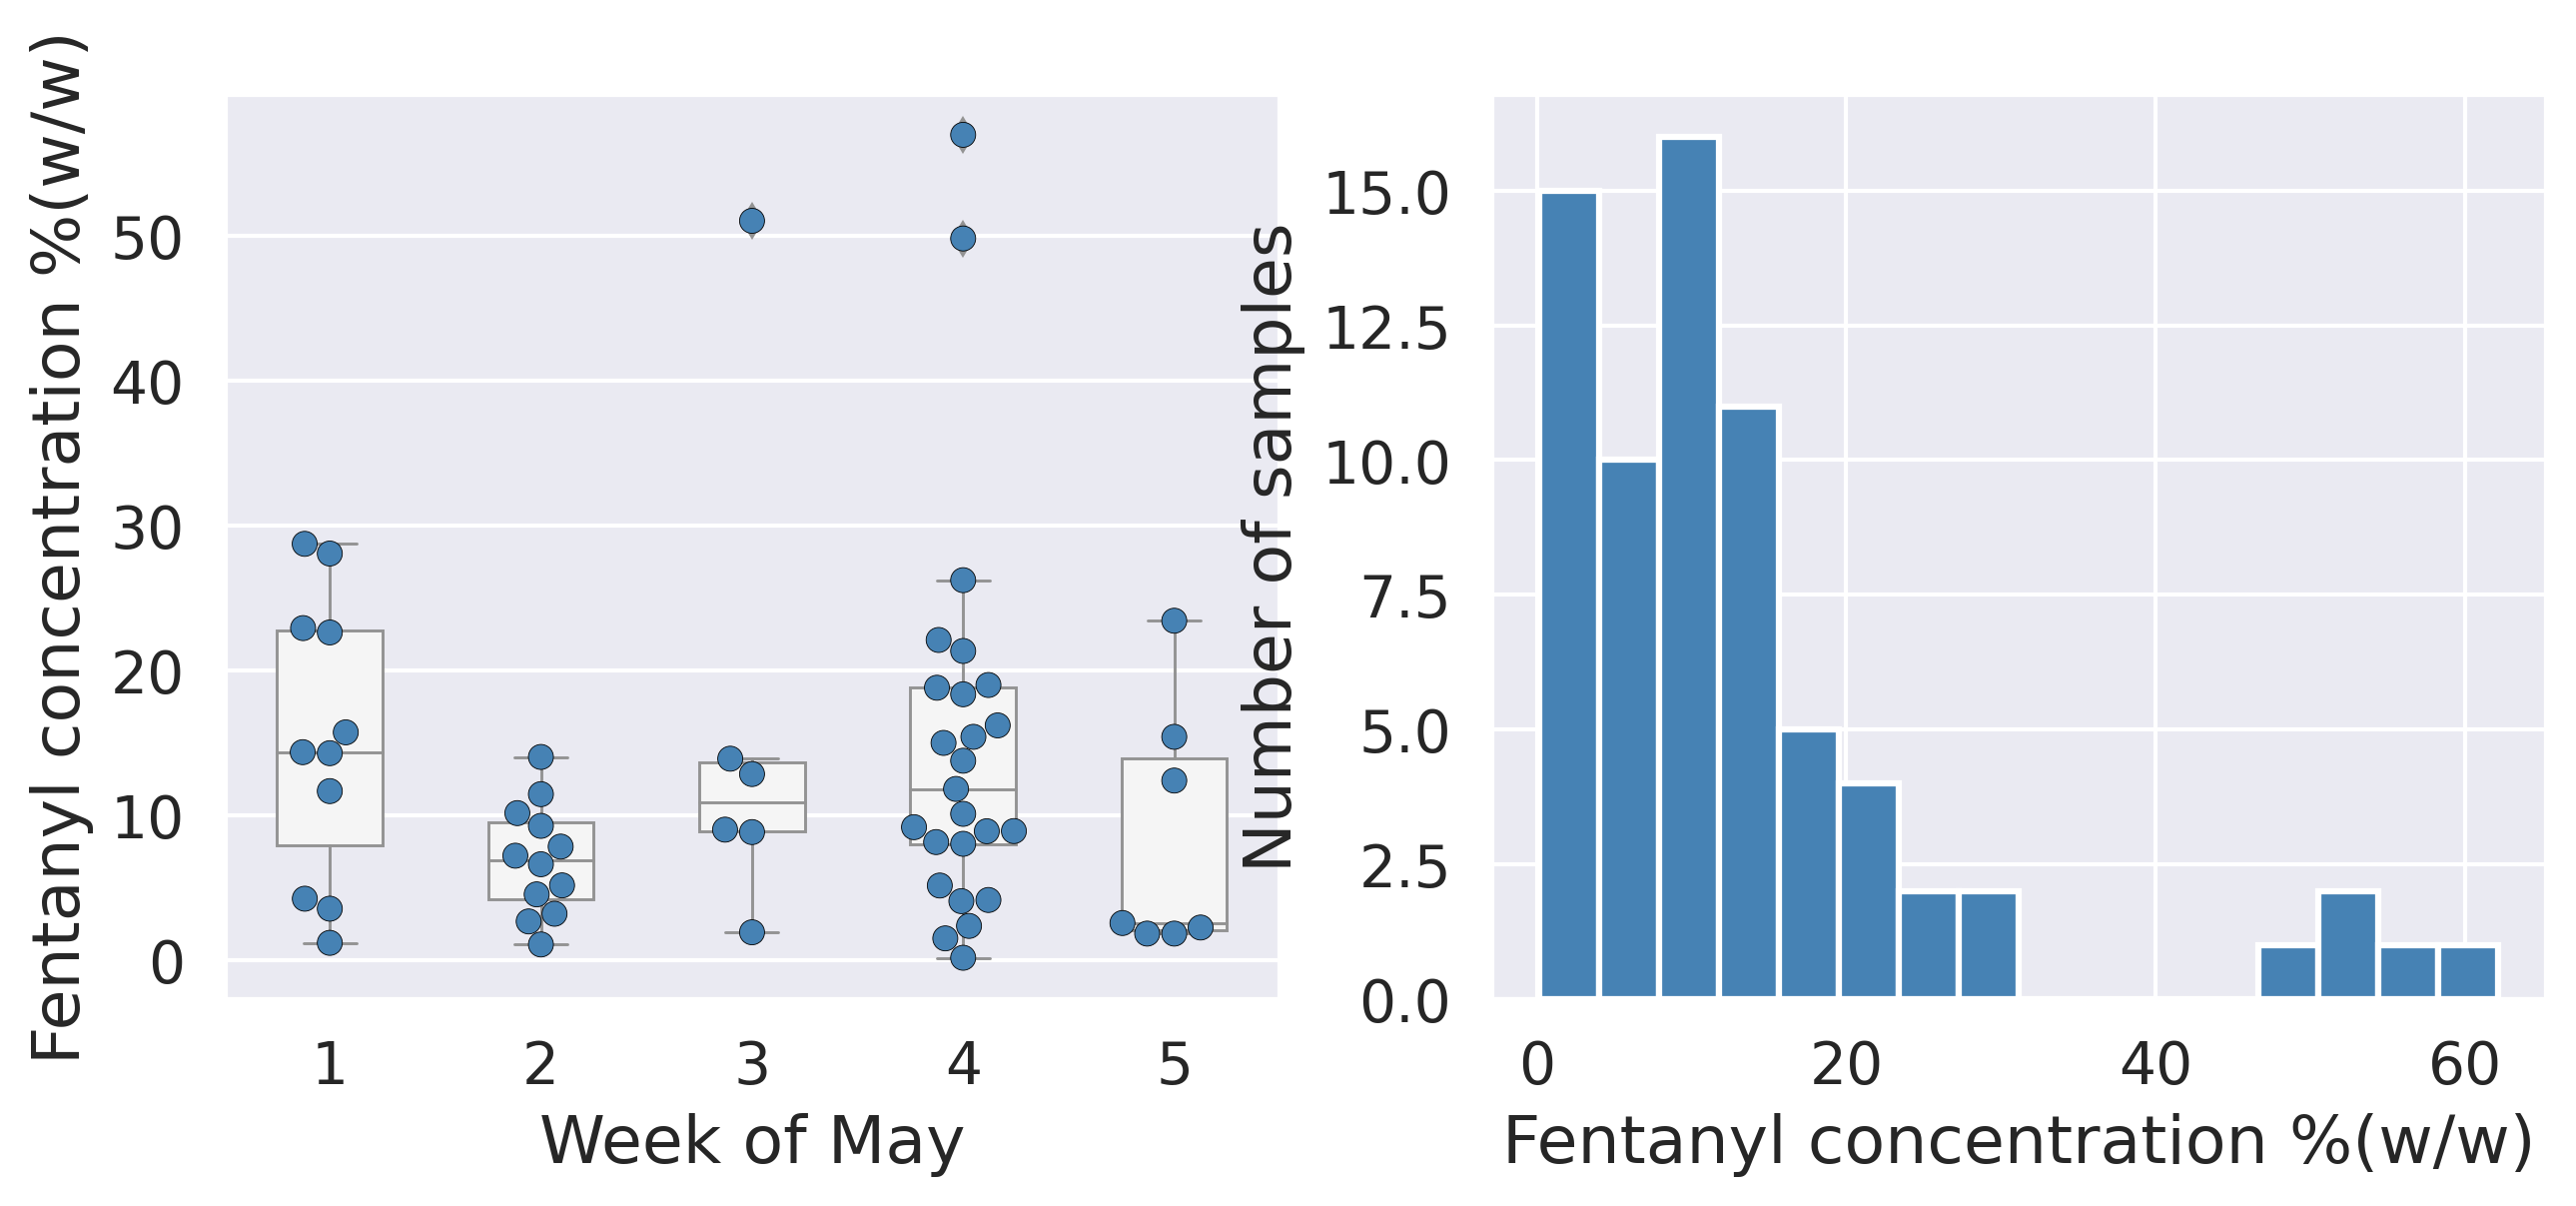
In May, we quantified fentanyl for 61 of the 64 of the expected opioid-down samples that contained fentanyl. We found the median concentration to be 10.2% fentanyl, with Figure 3 demonstrating the spread of concentrations. The average strength of fentanyl in opioid-down that we see during service is around 10% in general, which is confirmed by our median of 10.2%. Our findings illustrate the volatility of fentanyl concentrations in the opioid-supply, as any one sample in the week might be the lowest strength sample (0.2%) or the strongest sample (57.0%).
Want to be notified when we release these reports? Join our mailing list to receive updates about when our reports are out. You can subscribe and unsubscribe yourself from this list at any time.
Check back next month for the June report!
As always, send us feedback at substance@uvic.ca for how we can continue to offer our drug checking results in a useful way.