March 2023 Monthly Report

In this blog post, we discuss our March 2023 report and provide more information on how to interpret the results. The PDF report can be found at the end.
Key findings:
- The median fentanyl concentration found, across all expected drug categories, was 9.6% with a maximum of over 80%
- Carfentanil was found in 3 expected opioid-down samples at concentrations 0.21%, 0.23%, and 0.40%
- Benzodiazepines and/or etizolam were found in 43% (201/468) of expected opioid-down samples
- Bromazolam, the most common benzodiazepine found across all drug categories, was found in 163 samples with a median concentration of 1.9% and a maximum concentration greater than 80%
- Xylazine was found in 12 samples (9 expected opioid-down, 2 expected cocaine, and 1 expected caffeine) with a median concentration of 1.6% and a maximum concentration of 5.1%
Insight for the March 2023 Monthly Report
March marked the second anniversary of Substance's brick-and-mortar storefront location, and our continued presence in North Park has strengthened our relationships with our service partners and community members.
We often hear from service users that visiting Substance has become a part of their daily routine. This has been attributed to the value of drug checking, the availability of harm reduction supplies and information, our positioning around other services (notably SOLID Outreach and the Victoria SAFER program), consistent operating hours, the trust we have developed with our users, and the positive vibes maintained by the steady stream of pixie sticks.
The benefits of having a stable location extend beyond the pleasure of working with our neighbours daily; advantages are also seen in the expansion of our services over the past two years. With a central hub, and no longer having to worry about where or when we will be working, we can host the paper spray mass spectrometer (PS-MS) on-site, provide consistent remote analysis for sites within our distributed model, and focus on developing our outreach efforts (which would not be possible in its current scope without our collaboration with SOLID Outreach).
Our observations on the benefits of continuity are not just thoughts for the ether but are supported by our service data. In March, we checked a record-breaking 877 samples, with the most significant increase in service occurring at Substance and in our Outreach program. We checked 27% more samples at Substance than we did in February, and through Outreach, we checked 67% more samples than in February.
This surge in service is part of a broader trend we have witnessed over the past few years, which has certainly been fostered by having a physical storefront. We are excited and optimistic that our distributed sites across “Vancouver Island” will follow a similar trajectory as drug checking becomes more familiar and integrated into people's routines in these communities.
This blog, and the associated pdf report, breakdown our sample counts into six categories:
-
samples received through direct service provision in Victoria, where service users are bringing samples into the Substance storefront. These samples are labelled as “Substance” samples in the figures/tables of this blog post
-
samples received through direct service provision in Campbell River, where service users bring samples to the Vancouver Island Mental Health Society (VIHMS). These samples are labelled as “Campbell River”.
-
samples received through direct service provision in the Comox Valley, where service users are bringing samples to AVI Health & Community Services in Courtenay, BC. These samples are labelled as “Comox Valley”.
-
samples received through direct service provision in the Cowichan Valley, where service users bring samples to the Duncan Lookout Society OPS in Duncan, BC. These samples are labelled as “Duncan”.
-
samples received through direct service provision in Port Alberni, where service users bring samples into Port Alberni Shelter Society’s OPS. These samples are labelled as “Port Alberni”.
-
samples received through indirect service provision, where samples are collected through no-contact drop-off envelopes, are collected by harm reduction workers and other community members at supported housing sites, overdose prevention sites, and supervised consumption locations. These samples are labelled as “Outreach” samples in the figures/tables herein.
Drug types
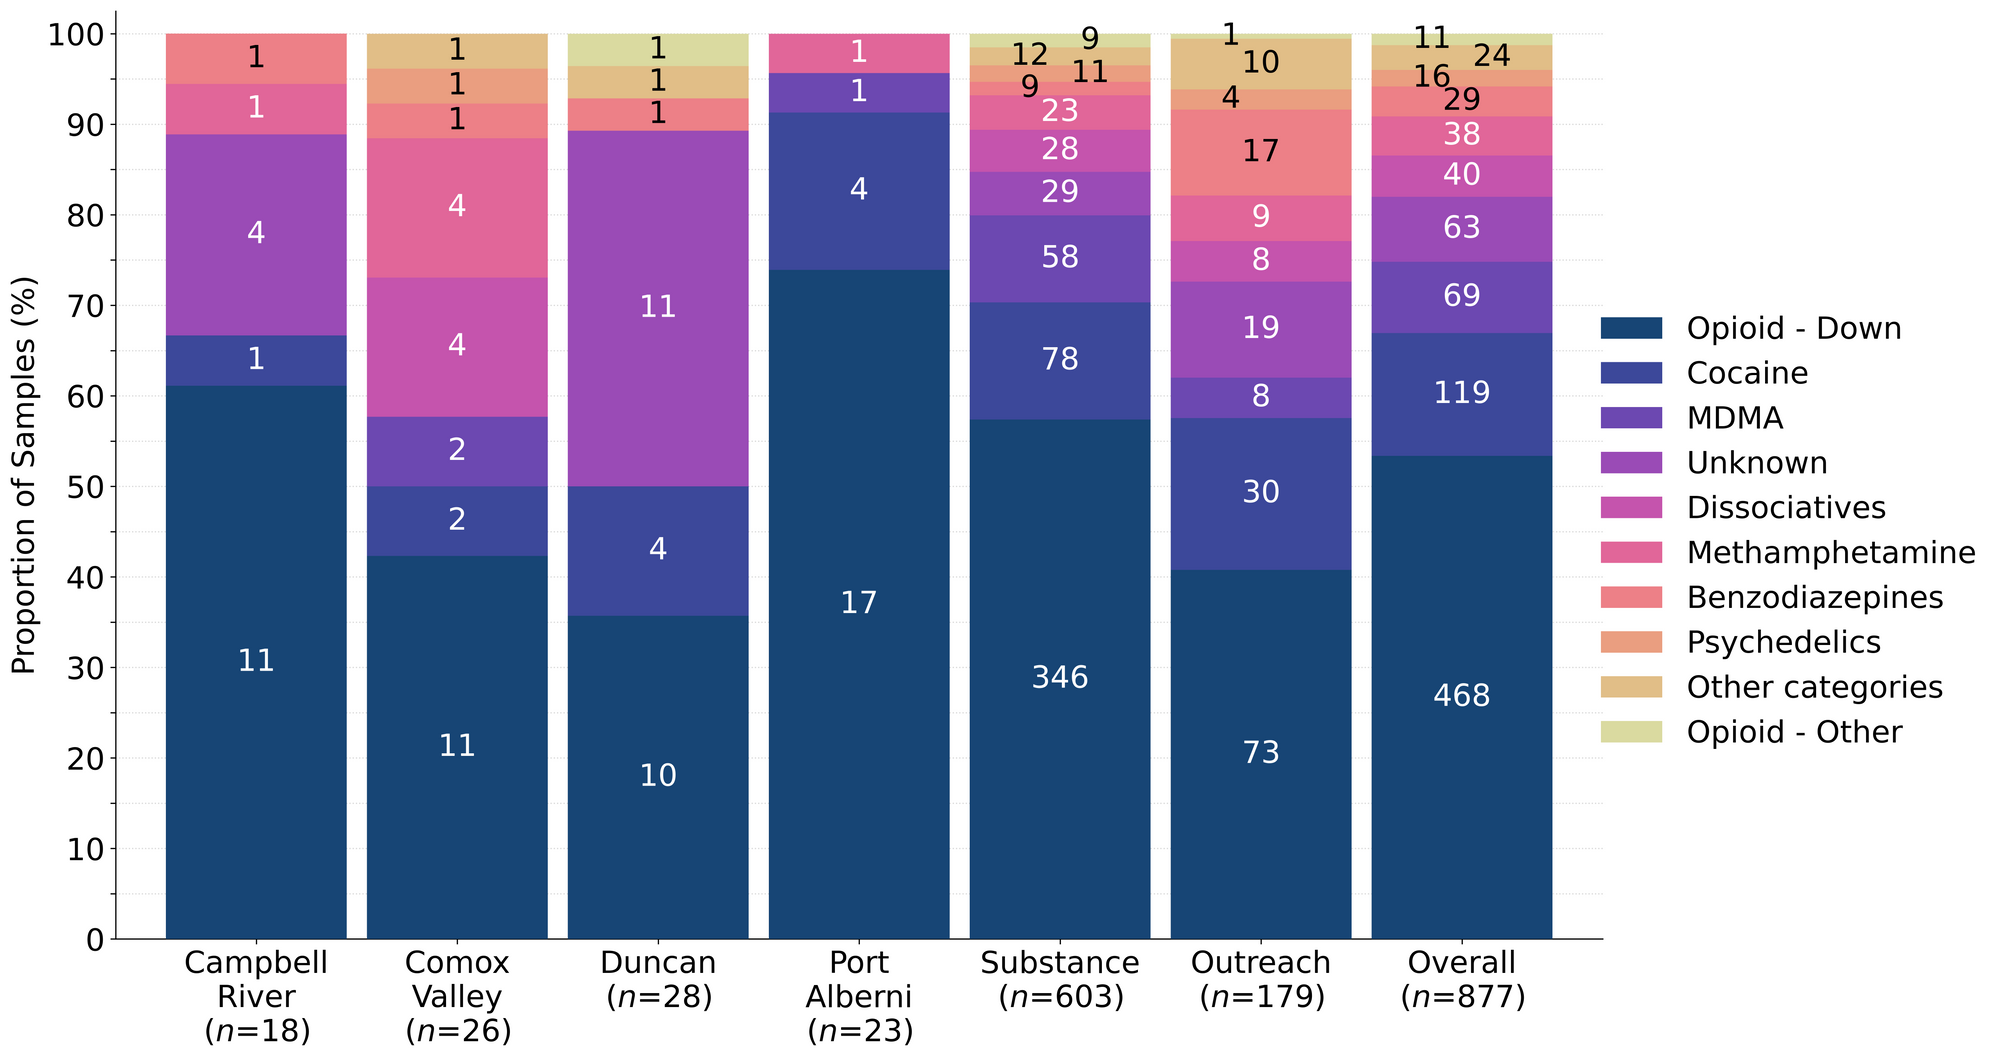
Fig. 1 shows the prevalence of each expected drug category checked, split by sample collection location/method.

March’s white powder mysteries
For a majority of samples checked, we confirm that the expected drug was indeed the only active and that no additional active compounds were present. The bar charts below highlight a few classes of drugs, differentiating samples when only the expected active was found from situations when other unexpected active components were detected.
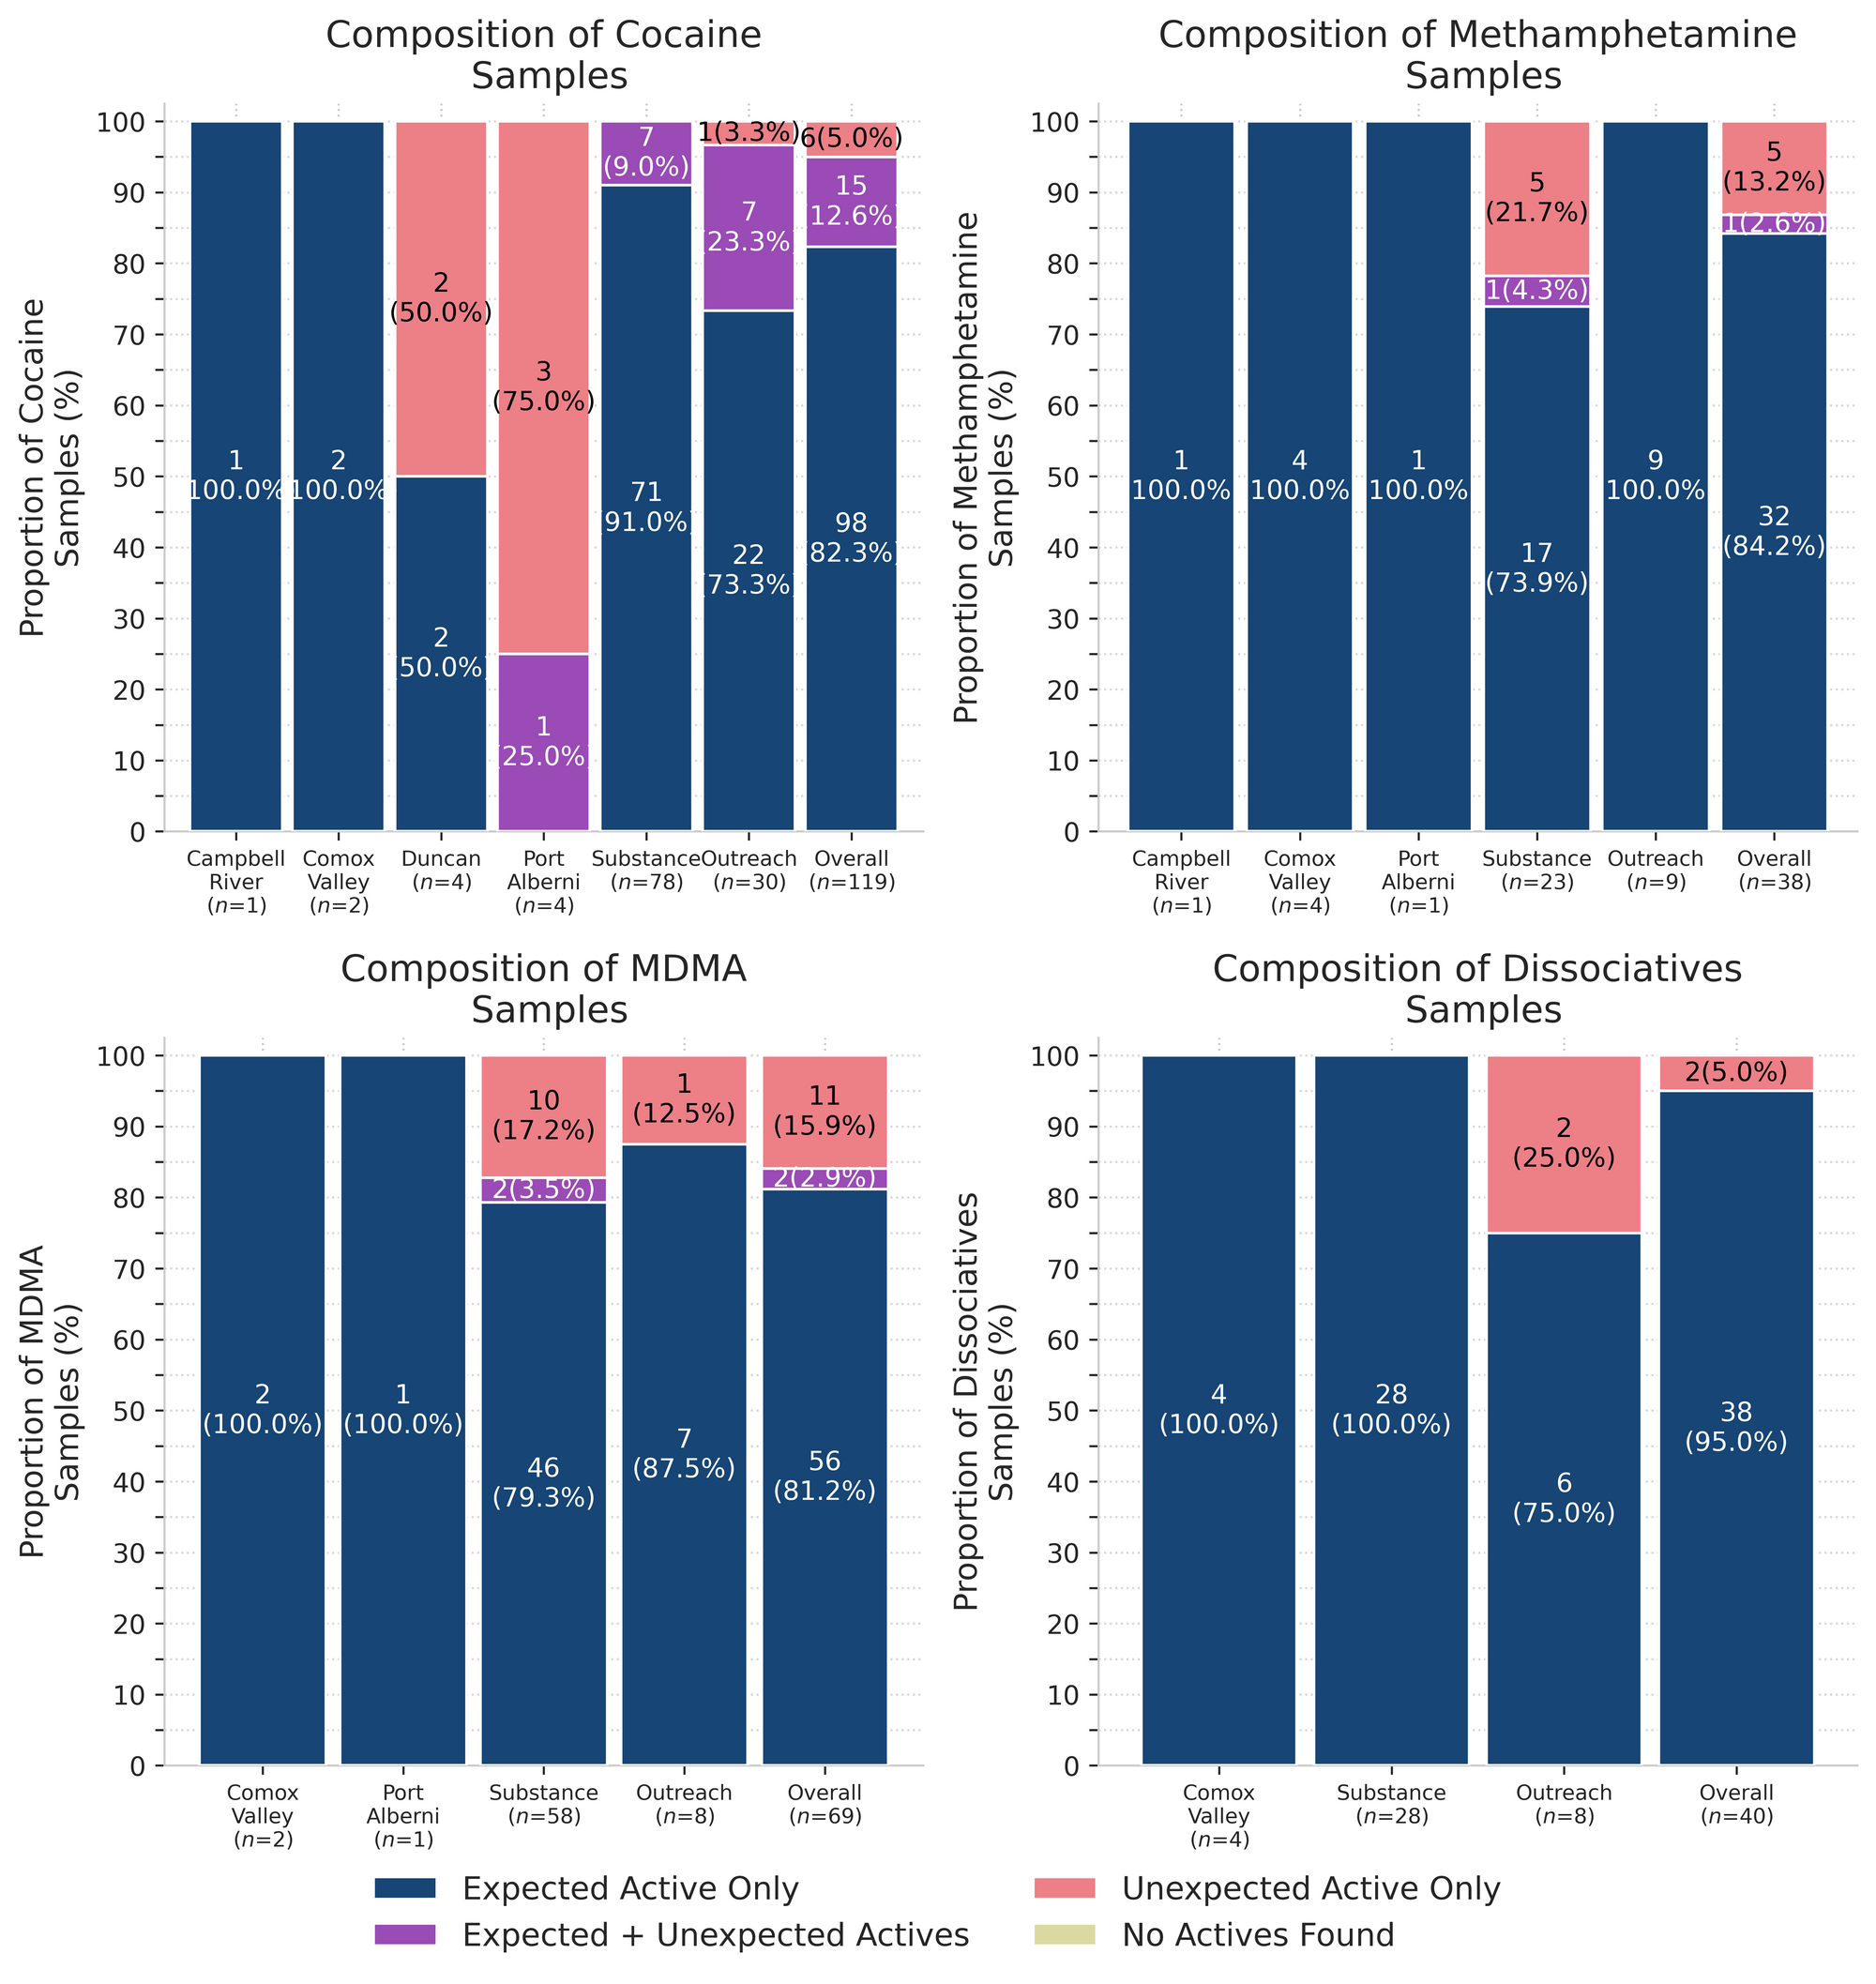
95% (38/40) of expected ketamine samples checked in March were confirmed to be ketamine with no other active compounds detected. Inactive cuts were only detected in one sample from Victoria which was found to contain dimethyl sulfone (MSM) as a cutting agent at around 20% by weight.
The other two expected ketamine samples did not contain any ketamine and instead were found to be:
- Fluorodeschloroketamine - One sample (Victoria); fluorodeschloroketamine is a novel dissociative closely related to ketamine. Fluorodeschloroketamine is dosed similarly to ketamine and has a similar duration of effect, though with a slightly faster onset/come up than ketamine. While there is limited documentation in the literature about this compound, some users describe the effects as nearly indistinguishable from ketamine. As always, we recommend starting low and going slow when sampling new substances to see how your body responds.
- Methamphetamine - One sample (Victoria); despite their similar appearances as crystalline powders and shards, we can attest that meth and ketamine are in fact quite different drugs. If you find yourself wandering the wide wilderness of white powders without a whiff of wisdom about what is in your baggie, come get your stuff checked and maybe the lamps in our spectrometers can help illuminate the way.
84% (32/38) of expected methamphetamine samples checked were found to be meth with no other active compounds or inactive cuts detected. One sample from Victoria was found to primarily be meth with a trace amount (less than 0.1%) of fentanyl detected as well. This sample was brought in to be checked alongside three other opioid-down samples so we suspect cross-contamination during transport was the source of the fentanyl adulteration.
The remaining five expected methamphetamine samples contained no meth at all and instead were found to be:
- Ketamine - Two samples (Victoria)
- MDMA - One sample (Victoria)
- Ketamine (>80%) + MDMA (3%) - One sample (Victoria)
- MDA - One sample (Victoria)
82% (98/119) of expected cocaine samples (75 cocaine HCl/soft, 23 cocaine base/hard/crack) checked were confirmed to be cocaine with no active adulterants detected. Seven of these samples were found to contain inactive cutting agents, with creatine detected at 20% by weight in a cocaine base sample, sorbitol (a sugar alcohol) detected at 10% in four cocaine HCl samples, inositol (another sugar alcohol) detected at 30% in one cocaine HCl sample, and mannitol (yet another sugar alcohol) detected at 15% in one cocaine HCl sample. The cocaine base + creatine sample was from Campbell River and the six cut cocaine HCl samples were all checked in Victoria.
15 samples contained an active component in addition to cocaine:
- Acetaminophen - One sample (Victoria); Tylenol/Paracetamol
- Benzocaine - Three samples (x2 Victoria, x1 Outreach); a local anesthetic/numbing agent
- Levamisole - Nine samples (x4 Victoria, x5 Outreach); an antihelminthic drug used to treat parasitic worm infections, commonly seen as a cut in cocaine
- Fentanyl - Two samples (x1 Port Alberni, x1 Outreach). The Outreach sample was found to be a mixture of cocaine base, fentanyl (10%) and caffeine (~15%). The sample from Port Alberni was found to contain cocaine base (55%), fentanyl (0.7%), bromazolam (3%), and caffeine as a cut.
The remaining six expected cocaine samples did not contain any cocaine and instead were found to be:
- Methamphetamine - One sample (Duncan); this sample was a fine white powder that appeared to be a crushed pill as it was found to contain meth, caffeine, microcrystalline cellulose, and other pill binding agents
- “Down” - Five samples:
- Fentanyl (1%), Bromazolam (8%), ANPP (20%), Caffeine - this sample was a light blue chunk/rock from Duncan
- Fentanyl (5%), Bromazolam (11%), Xylazine (3%), Caffeine, Erythritol - This sample was sold as crack in Port Alberni and was an off-white/cream coloured flakey chunk
- Fentanyl (6%), Bromazolam (9%), Xylazine (5%), Caffeine, Erythritol - This sample was sold as crack in Port Alberni and was soft, light brown paste
- Fentanyl, Bromazolam, Caffeine - this sample was a flat white flake from Port Alberni. There was not enough sample left over for analysis on PS-MS so quantitative information was not available for this sample
- Fentanyl (0.3%), Fluorofentanyl (14%), Caffeine - this sample was a hard white chunk from Victoria
81% (56/69) of expected MDA/MDMA samples checked were confirmed to be MDA (5 samples) and MDMA (51 samples), as expected. Tracking inactive cuts, one MDA sample was cut with around 50% dimethyl sulfone (MSM), an MDMA sample was also cut with around 60% MSM, and another MDMA sample was cut with caffeine at around 35%; all three cut samples were checked in Victoria.
The remaining 13 expected MDA/MDMA samples displayed a range of compositions:
- Seven expected MDMA samples were found to be MDA instead
- One expected MDA sample from Victoria was found to be MDMA instead
- Two expected MDMA samples from Victoria were found to be a mixture of both MDA and MDMA
- Two expected MDMA samples from Victoria were found to be ketamine instead
Benzodiazepines (n=29)
76% (22/29) of the expected benzodiazepine samples checked in March came to our service sites in the form of pressed pills with the following expected and detected compositions:

Five of the remaining seven samples were all white powders. Three of these powder samples were found to be bromazolam, as expected; one was found to be flualprazolam, as expected, and the remaining sample was found to be bromazolam rather than the expected etizolam.
One sample was a sticky red paste from the Comox Valley that was expected to be diazepam/Valium. No diazepam was detected and instead, this sample was found to be “down” with a composition of fentanyl (10-30%), bromazolam (10-20%), caffeine and erythritol.
The last benzo sample was a clear liquid that was confirmed to be bromazolam, as expected.
Opioid-Down (n=468)
In this section we present results specific to the opioid-down supply, therefore they may differ from the highlighted findings above that are inclusive of all expected drug categories.
- 92% of expected opioid-down samples contained fentanyl (431/468)
- Two samples contained heroin (0.4% of expected opioid-down samples)
- One sample from Victoria was just heroin (and related alkaloids like acetylmorphine (MAM) and acetylcodeine).
- One sample from Victoria contained heroin (9%), fentanyl (18%), etizolam (20%), acetylmorphine (2%), trace amounts of acetylcodeine (less than 1%), trace amounts of flualprazolam (less than 1%), as well as cutting agents caffeine, dimethyl sulfone (MSM), and lidocaine (around 1%)
- 41% of expected opioid-down samples contained fluorofentanyl (192/468)
- Three samples contained carfentanil, with the following compositions:
- One sample (Duncan) contained carfentanil (0.21%), fentanyl (4%), fluorofentanyl (3%), and caffeine. This sample was a pink powdery chunk
- One sample (Campbell River) contained carfentanil (0.23%), fentanyl (5%), fluorofentanyl (1%), bromazolam (1%), caffeine and erythritol. This sample was a dark purple rock
- One sample (Campbell River) contained carfentanil (0.40%), fentanyl (8%), fluorofentanyl (8%), trace bromazolam (less than 0.1%), caffeine and erythritol. This sample was a fluorescent teal pebble
- 43% of expected opioid-down samples contained a benzodiazepine and/or etizolam (201/468)
- Xylazine was detected in 2% (9/468) of opioid-down samples
- Metonitazene was detected in one sample from Port Alberni. Metonitazene is a synthetic opioid thought to be comparable to fentanyl in strength, though there is very limited data available for this compound. This sample was a sticky dark purple paste that was found to contain fentanyl (7%), furanyl UF-17 (0.5%), metonitazene (0.2%), xylazine (0.1%), an unknown benzodiazepine, caffeine and erythritol
In March, 58% (273/468) of all opioid-down samples checked contained an additional active to the expected fentanyl/heroin. These data are shown in Fig. 3 highlighting the prevalence of benzos, fluorofentanyl, and xylazine in the down supply.
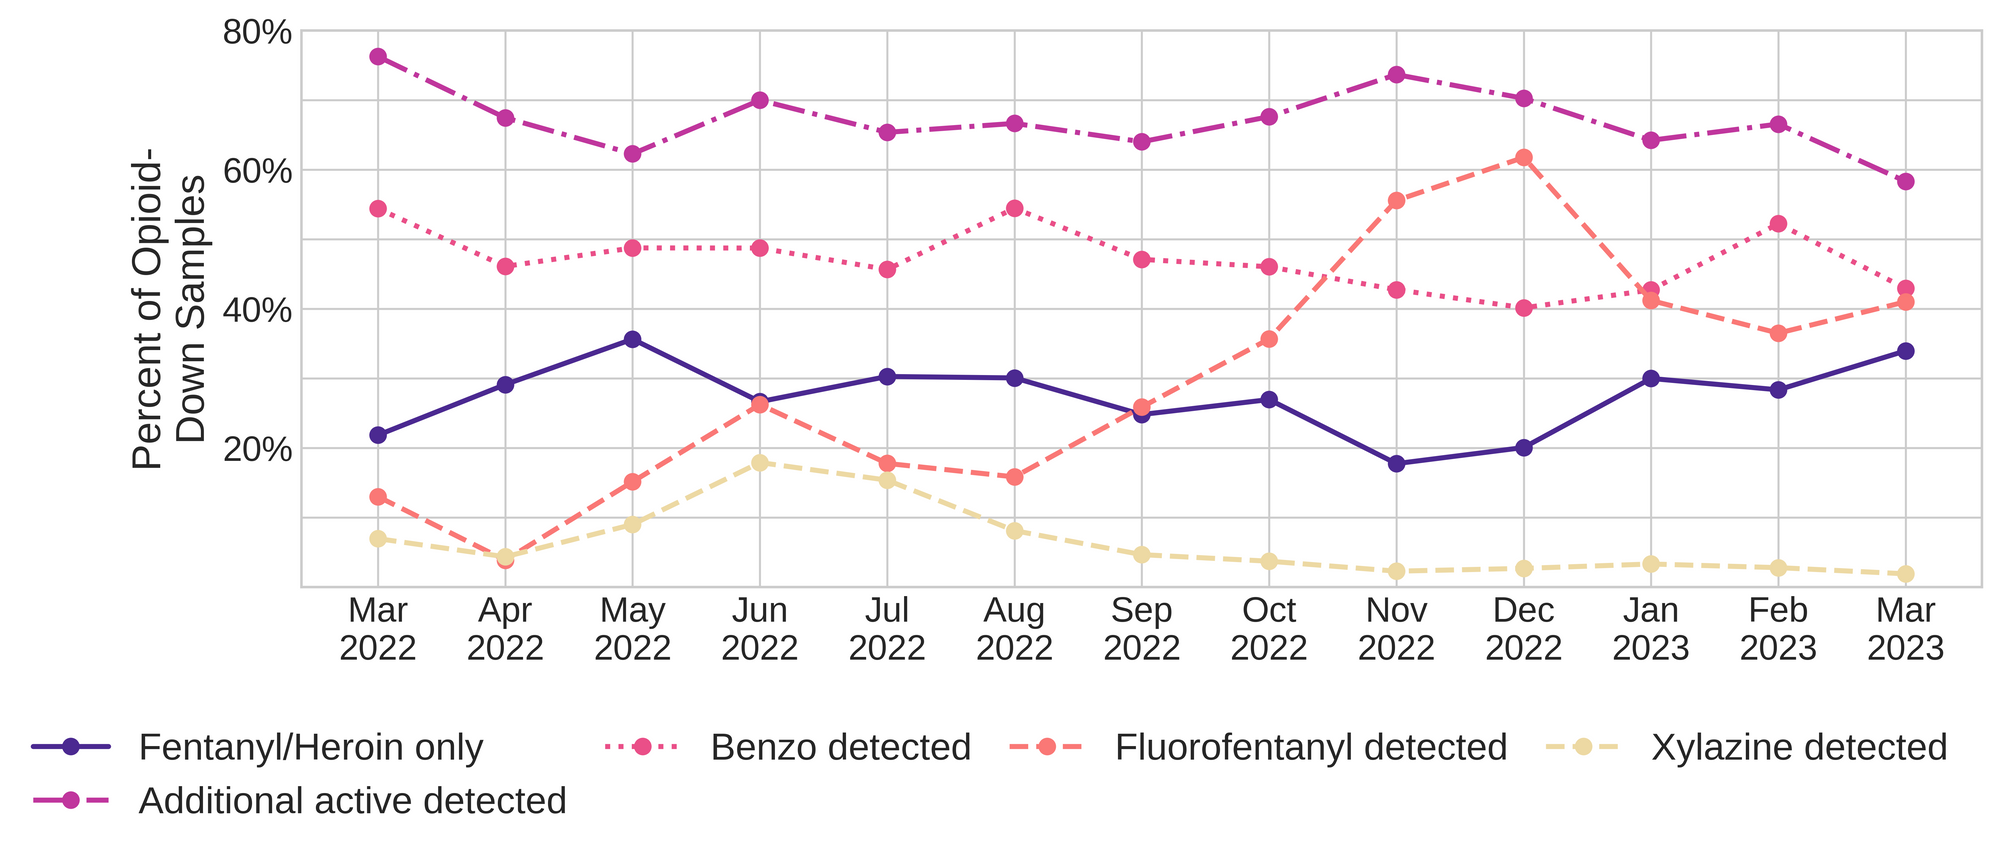
Fluorofentanyl was the most common additional active found within the opioid-down supply, with 35% (163/468) of opioid-down samples containing fluorofentanyl in addition to fentanyl. Additionally, fluorofentanyl was the only opioid detected in 6% (29/468) of opioid-down samples (i.e. no fentanyl or heroin was detected in these samples).
Benzo-related drugs contribute to a majority of the other additional actives found in expected opioid-down samples, with 43% (201/468) of expected opioid-down samples checked containing a benzo-related drug. Bromazolam continues to be the most common benzo seen in the down supply, with bromazolam being detected in 74% (149/201) of the benzo-positive opioid-down samples. Scattered detections of other drugs are still found and can be reviewed in the pdf report at the end of this blog.
Quantification for Expected Opioid-Down[1]
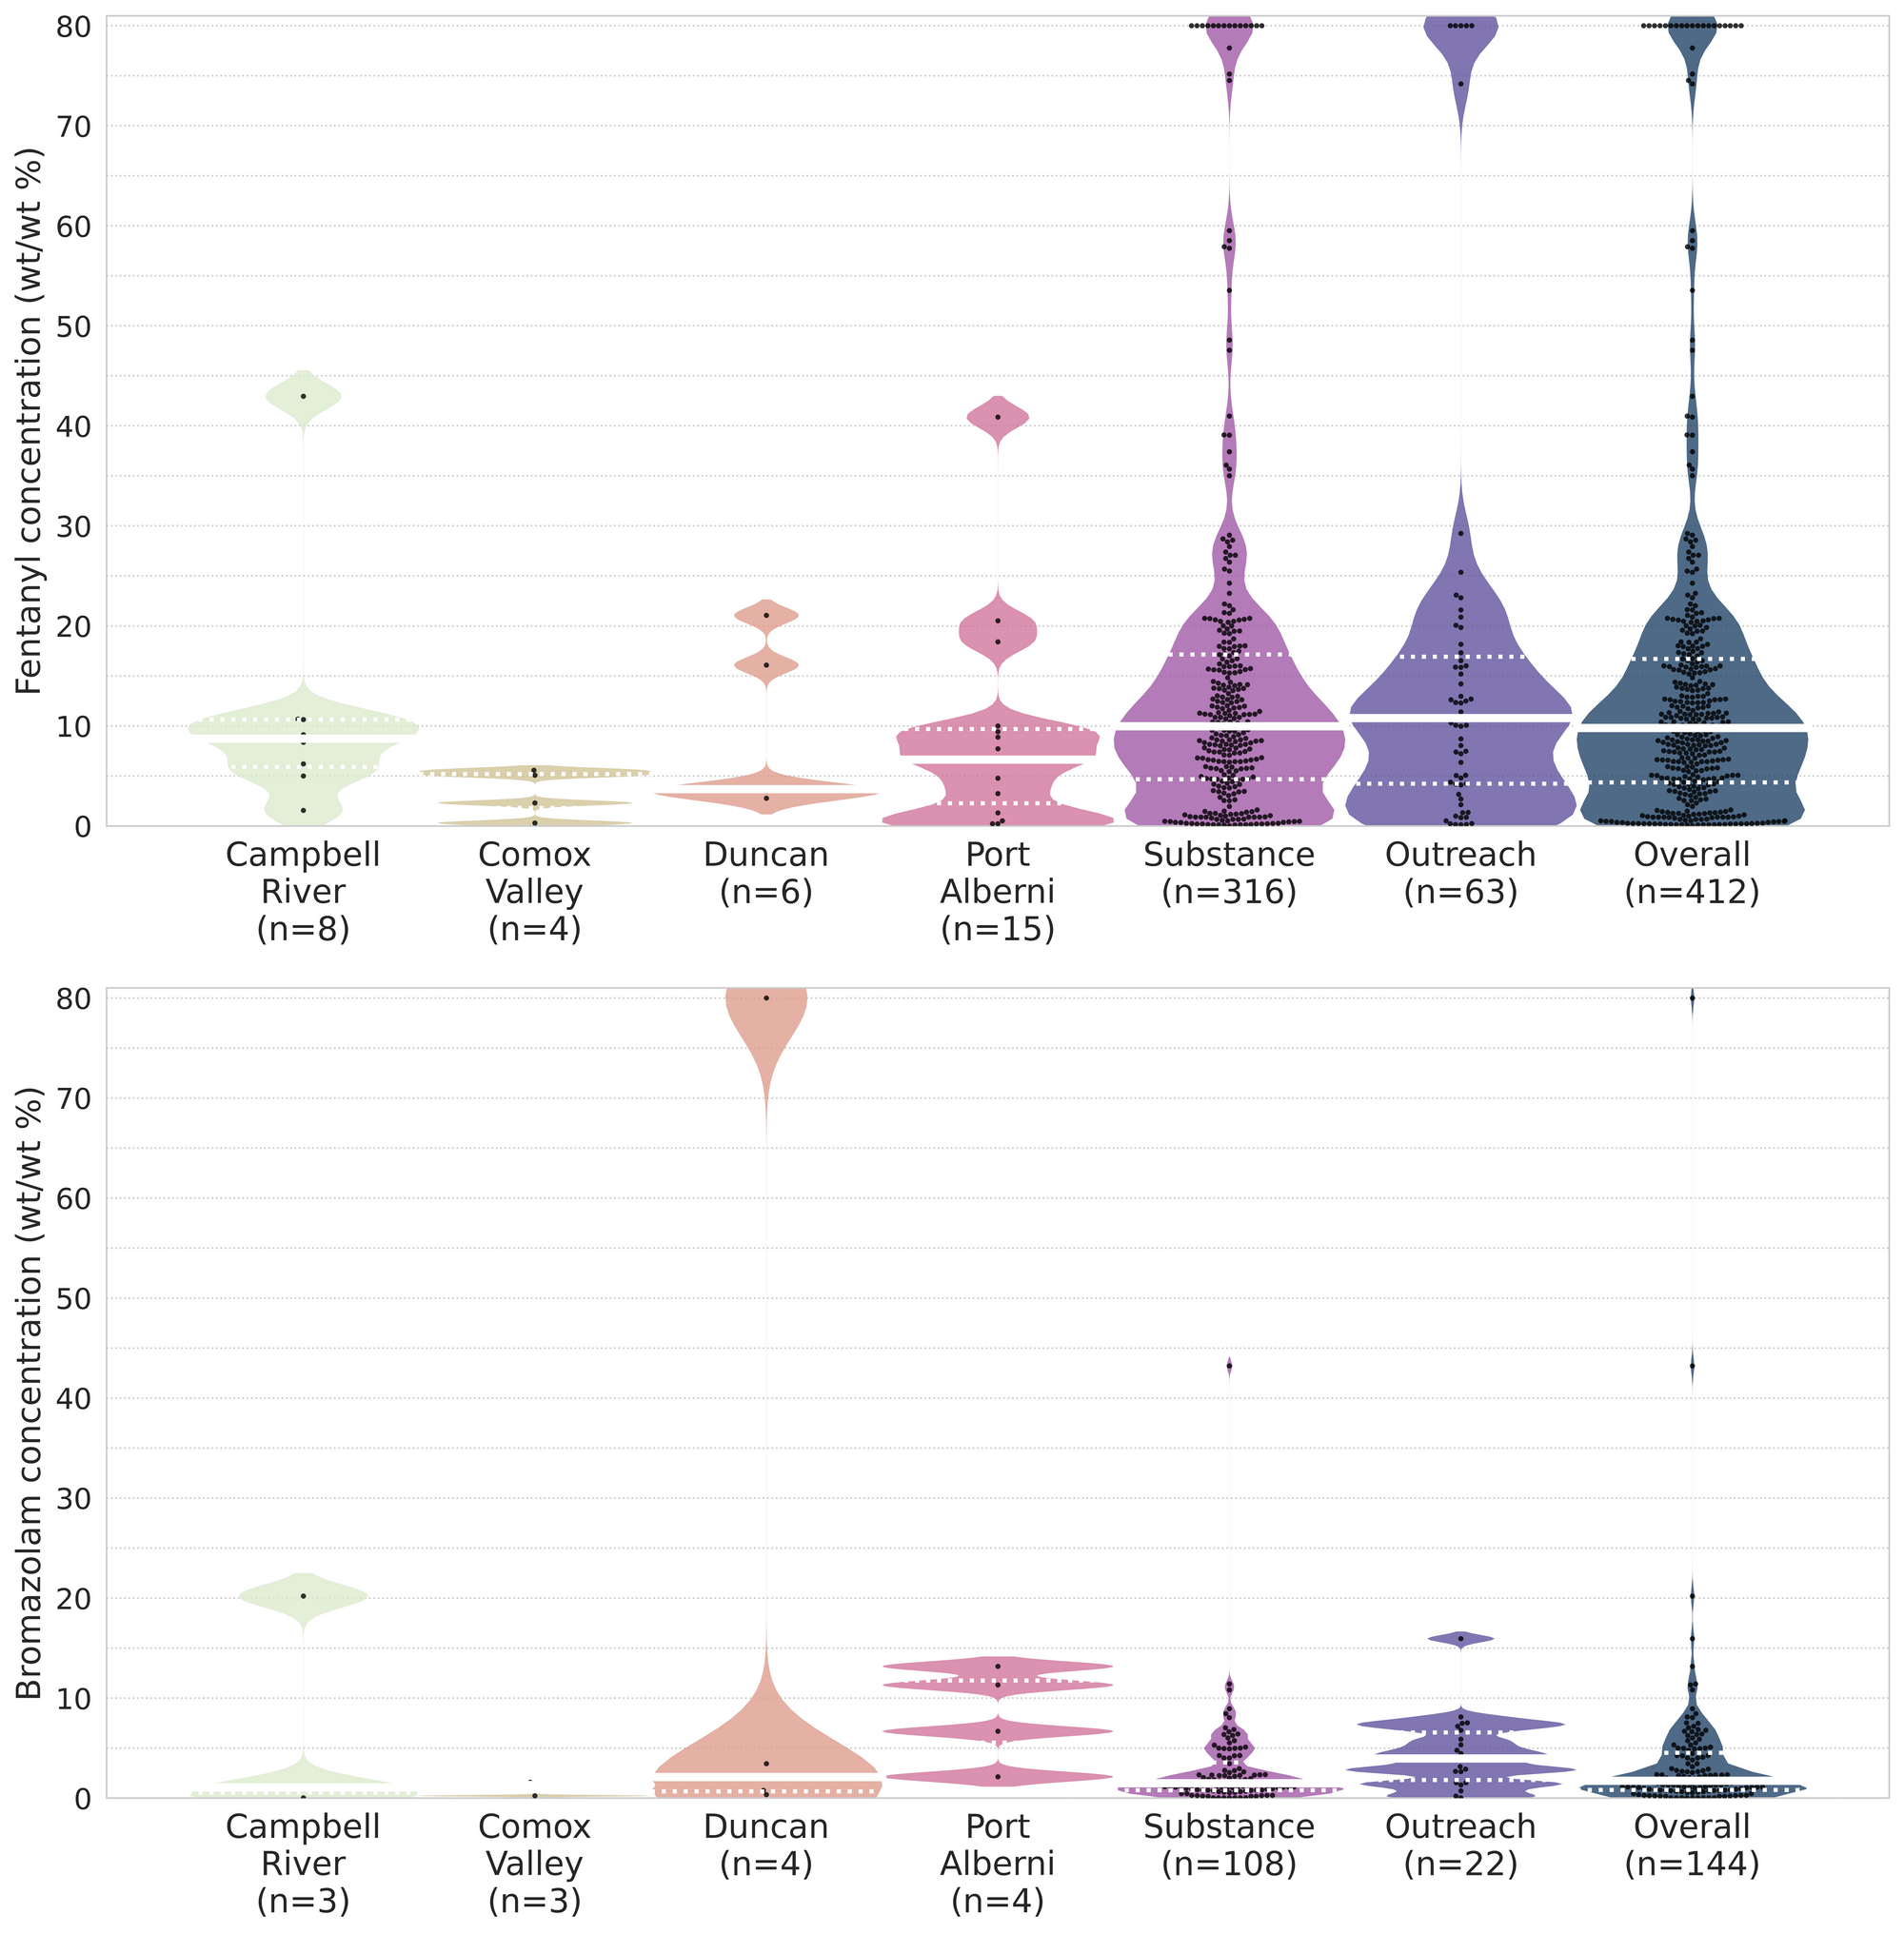
In March, we quantified fentanyl for 412 of the expected opioid-down samples containing fentanyl and found the median concentration to be 9.8%[2]. Though the median is a useful indicator, it doesn’t capture the volatility of fentanyl concentrations present in the opioid supply, as half of fentanyl-positive down samples contained between 4.4% and 16.7% fentanyl, and any one sample might be the lowest strength (0.1%) or the strongest (>80%[3]). Similarly, the concentration of bromazolam was across the board in expected opioid down samples, with samples ranging from 0.1% to >80% bromazolam, with a median of 1.7%.
Not all opioid down samples brought to our service can be quantified. This is primarily due to too limited sample collected for our instruments to report a reliable mass percentage. Nevertheless, qualitative detection is still possible. ↩︎
This number is specific to fentanyl quantified in opioid-down samples. The median concentration listed in the Key Findings at the beginning of this blog (9.6%) is inclusive of all samples checked, across all drug classes, that contained fentanyl. ↩︎
For samples that contain more than 80% fentanyl, or more than 25% etizolam by weight, our mass spectrometer is presently unable to reproducibly assign a concentration due to the upper limits of the calibration methods currently adopted. ↩︎

The fentanyl and bromazolam concentrations that we quantified in March, across all expected drug categories, are presented in Fig. 4. Black dots are individual opioid-down samples, Horizontal white bars show the median concentrations of fentanyl and bromazolam quantified, dashed white lines bound half of the quantified samples, and the width of the shaded regions mirrors the number of samples at a given concentration.
Want to be notified when we release these reports? Join our mailing list to receive updates about when our reports are out. You can subscribe and unsubscribe yourself from this list at any time.
Check back next month for the April report!
As always, send us feedback at substance@uvic.ca on how we can continue to offer our drug checking results in a useful way.