June 2025 Monthly Report

In this blog post, we discuss our June 2025 report and provide more information on how to interpret the results. The PDF report can be found at the end.
Key findings:
- The median fentanyl concentration found across all drug categories was 8.1%
- The median fluorofentanyl concentration found across all drug categories was 6.4%
- The median ortho-methyl fentanyl concentration found across all drug categories was 1.7%
- Benzodiazepines were found in 36.5% (73/200) of expected Opioid - Down samples
- Bromazolam was found in 38 Opioid - Down samples with a median concentration of 3.6% and maximum concentration of 11.9%
- Carfentanil was found in 24 Opioid - Down samples with a median concentration of 0.3% and a maximum concentration of 4.9%
- Xylazine was found in 4 expected Opioid - Down samples with a median concentration of 0.4% and a maximum concentration of 1.3%
- Medetomidine was found in 4 expected Opioid - Down samples with a median concentration of 2% and a maximum concentration of 2.8%
Report Insight
This blog, and the associated pdf report, breakdown our sample counts into six categories:
- Samples received through direct service provision in Victoria, where service users are bringing samples into the Substance storefront. These samples are labelled as “Substance” samples in the figures/tables of this blog post
- Samples received through direct service provision in Campbell River, where service users bring samples either to the Vancouver Island Mental Health Society (VIHMS) or Campbell River AVI Health & Community Services. These samples are labelled as “Campbell River”
- Samples received through direct service provision in the Comox Valley, where service users are bringing samples to AVI Health & Community Services in Courtenay, BC. These samples are labelled as “Comox Valley”
- Samples received through direct service provision in the Cowichan Valley, where service users bring samples to the Duncan Lookout Society OPS in Duncan, BC. These samples are labelled as “Duncan”
- Samples received through direct service provision in Port Alberni, where service users bring samples into Port Alberni Shelter Society’s OPS. These samples are labelled as “Port Alberni”
- Samples received through direct service provision in Port Hardy, where service users bring samples into Island Health Mental Health and Substance Use. These samples are labelled as “Port Hardy”
- Samples received through indirect service provision, where samples are collected through no-contact drop-off envelopes, are collected by harm reduction workers and other community members at supported housing sites, overdose prevention sites, supervised consumption locations, and the Hospital sample submission kiosks located in Victoria, Nanaimo, and Campbell River. These samples are labelled as “Outreach” samples in the figures/tables herein. Junes Outreach data includes samples collected at Otherworld, A Vancouver Island Regional Arts Event.
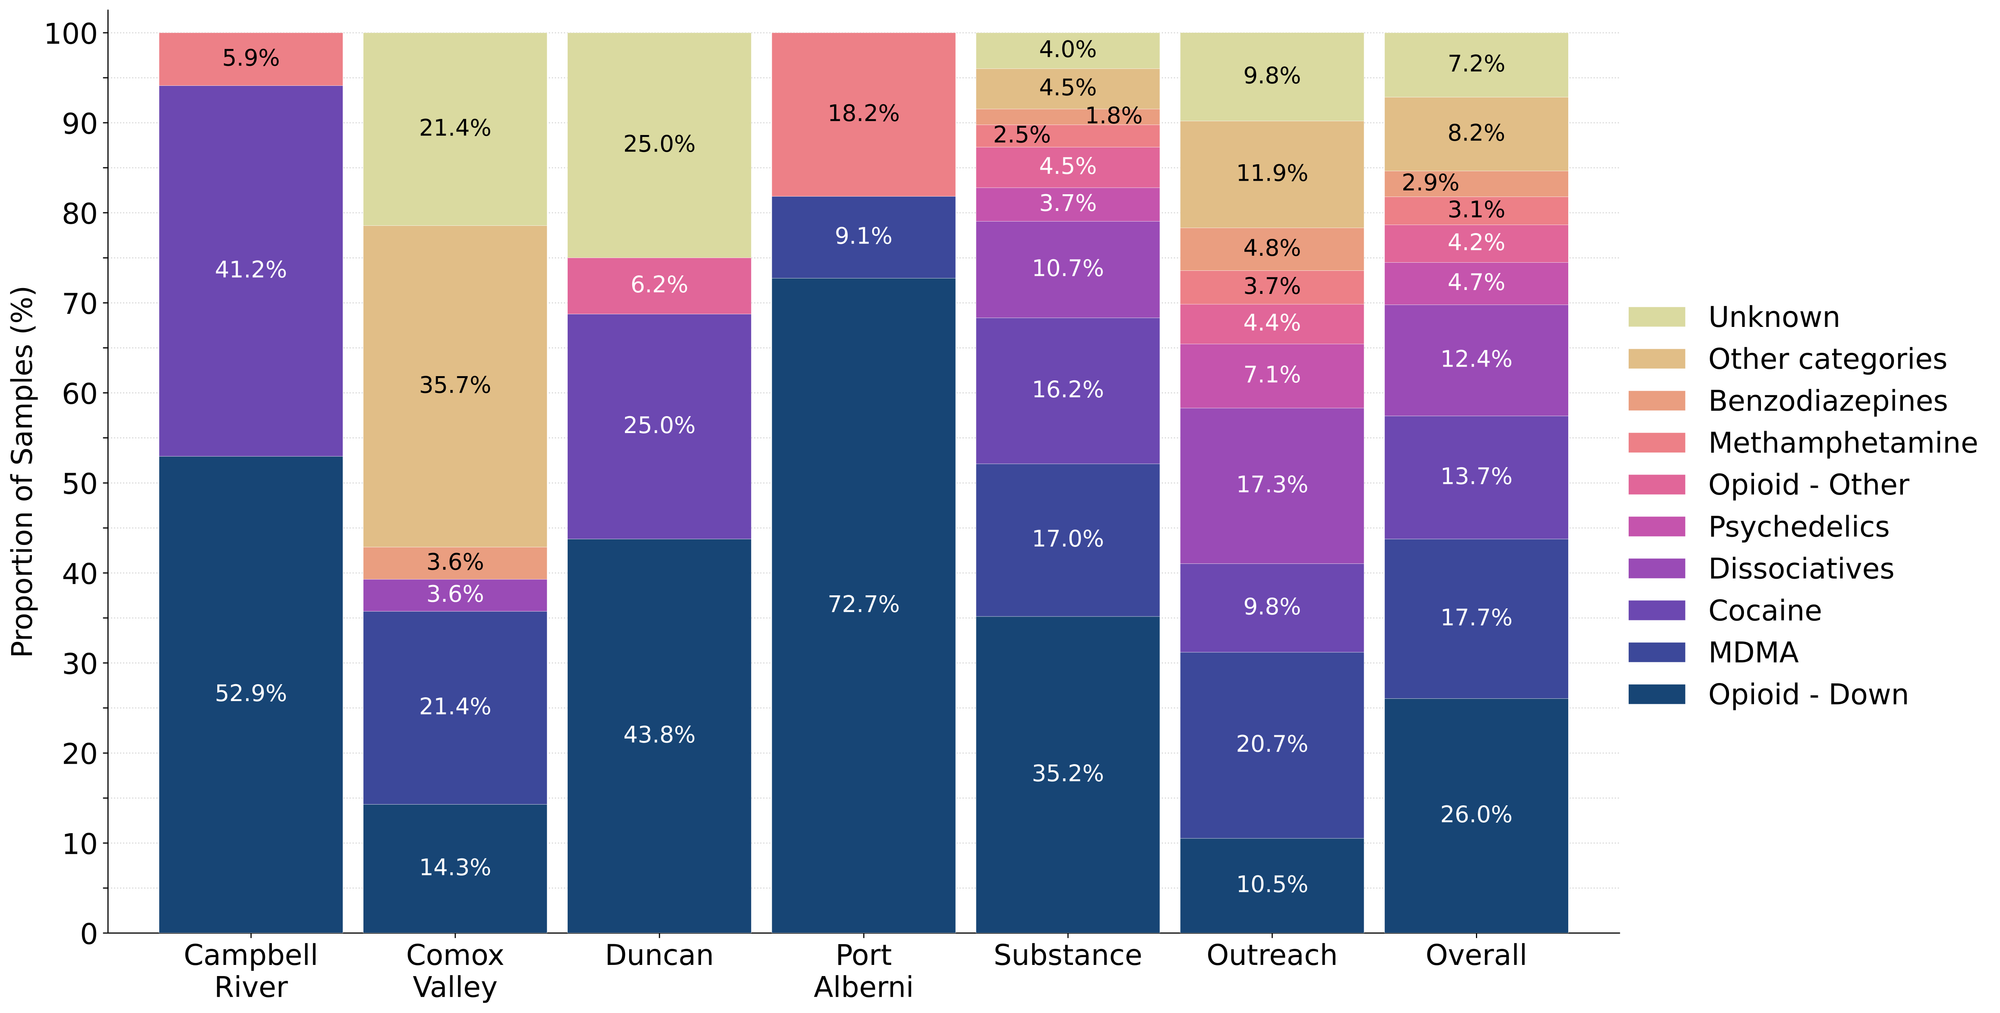
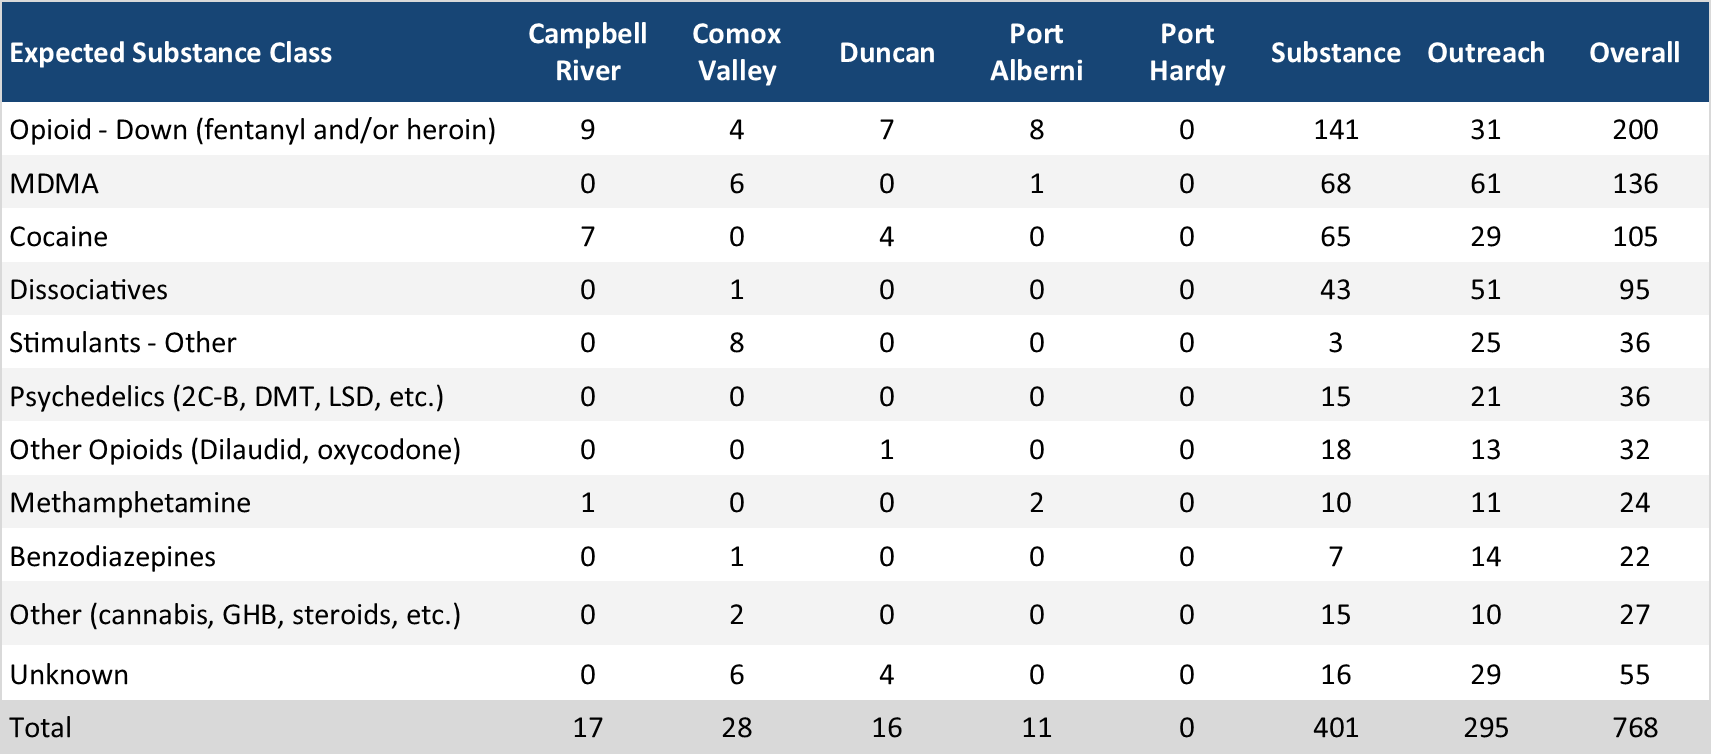
Drug types
Day to day at Substance, we receive and check a wide variety of different samples. Figure 1 shows the prevalence of each expected drug category checked, split by sample collection location/method. Table 1 shows the number of samples received at each sample collection location per expected drug category.
The Sample Breakdown
For the majority of samples checked, we confirm the presence of the expected drug with no additional active compounds detected above the limitations of the drug check. The bar charts below highlight a few classes of drugs, differentiating samples where only the expected active component was detected - from situations when other unexpected active components were detected.
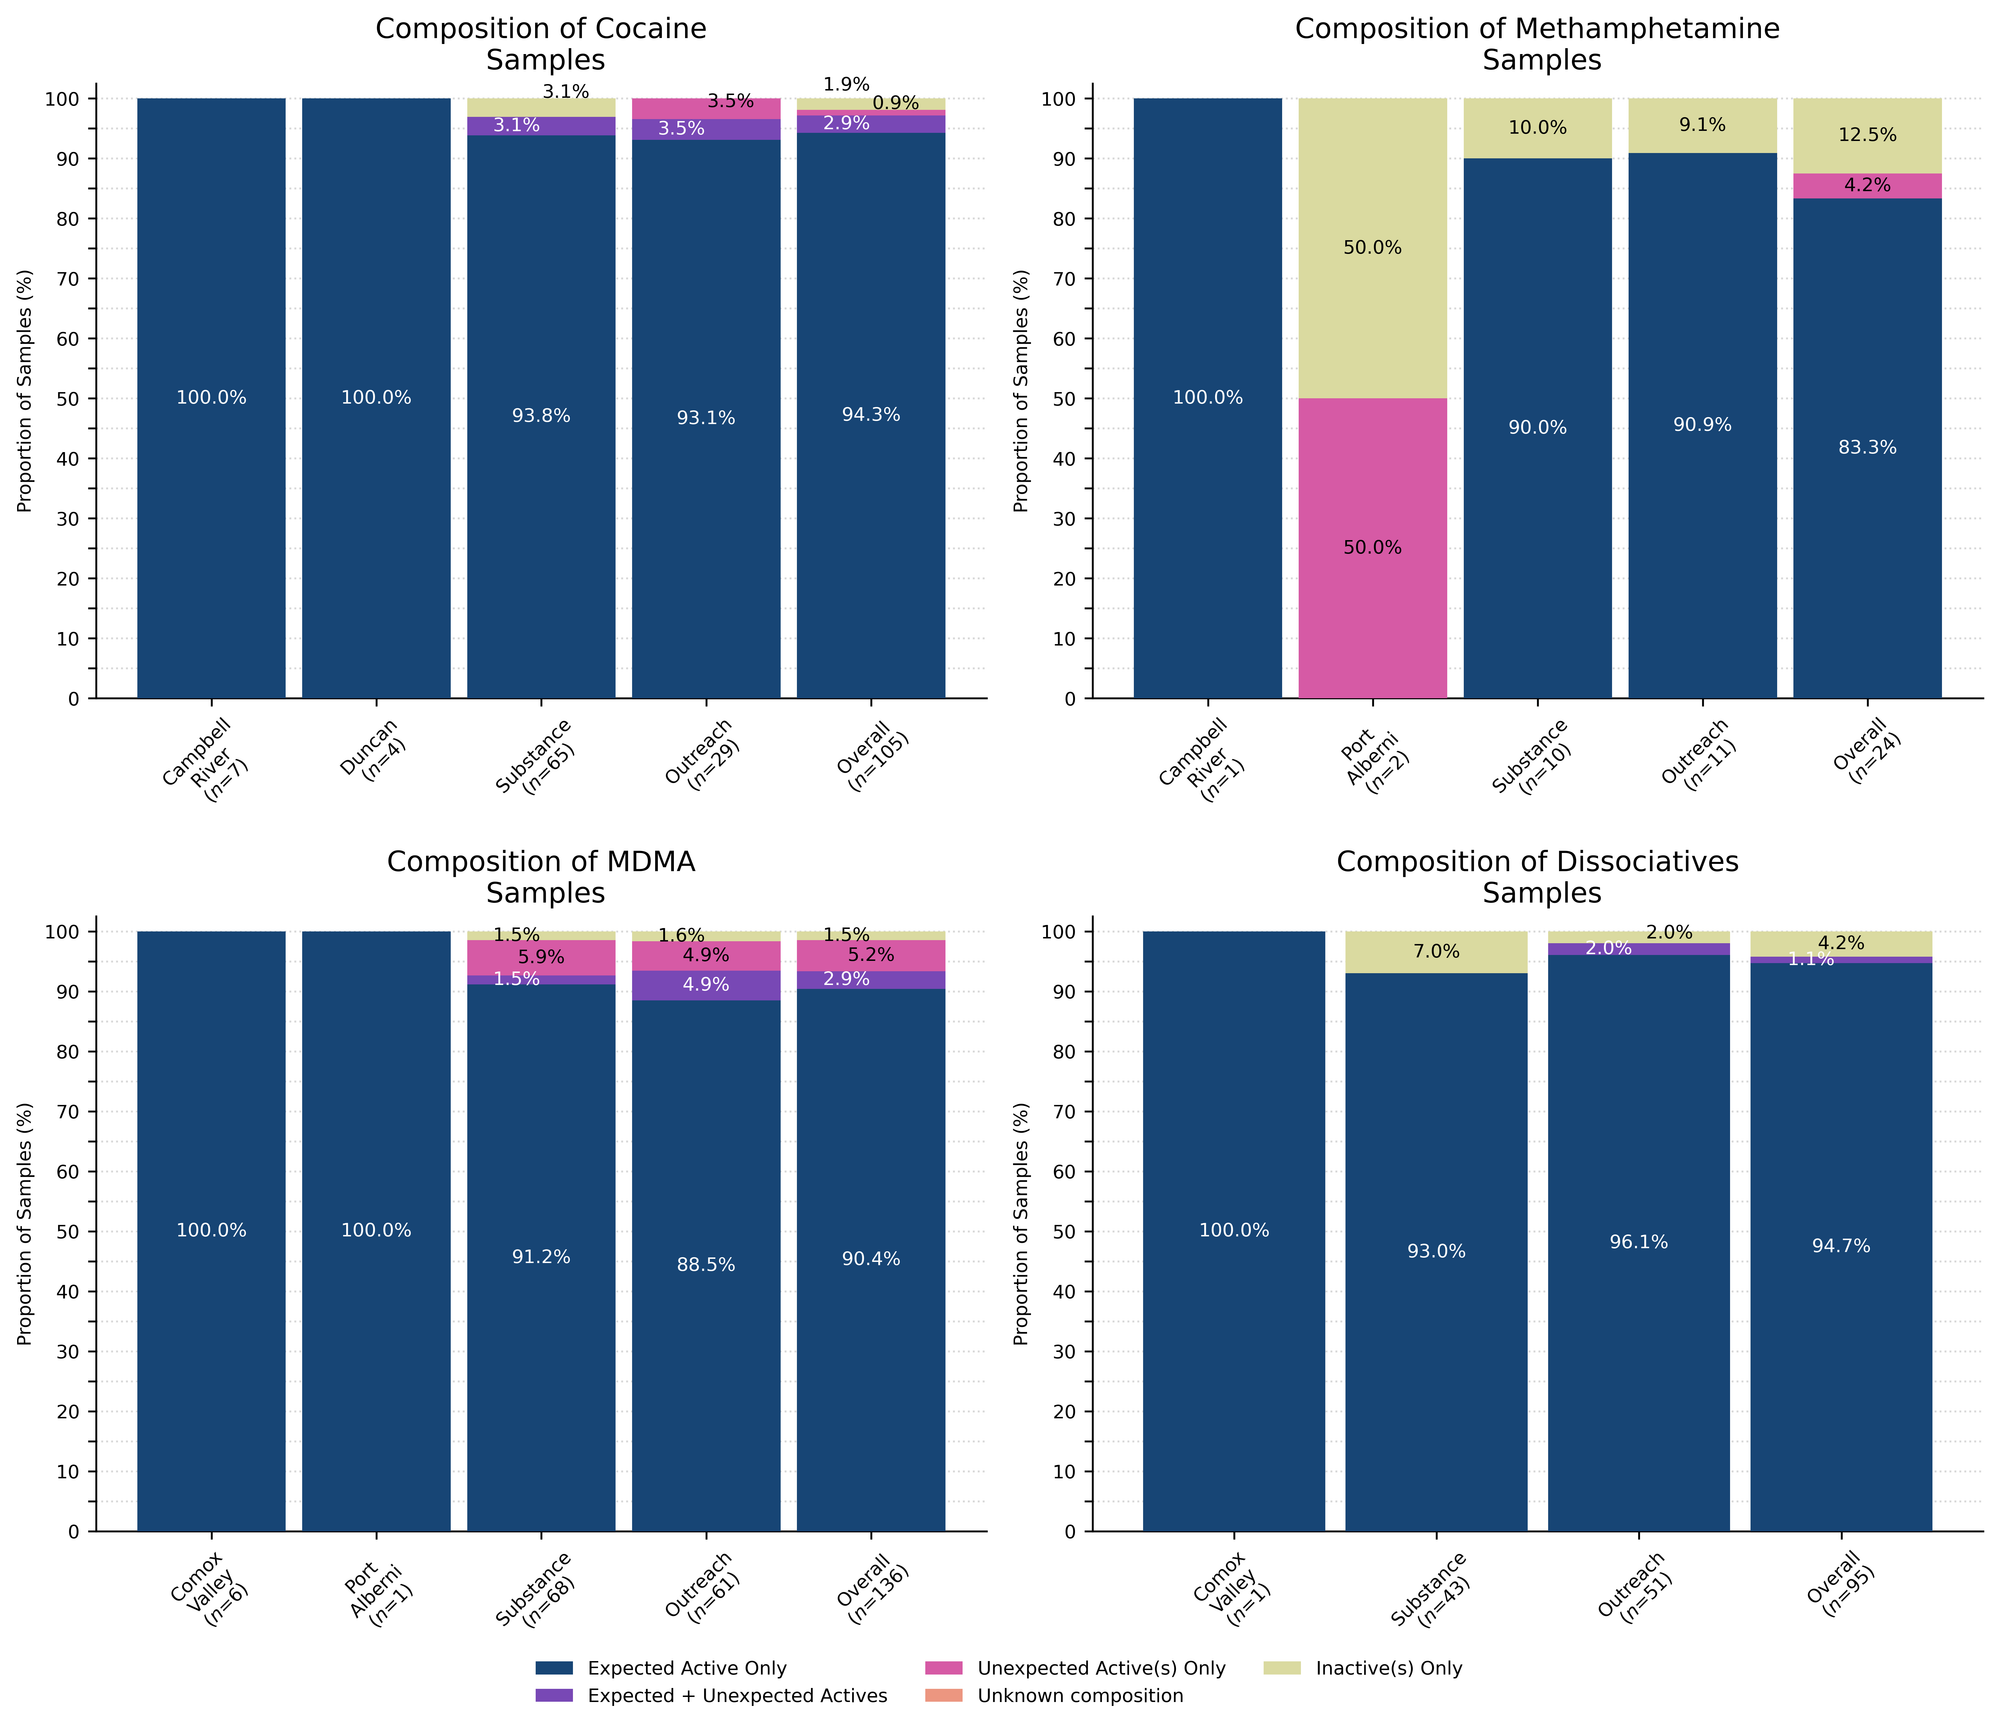
Dissociatives
94.7% (90/95) of expected dissociatives samples were as expected
The remaining samples are as follows:
- 1 expected MXPR (Methoxpropamine) samples contained also contained 3-HO-PCE
- 4 expected ketamine samples did not have any actives detected
Cocaine
94.3% (99/105) of expected Cocaine samples were as expected
The remaining samples are as follows:
- 1 expected cocaine sample was ketamine instead
- 3 expected cocaine samples also contained levamisole
- 1 expected crack sample along with 1 expected cocaine sample did not have any actives detected
Methamphetamine
83.3% (20/24) of expected Methamphetamine samples were as expected
The remaining samples are as follows:
- 1 expected methamphetamine sample was ketamine instead
- 3 expected methamphetamine samples had no actives detected
MDMA/MDA
90.4% (123/136) of expected MDMA/MDA samples were as expected
The remaining samples are as follows:
- 2 expected MDA samples were MDMA instead
- 3 expected MDMA samples were MDA instead
- 1 expected MDMA sample was amphetamine instead
- 1 expected MDMA sample was Eutylone and an unknown cathinone instead
- 2 expected MDMA samples also contained MDA
- 1 expected MDMA sample also contained ketamine
- 1 expected MDMA sample also contained MDA and Tadalafil (Cialis)
- 2 expected MDMA samples did not have any actives detected
Benzodiazepines (n=22)
36.4% (8/22) of the expected benzodiazepine samples checked in June came to our service sites in the form of pressed pills with the following expected and detected compositions:
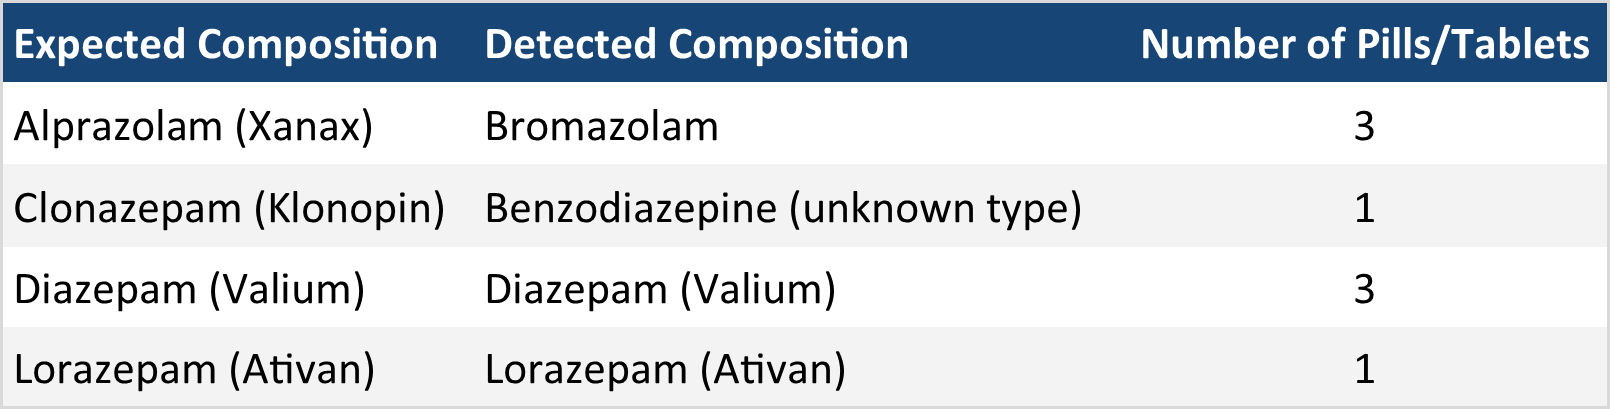
Within the remaining 12 samples:
- 4 expected bretazenil samples were bretazenil
- 3 expected etizolam samples were etizolam
- 3 expected bromazolam samples were flualprazolam instead
- 1 expected alprazolam (Xanax) samples was alprazolam (Xanax)
- 1 expected phenazolam sample was phenazolam
- 1 expected bromazolam sample was bromazolam
The remaining benzodiazepine sample did not have any actives detected
Opioid-positivity in non-opioid-down samples
In June, we checked 513 samples that were not expected to contain fentanyl or other “unexpected” opioids[1]. Since the opioid-down supply is no longer “just heroin” or “just fentanyl” and is instead a complex, potent, and ever-changing polysubstance market containing other synthetic opioids like fluorofentanyl or nitazenes, here we will examine the prevalence of any unexpected opioid, not just fentanyl, detected in non-opioid-down samples.
Specifically, we are excluding samples that were expected to be “opioid-down” or samples that had an “unknown/missing” expected composition. In the case of “opioid-other” samples, e.g. hydromorphone tablets and oxycodone pills, “unexpected opioids” are defined as any opioid that is not the expected opioid. ↩︎
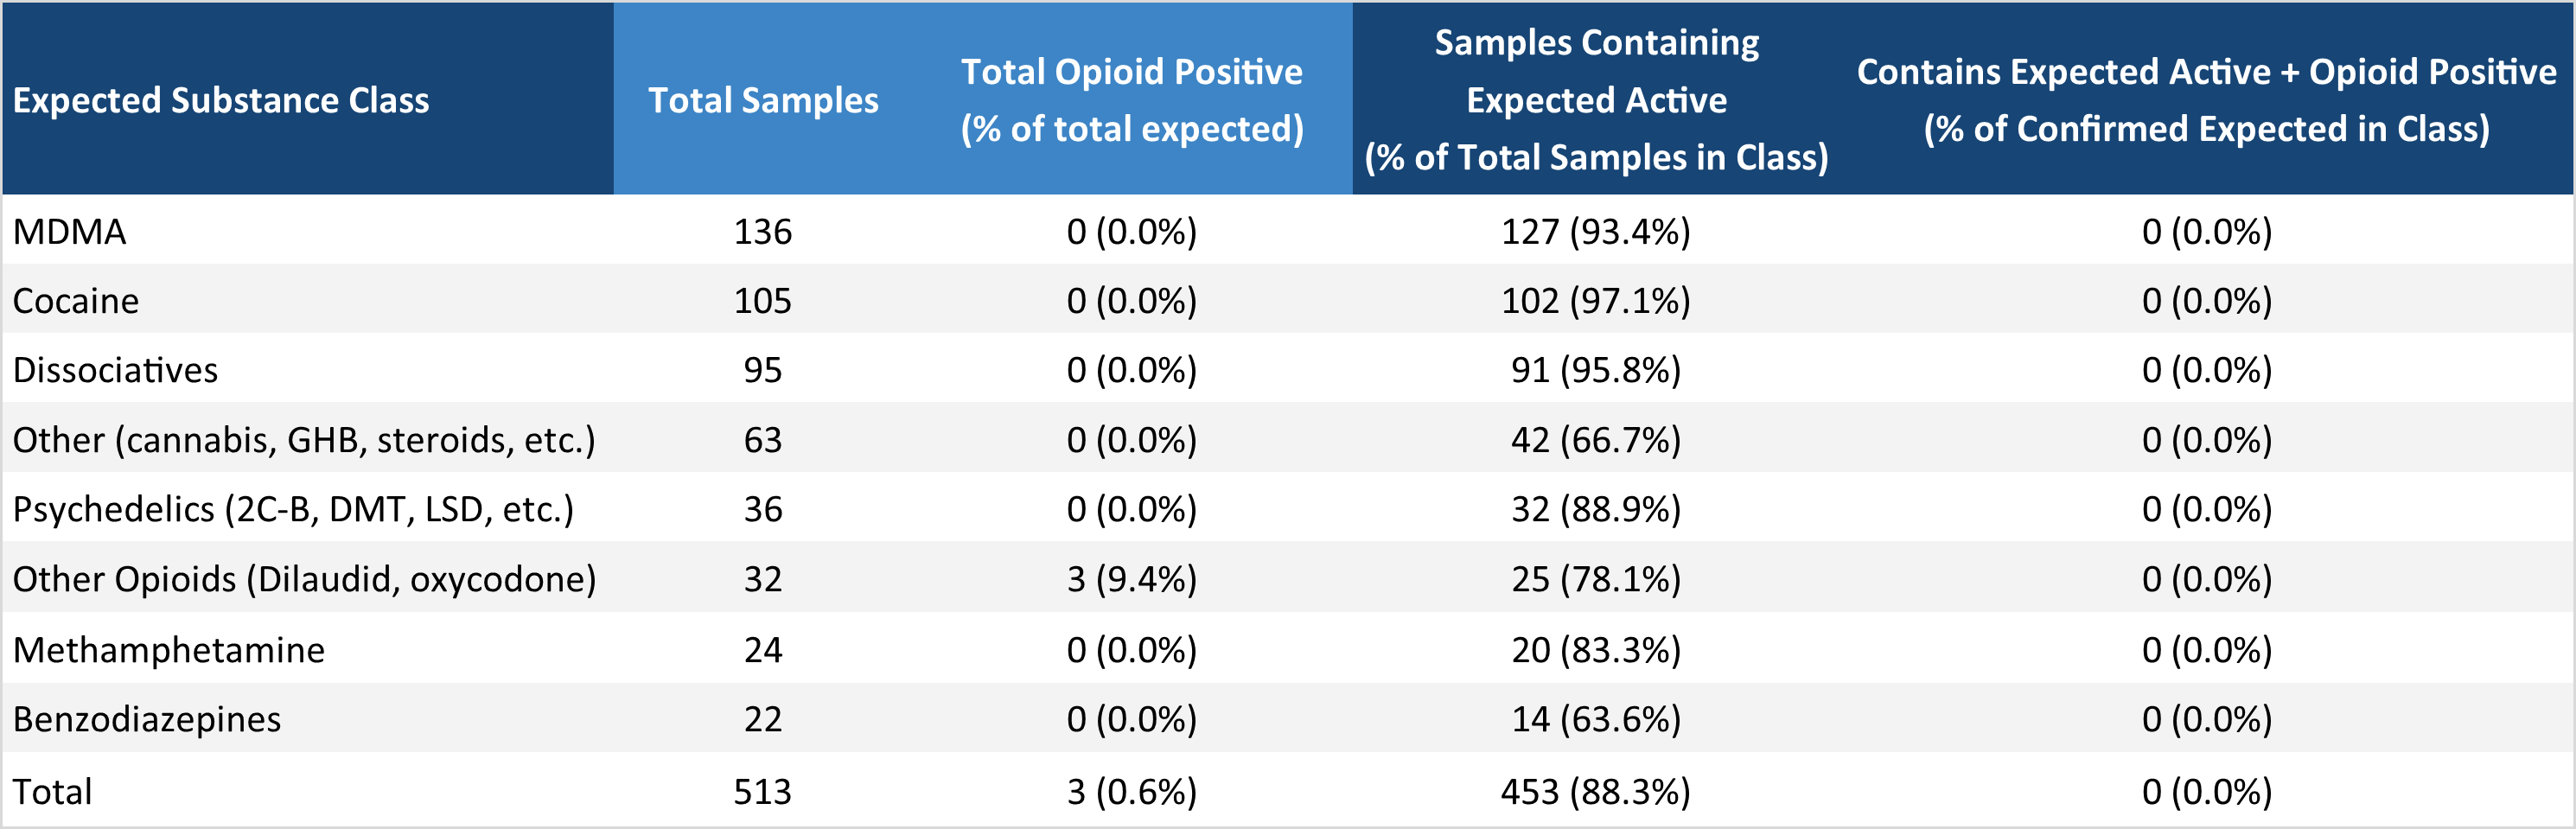
Examining Table 3, we find that 3 samples tested positive for unexpected opioids in June, representing 0.6% of all non-opioid-down samples checked. These samples were as follows:
Expected Opioid - Other samples:
- 2 expected Percocet samples contained metodesnitazene
- 1 expected hydromorphone (Dilaudid) sample contained fluorofentanyl base and N-propionyl norfentanyl
In June, no unexpected opioids were detected in samples expected to be MDMA, cocaine, dissociatives, benzodiazepines, psychedelics, methamphetamine, and other.
In people’s personal quests for bodily autonomy and informed consumption, there is often evaluation of risk and consequence, but when the consequences can be severe and the risks are unknown or are intentionally exaggerated, these become difficult, if not impossible, conversations to weigh. We believe that drug checking can help provide people with the information needed to evaluate the risks, and provides harm reduction advice to minimize undesired consequences of substance use. These data are not meant to downplay concerns or invalidate past experiences. We recognize the tragic consequences of when fentanyl is found in non-opioid samples and honour the heartbreak that such experiences produce. Instead, we present these data with the intent to combat misinformation and provide an evidence-based context for people to consider when making decisions about substance use. While these numbers reflect what we have seen over the course of the project, these (roughly) 1-in-100 events still occur, so we always encourage folks to get their stuff checked.
Opioid-Down (n=200)
In this section we present results specific to the opioid-down supply, therefore they may differ from the highlighted findings above that are inclusive of all expected drug categories.
- 32% (68/200) of expected opioid-down samples contained fentanyl as the only active opioid
- 32% (64/200) of expected opioid-down sample contained fluorofentanyl as the only active opioid
- 16 samples contained heroin, of these samples, 13 contained the related alkaloid acetylcodeine and/or acetylmorphine (MAM). In total, this represents 8% of all opioid - down samples.
- 9/16 samples which contained heroin also contained fentanyl or a fentanyl analogue
- 12% (24/200) of expected opioid-down samples contained carfentanil
- 5% (10/200) of expected opioid - down samples contained ortho-methyl fentanyl
- 36.5% (73/200) of expected opioid-down samples contained a benzodiazepine
- The most common benzodiazepine in opioid-down samples was bromazolam (39), followed by benzodiazepine (unknown type) (25), desalkylgidazepam (14)
- Xylazine was detected in 2% (4/200) of opioid-down samples
- Medetomidine was detected in 2% (4/200) of opioid-down samples
- Nitazenes were not detected in any opioid-down samples this month
Scattered detections of other drugs are still found and can be reviewed in the pdf report at the end of this blog.
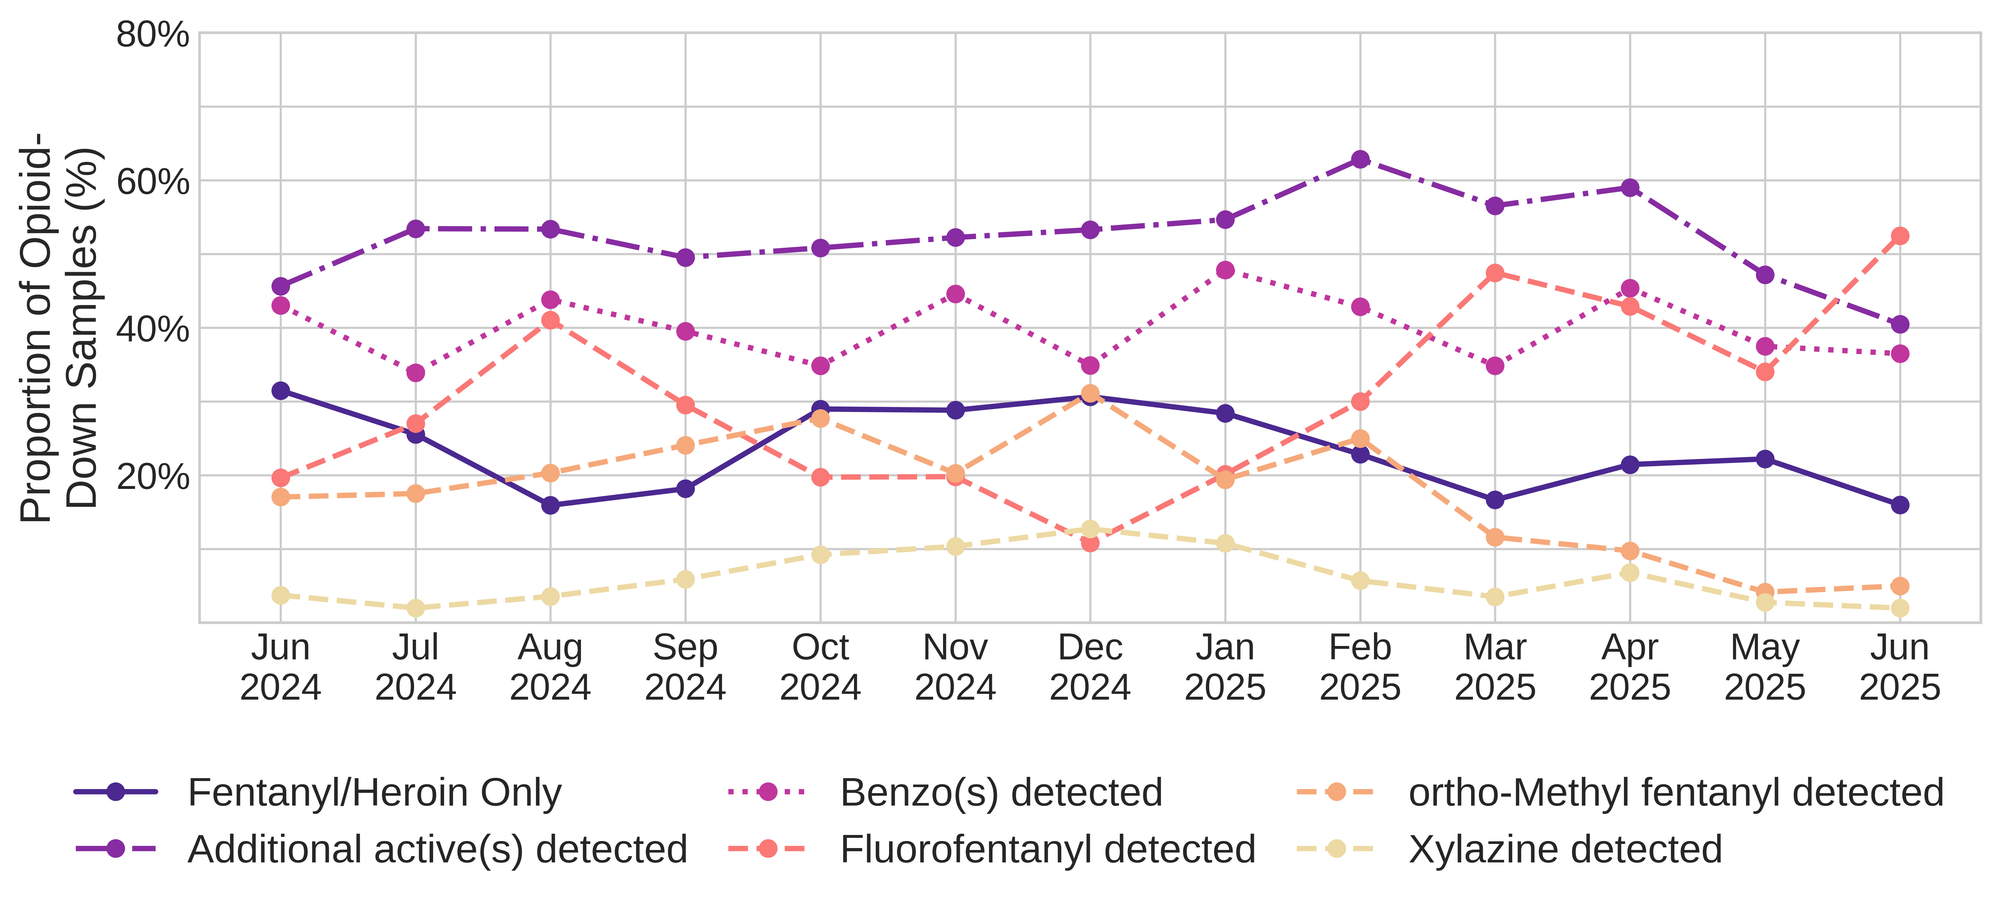
In June, 40.5% (81/200) of all opioid-down samples checked contained an additional active to the expected fentanyl/heroin. These data are shown in Fig. 3 highlighting the prevalence of benzos, fluorofentanyl, ortho-methyl fentanyl, and xylazine in the down supply.
Quantification for Expected Opioid-Down[1]
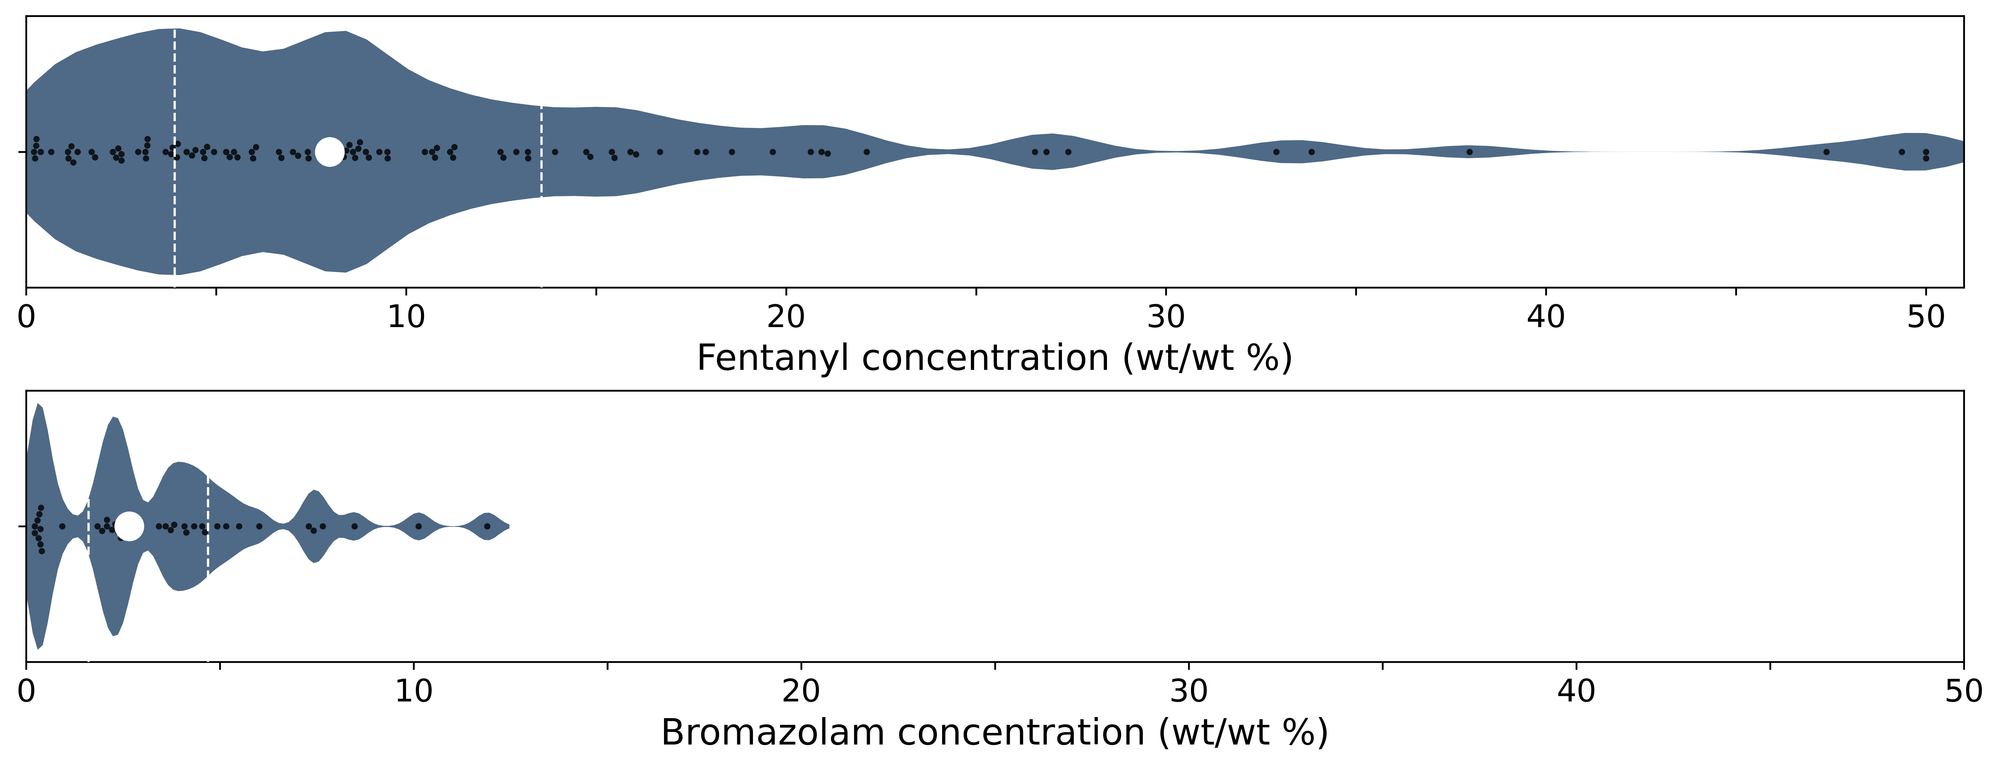
In June, we quantified fentanyl for 100 of the expected opioid-down samples containing fentanyl and found the median concentration to be 8.1%[2]. Though the median is a useful indicator, it doesn’t capture the volatility of fentanyl concentrations present in the opioid supply, as half of fentanyl-positive down samples contained between 4.0% and 13.4% fentanyl, and any one sample might be the lowest strength (0.2%) or the strongest (greater than 50%[^3]). Fluorofentanyl was seen at concentrations ranging from 0.2% to greater than 50% as well, with a median concentration of 6.4%. In June, we quantified ortho-Methyl fentanyl in 8 opioid - down samples at a median concentration of 1.7%, with half of ortho-Methyl fentanyl positive down samples containing between 1.1% and 3.1% ortho-Methyl fentanyl. Bromazolam, the most common benzodiazepine adulterant in down samples, had concentrations ranging from 0.2% to 11.9% bromazolam, with a median of 3.6%. Finally, medetomidine, a tranquilizer often used in veterinary medicine, was quantified in 4 samples, with concentrations ranging from 0.7% to 2.8%, with a median of 2%.
[3]: For samples that contain greater than 50% fentanyl, heroin, fluorofentanyl, or bromazolam by weight, our mass spectrometer is presently unable to reproducibly assign a concentration due to the upper limits of the calibration methods currently adopted.
Not all opioid down samples brought to our service can be quantified. This is primarily due to too limited sample collected for our instruments to report a reliable mass percentage. Nevertheless, qualitative detection is still possible.d ↩︎
This number is specific to fentanyl quantified in opioid-down samples. The median concentration listed in the Key Findings at the beginning of this blog (8.1%) is inclusive of all samples checked, across all drug classes and unknown samples, that contained fentanyl. ↩︎
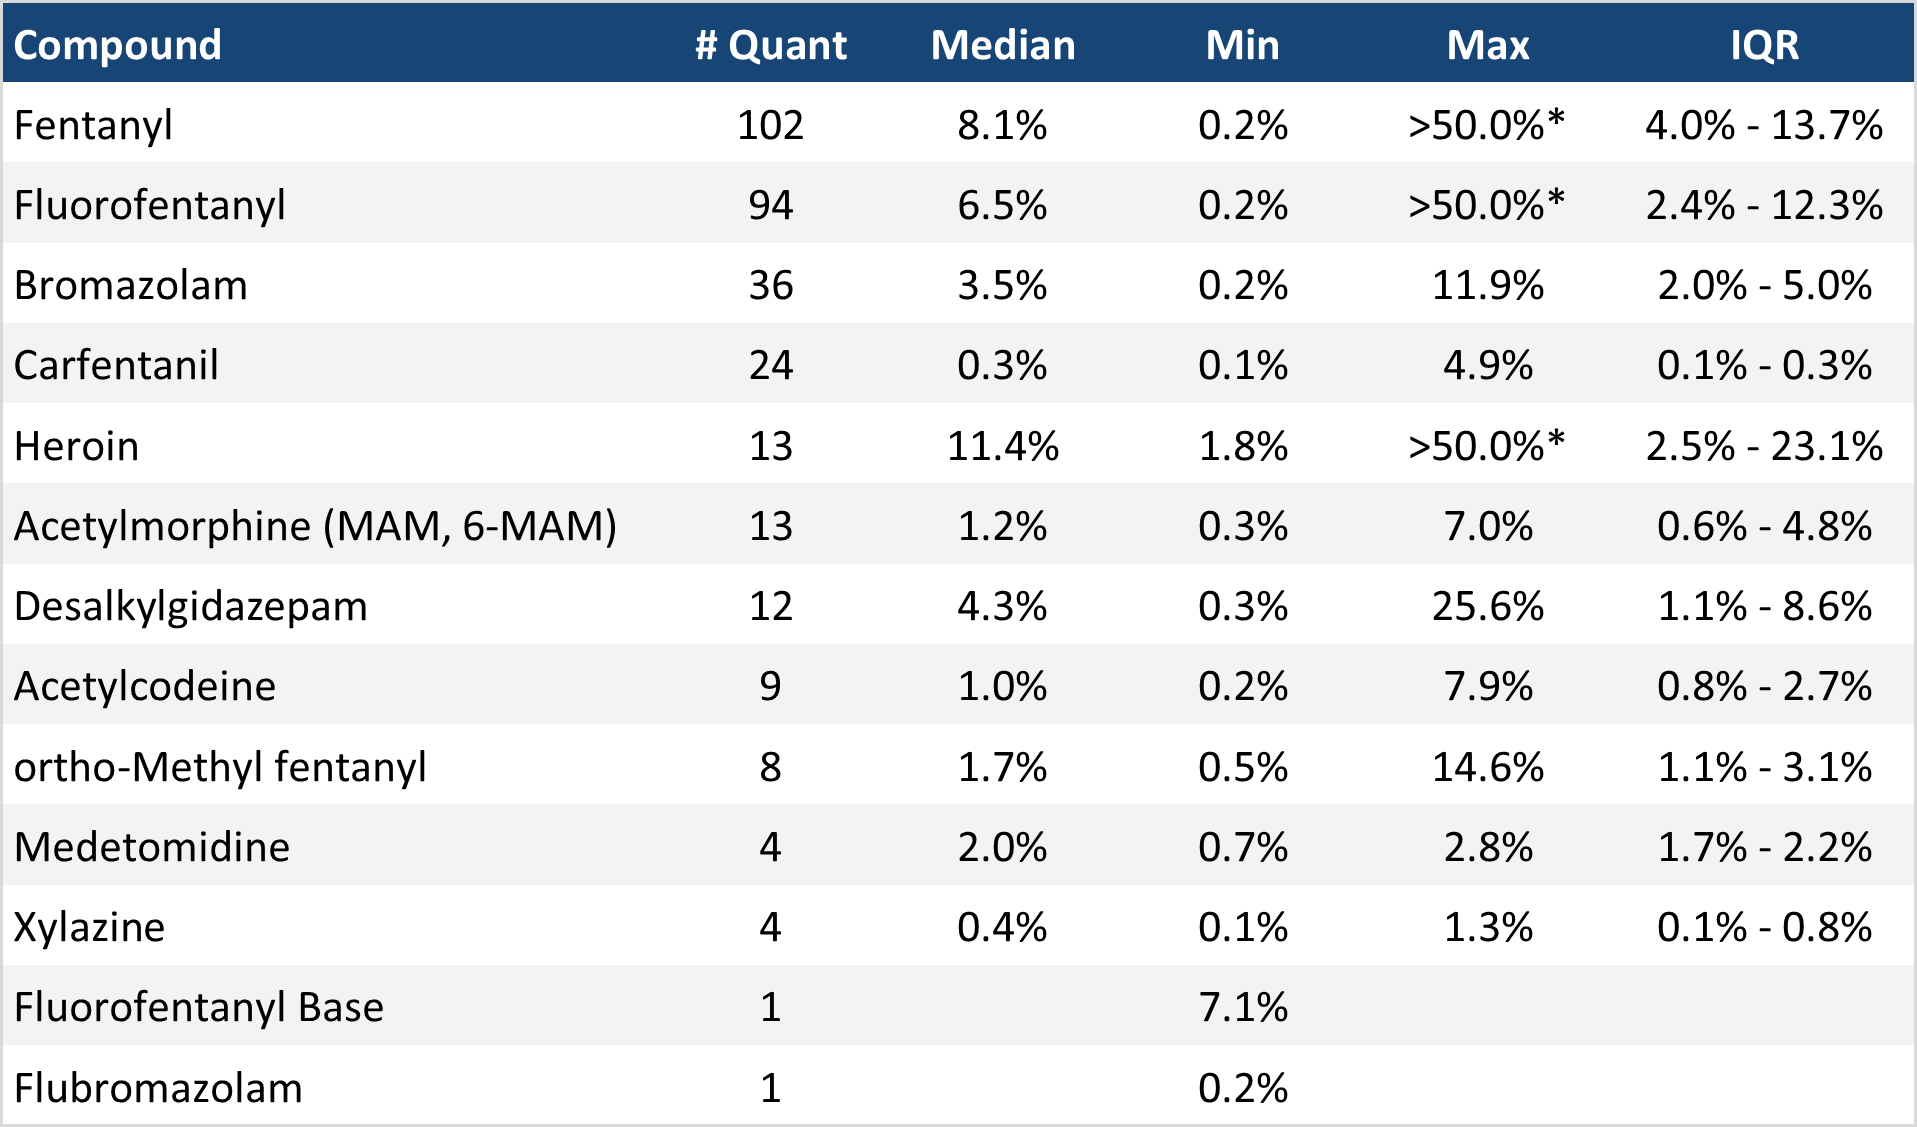
The fentanyl and bromazolam concentrations that we quantified in June, across all expected drug categories and service models, are presented in Fig. 4. Small black dots are individual opioid-down samples, the large white dot shows the median concentration, dashed white lines bound half of the quantified samples, and the width of the shaded regions mirrors the number of samples at a given concentration.
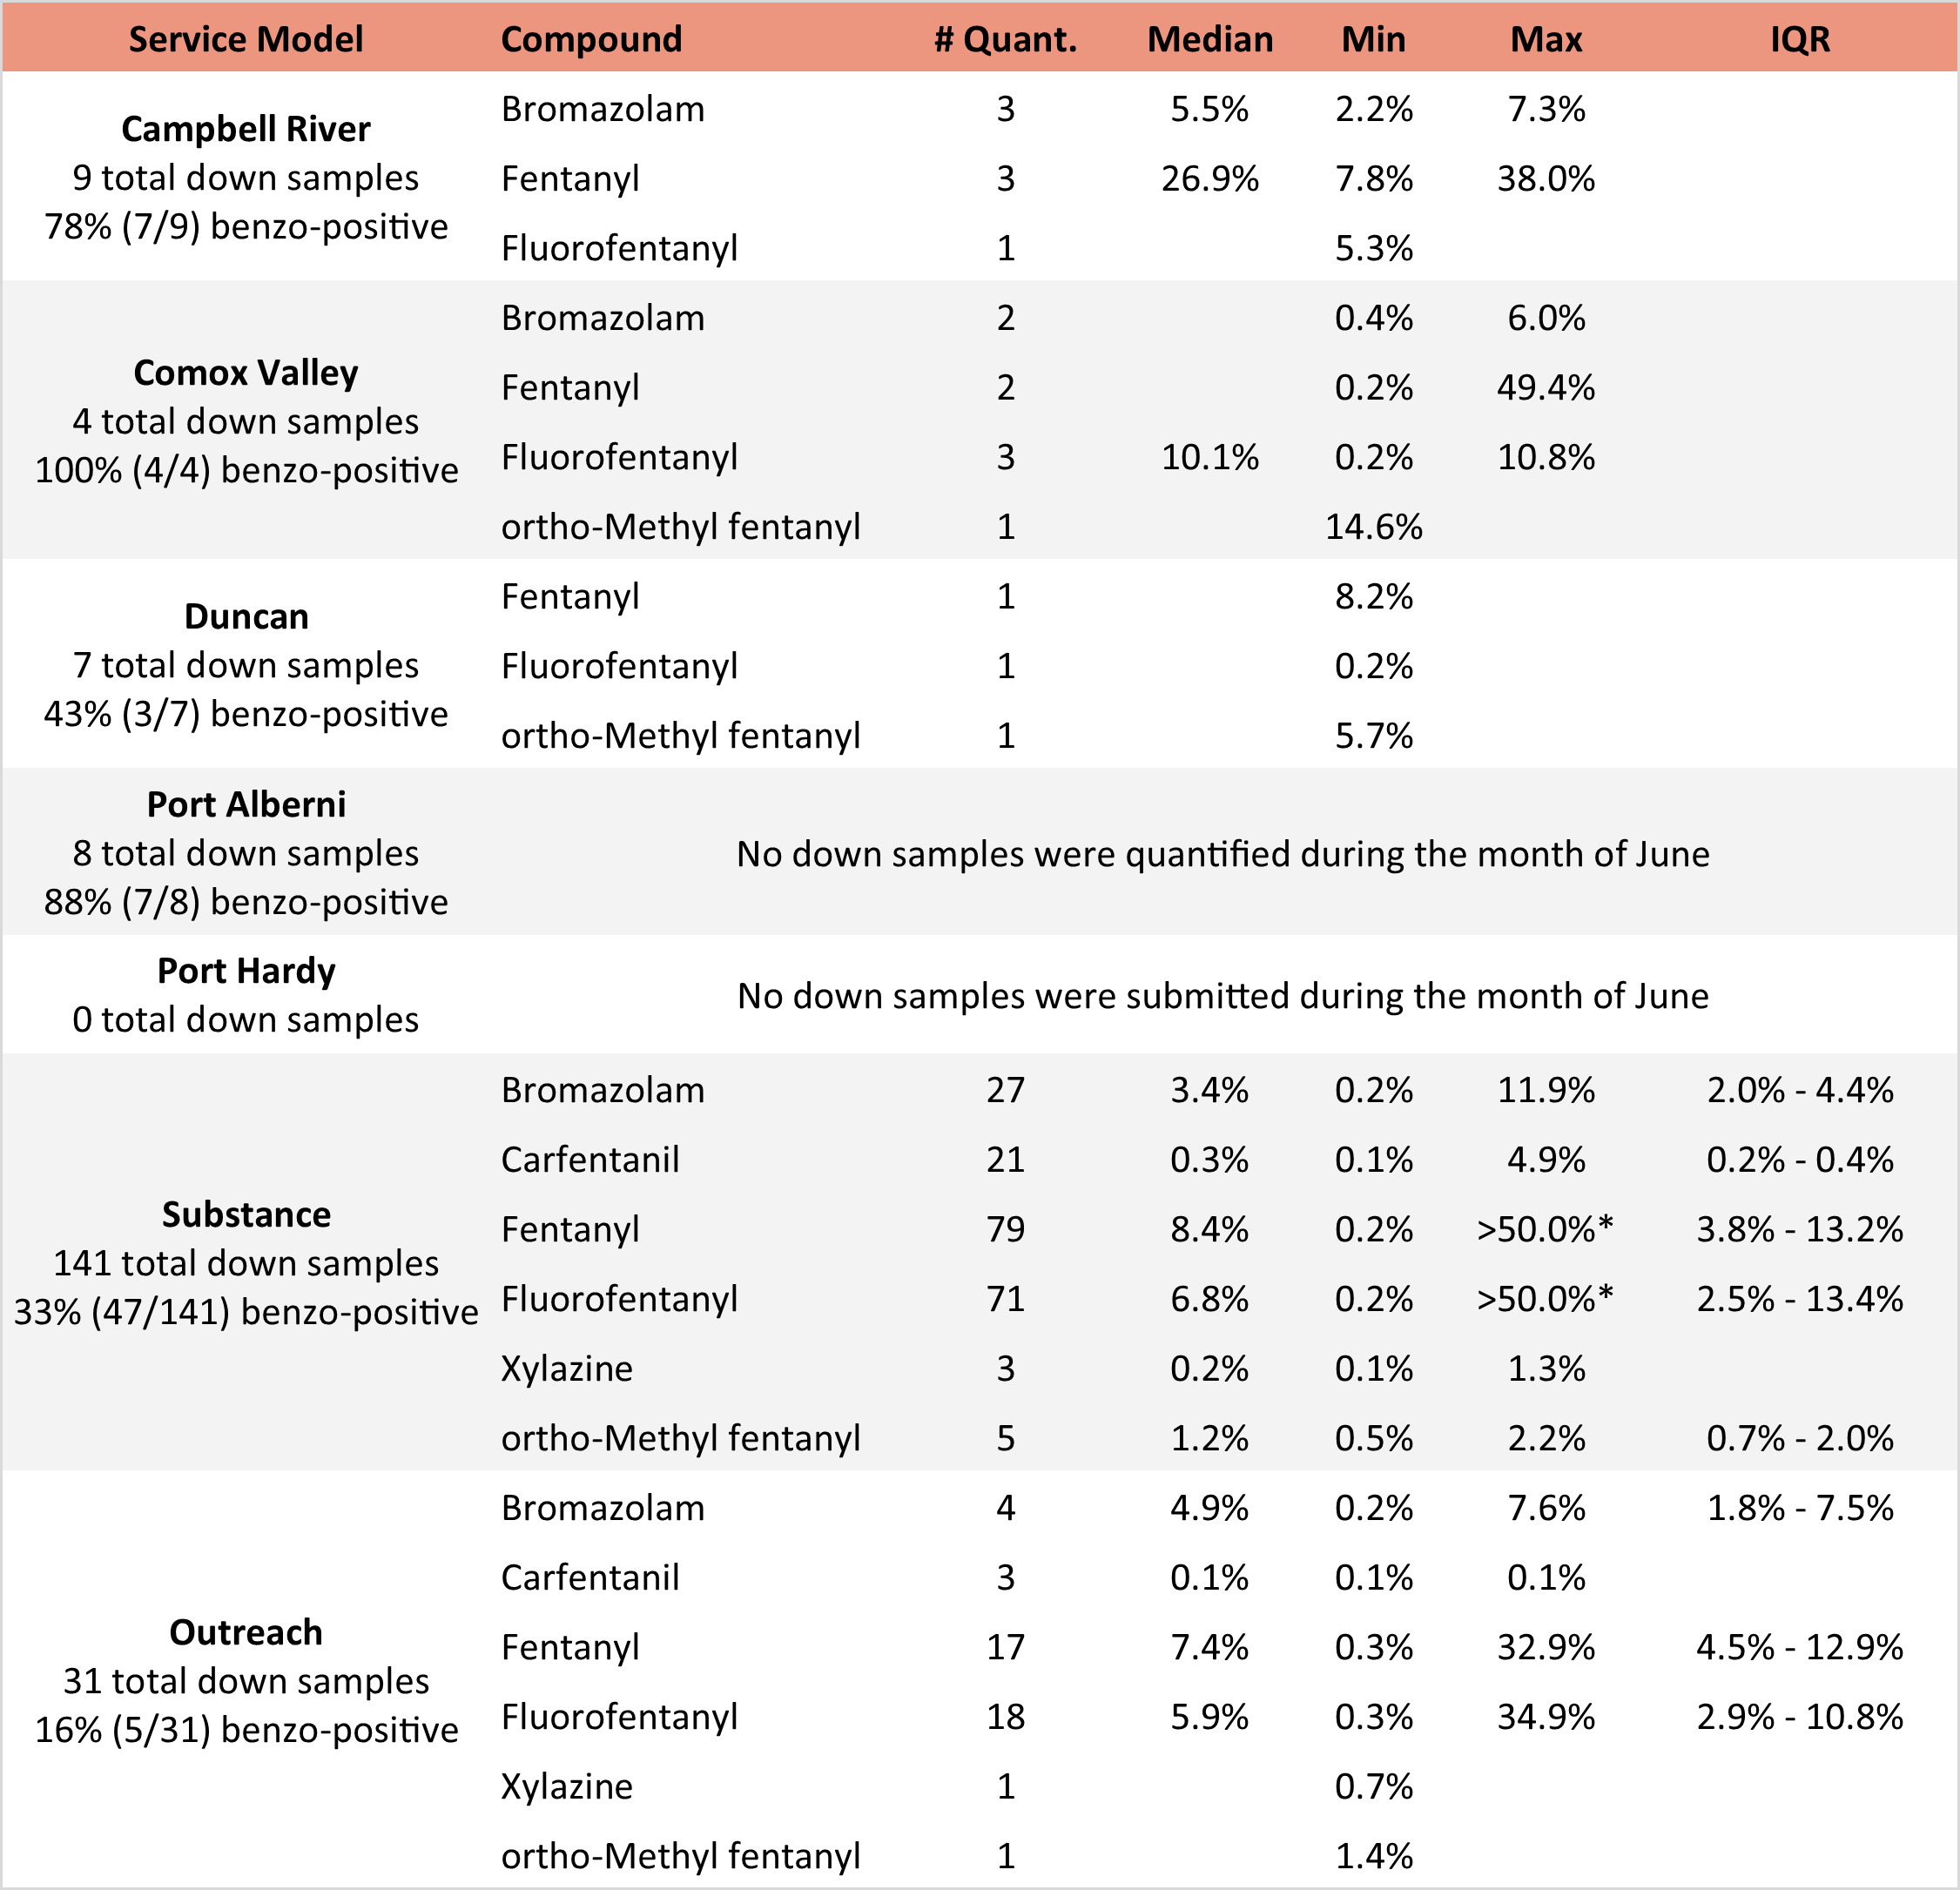
We can also examine the regional variability in the unregulated market. The table below expands on the quantitative data presented above. It focuses only on fentanyl, fluorofentanyl, carfentanil, bromazolam, and xylazine quantified within expected opioid-down samples, separated by collection location/model. Weight percentage is reported; “IQR” is the interquartile range: the range that contains half of the quantified samples.
Check back next month for the July report!
As always, send us feedback at substance@uvic.ca on how we can continue to offer our drug checking results in a useful way.
Want to be notified when we release these reports? Join our mailing list by clicking the button below. You'll receive updates about when our reports are available directly in your inbox. You can subscribe and unsubscribe from this list at any time.