June 2022 Monthly Report


In this blog post we discuss our June 2022 report and provide more information on how to interpret the results. The PDF report can be found at the end.
Key findings:
- The median fentanyl concentration found, across all expected drug categories, was 11.9%, with a maximum of over 80%
- Carfentanil was found in 11 (5%) expected opioid-down samples, with a median concentration of 0.37% and maximum concentration of 1.33%
- Benzodiazepines and/or etizolam were found in 49% of expected opioid-down samples
- The maximum concentration of etizolam found was >25%, in an expected opioid-down sample
- Xylazine, a veterinary sedative, was found in 44 (18%) of expected opioid-down samples with a median concentration of 0.5% and a maximum concentration of 22.0%
Insight for the June 2022 Monthly Report
In May, we announced the transition of Port Alberni Shelter Society’s Overdose Prevention Site (PASS OPS) from an occasional pop-up drug checking site to a permanent fixture within the Vancouver Island Drug Checking Project, as part of our distributed drug checking model. In June, we followed suit and welcomed the Campbell River - Vancouver Island Mental Health Society’s Overdose Prevention Site (VIMHS OPS) onboard as another permanent site within our distributed model. In an effort to scale up drug checking services to meet the needs of diverse communities across Vancouver Island, we also ran a day of pop-up drug checking in Sooke at the Sooke Shelter Society.
We hope that the expansion of drug checking services translates to greater access to harm reduction interventions that not only support individuals in mitigating risks within the unregulated drug market, but also support the community in making sense of regional drug supply trends. We are encouraged by our ongoing collaboration with VIHMS and PASS and are continuing to seek partnerships across the Island to expand and provide critical harm reduction services.
June also sparked off the festival drug checking season with four days of flaming, fantastic, phantasimc, and phanerothymic drug checking at the Otherworld festival piloted by the cool cats at Kindle Arts Society. Harm reduction as an act of radical love harmonises well with the ethos of the event so we were ecstatic to offer our services and were enchanted by the chaotic symphony of the event.
We would like to extend a gracious thank you and warm acknowledgement to Kristi and her team at VIHMS, Kristie and her team in Sooke, and Malcolm and his team at Otherworld for their outstanding and enthusiastic dedication to harm reduction and their determined efforts to implement drug checking services across Vancouver Island.
This blog, and the associated pdf report, breakdown our sample counts into four categories:
-
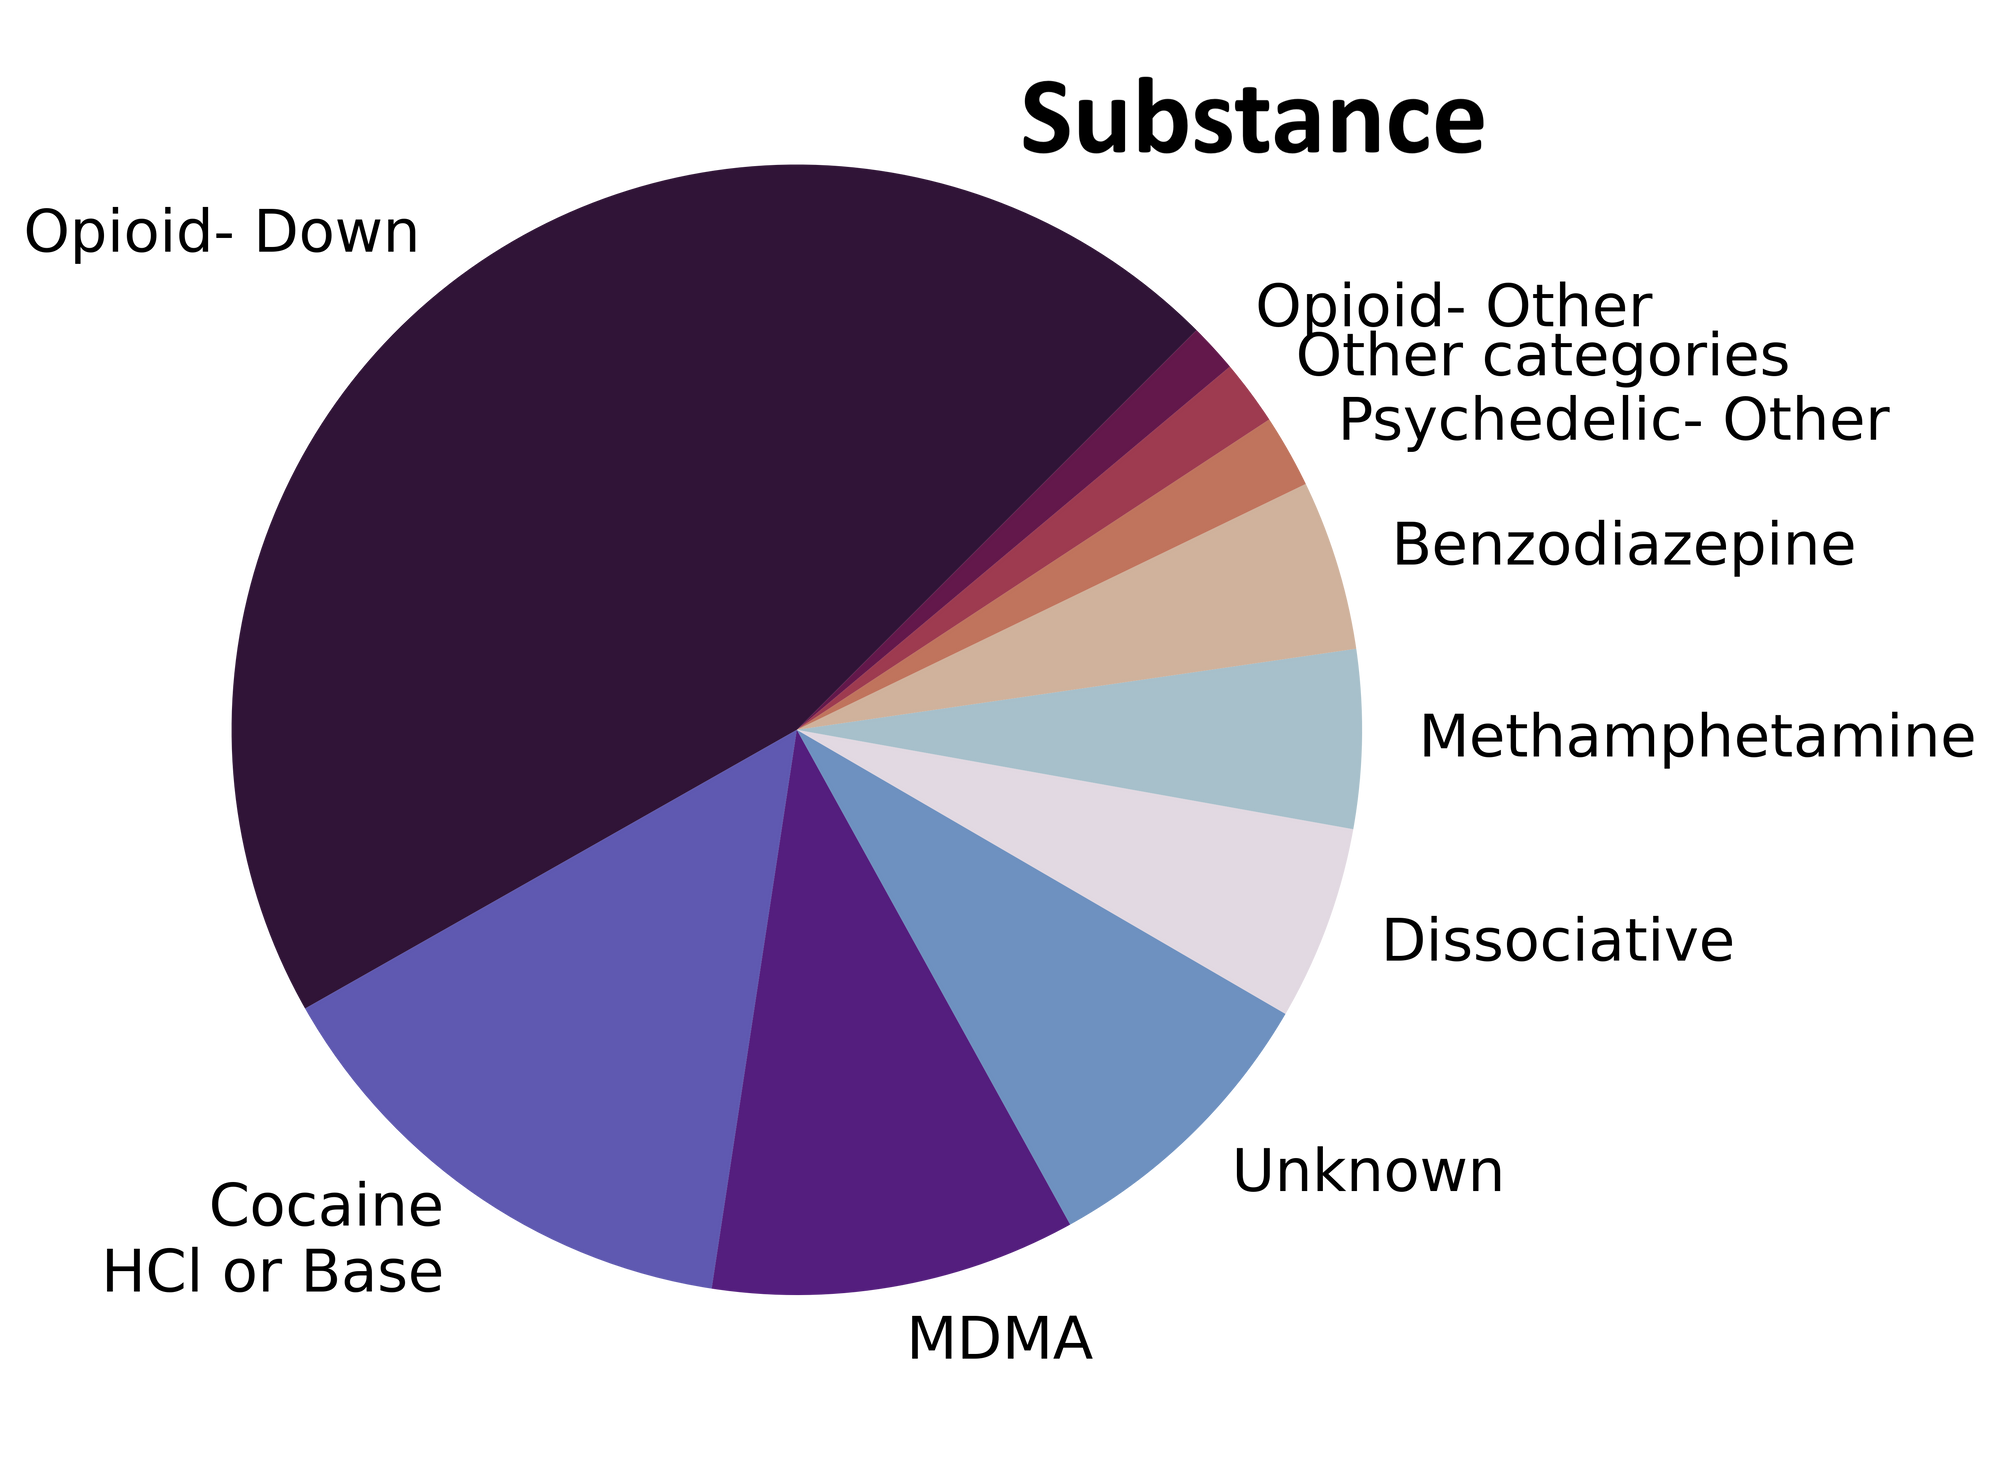
samples received through direct service provision in Victoria, where service users are bringing samples into the Substance storefront. These samples are labelled as “Substance” samples in the figures/tables of this blog post.
-
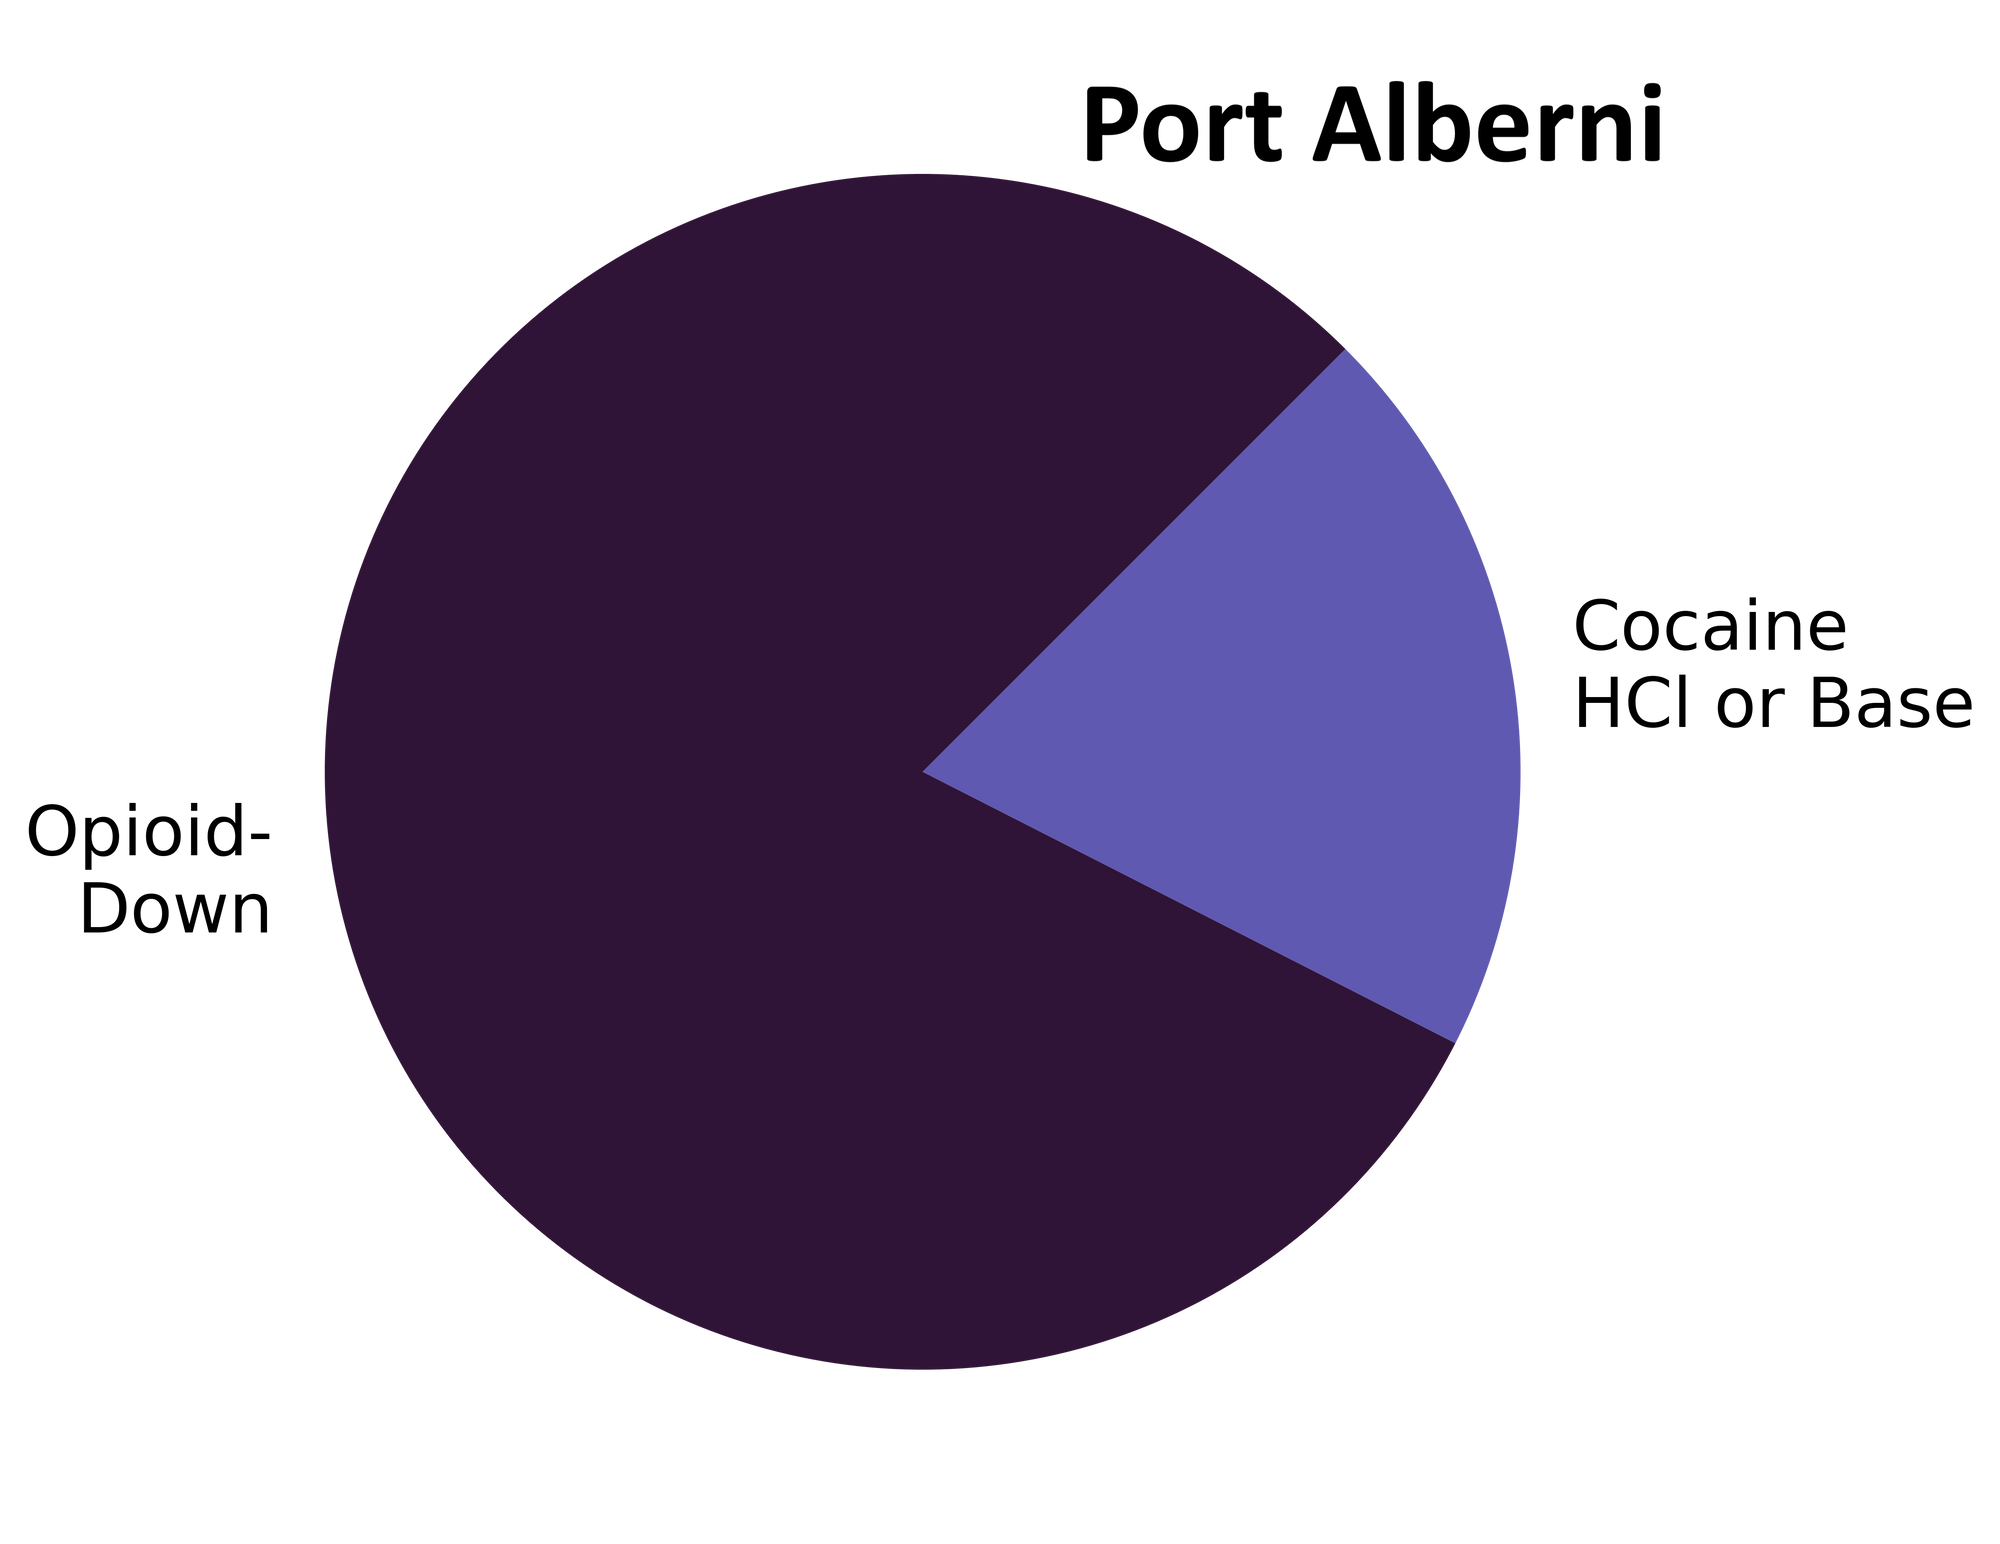
samples received through direct service provision in Port Alberni, where service users are bringing samples into PASS’s OPS. These samples are labelled as “Port Alberni” samples in the figures/tables of this blog post.
-
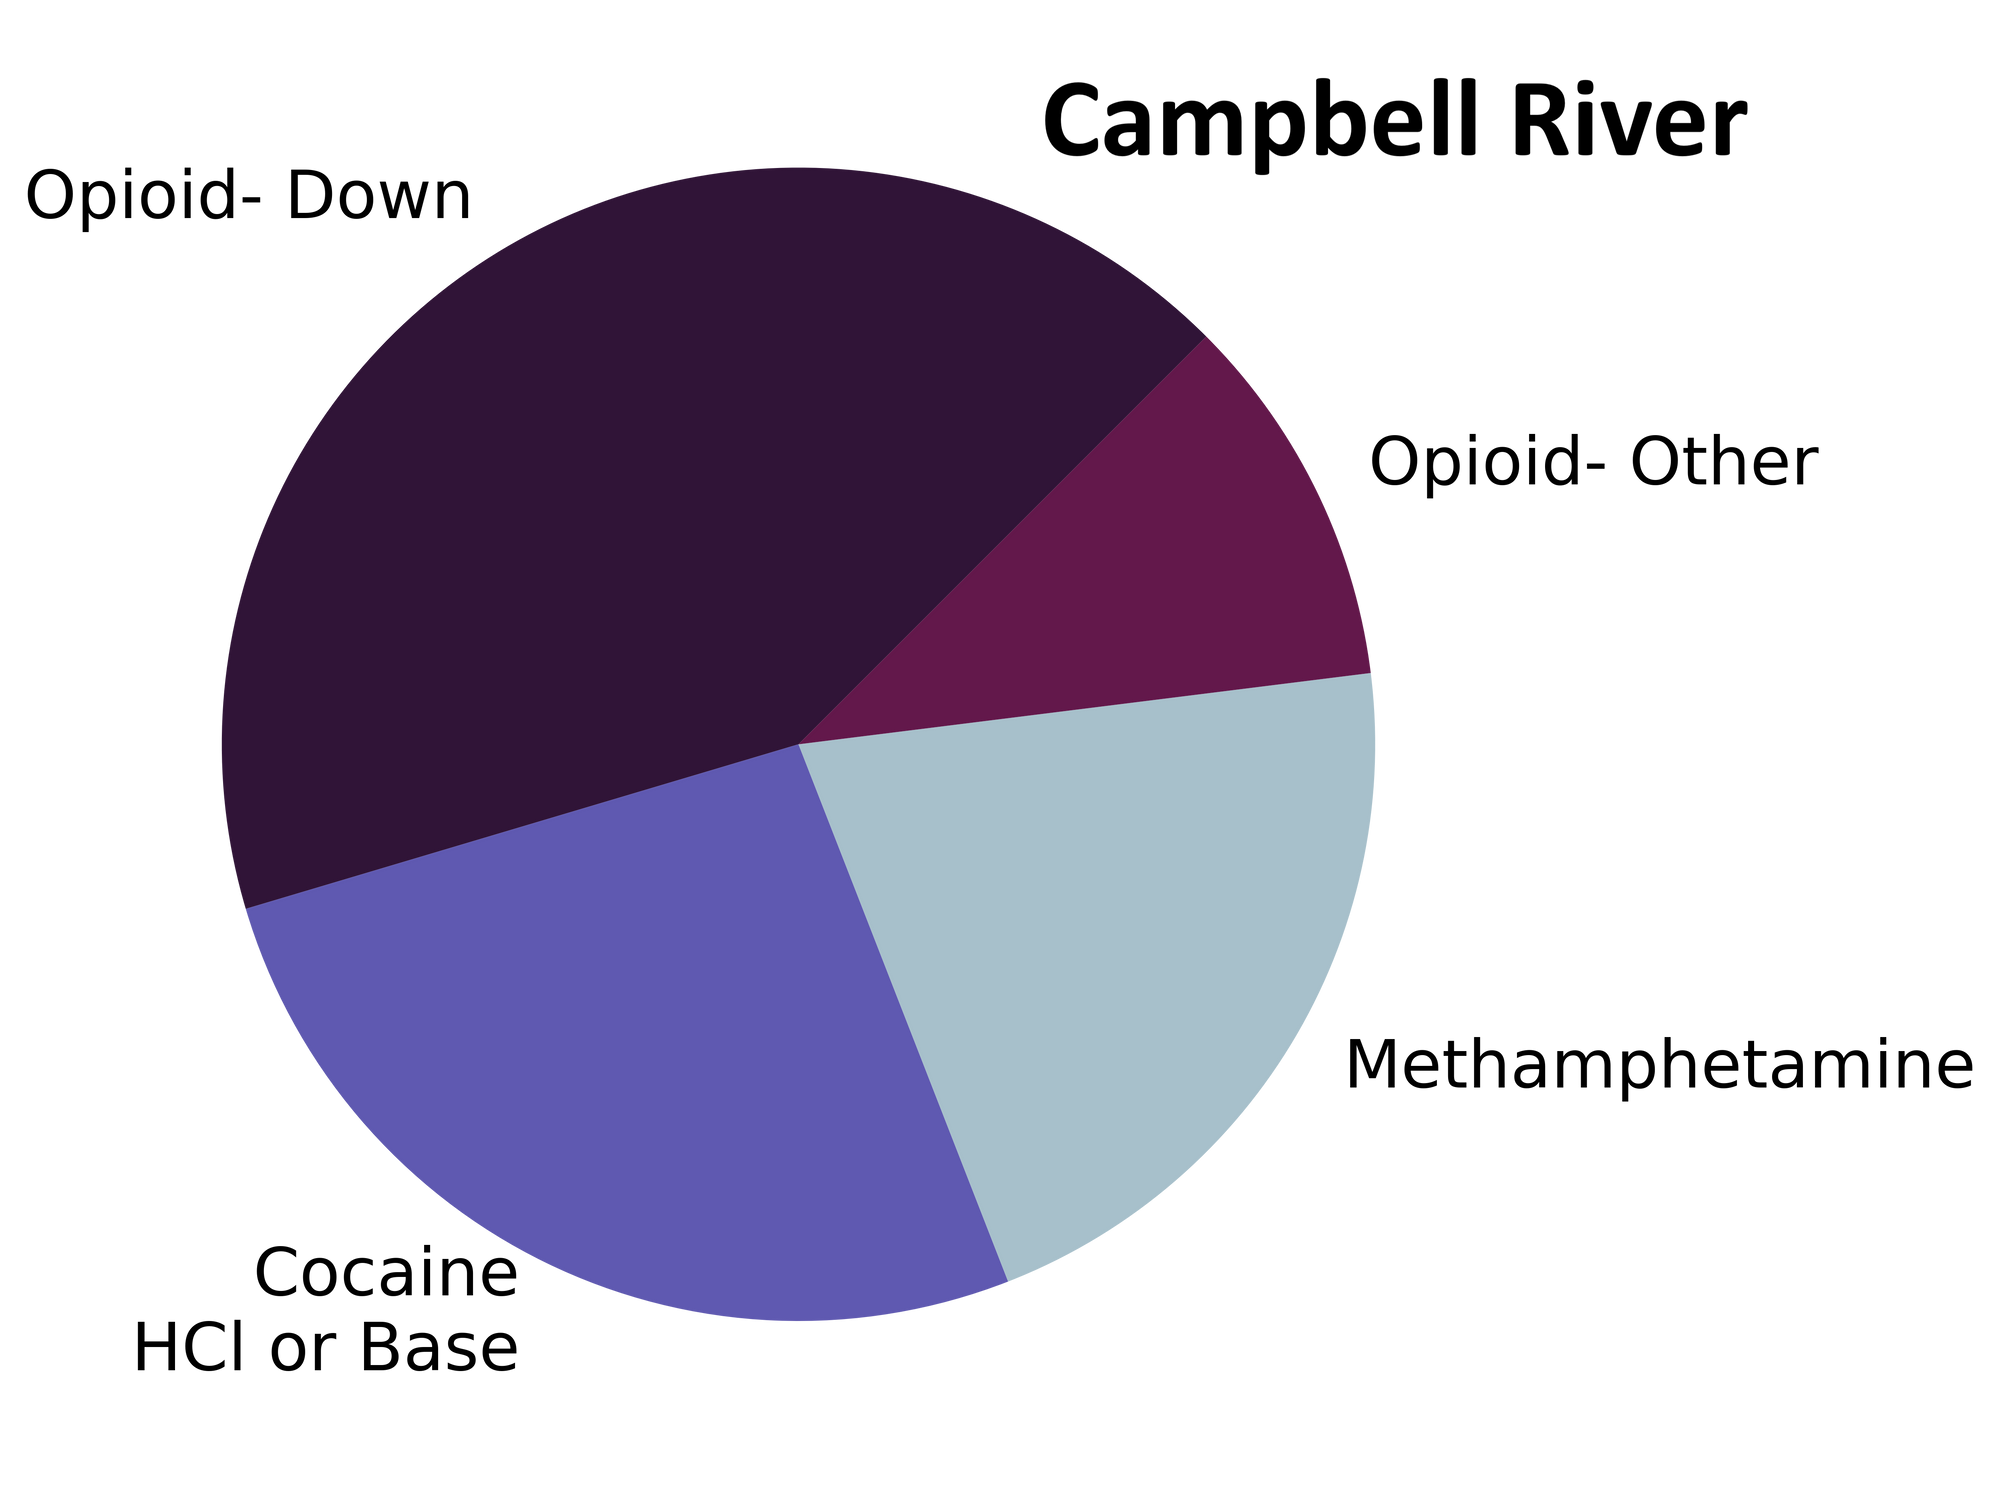
samples received through direct service provision in Campbell River, where service users are bringing samples to the Vancouver Island Mental Health Society (VIHMS). These samples are labelled as “Campbell River” samples in the figures/tables of this blog post.
-
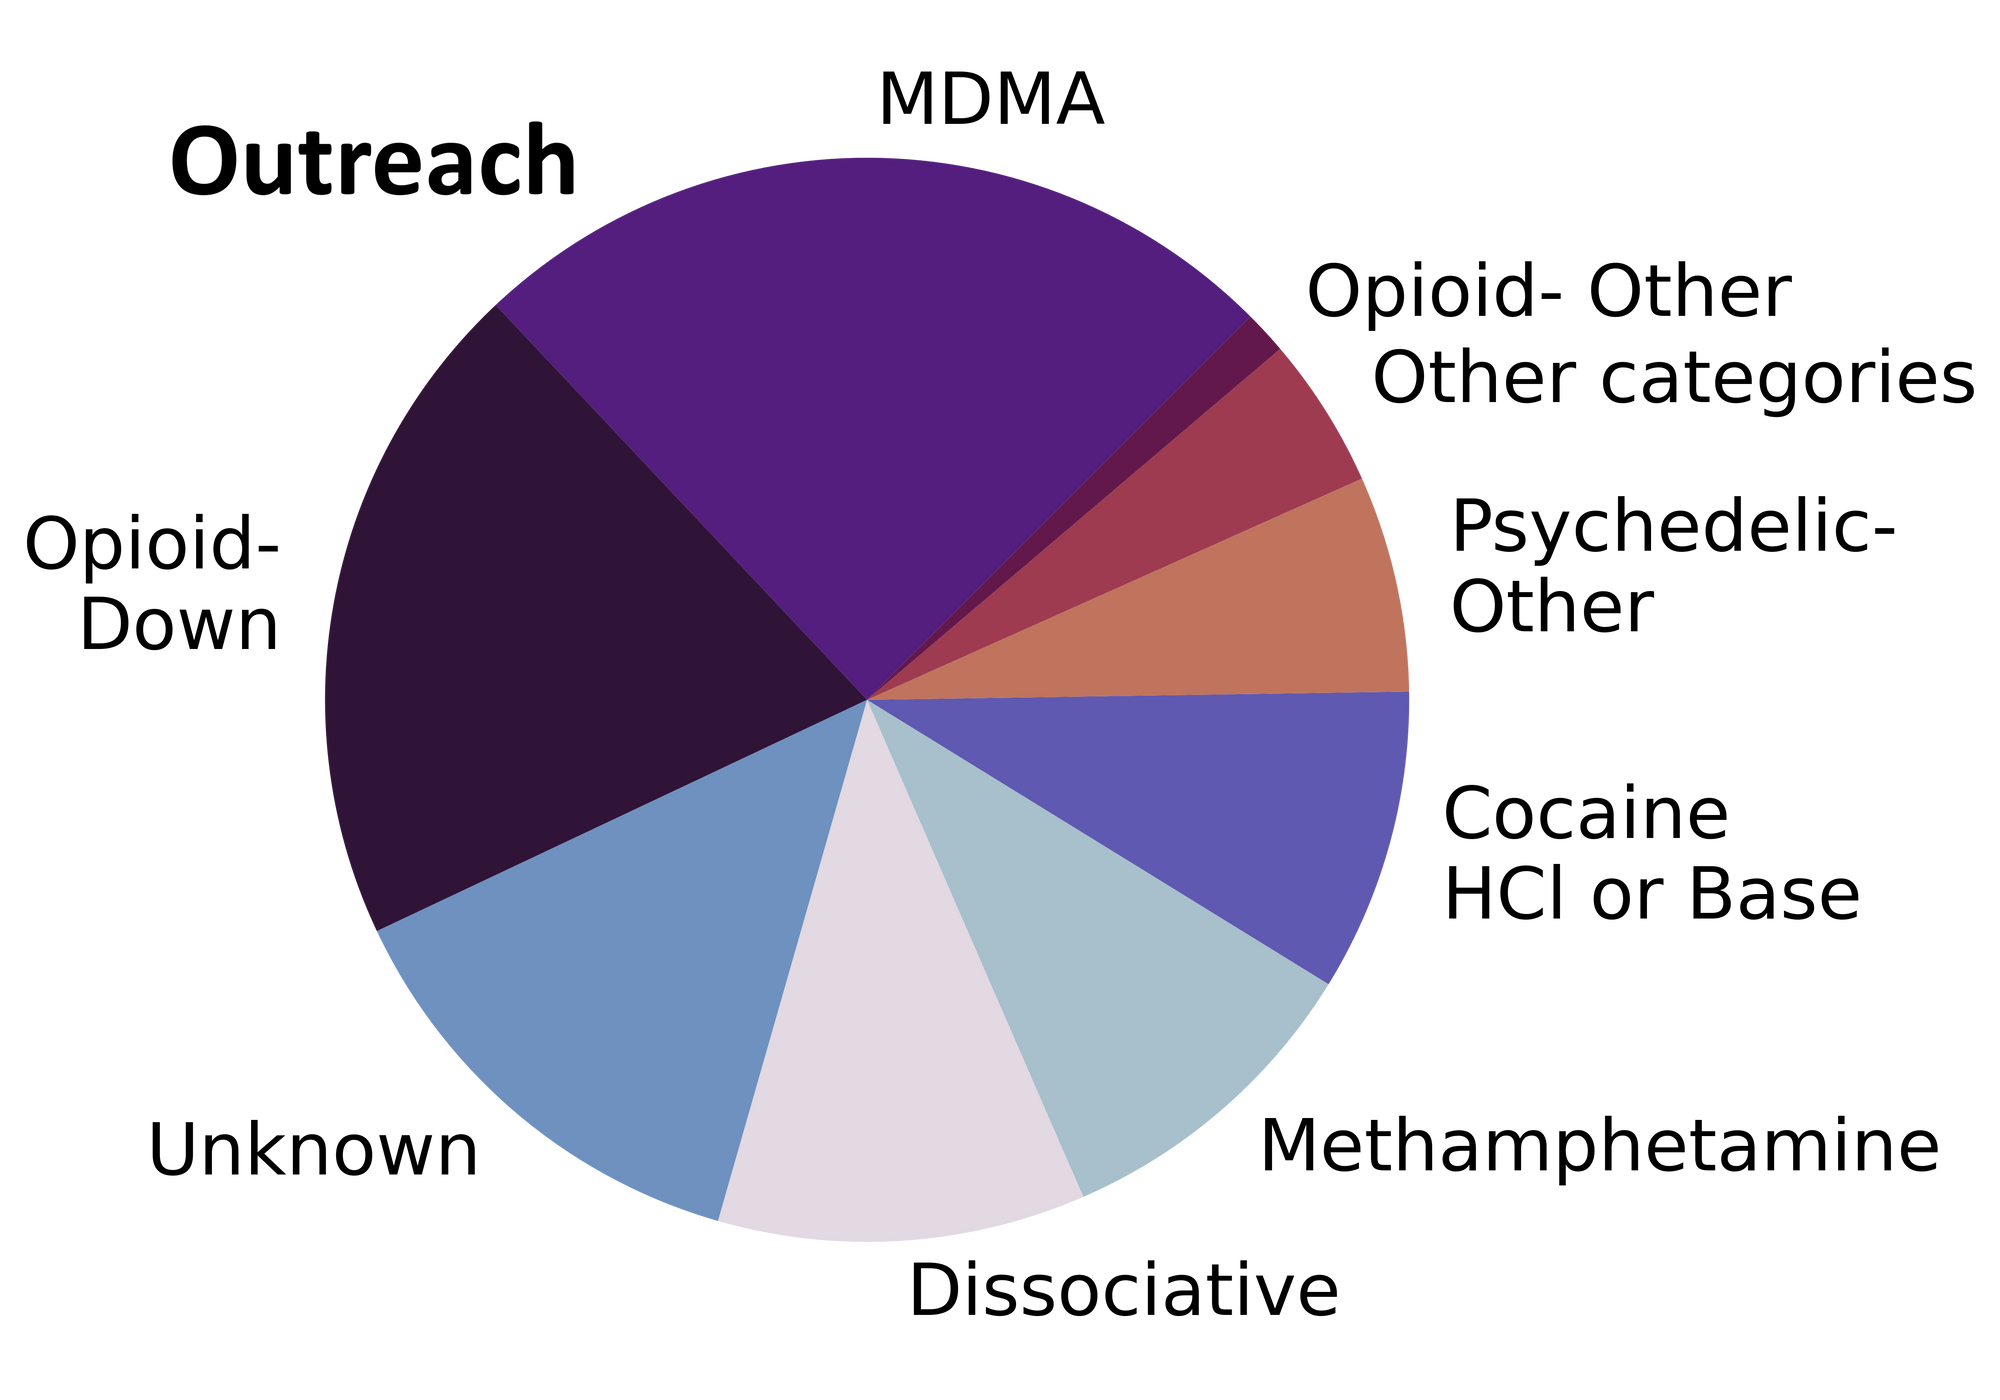
samples received through indirect service provision, where samples are being collected through no contact drop-off envelopes, mail-in envelopes, or are being collected by harm reduction workers and/or other community members at supported housing sites, at overdose prevention sites, and supervised consumption locations. June’s outreach data also includes samples collected during pop-up drug checking at the Sooke Shelter Society and at the Otherworld festival. These samples are labelled as “Outreach” samples in the figures/tables herein.
Drug types
Listen…we try our best to come at you with hot alliterations jam packed with drugs and jargon that jive well with the current month, but June’s “J” is a struggle. “Jib” and “joints” jump to mind, but just those two do not do justice to the jubilant jumble of drugs checked. This June, we smashed our previous record for the number of drugs checked in a month with 610 samples vibrating and dancing across our instruments, over all locations, representing a wide range of drug categories. Fig. 1 shows the prevalence of each expected drug category checked, split by sample collection location/method.

The monthly monocomponent and mixture makeup monologue
For a majority of samples checked, we confirm that the expected drug was indeed the only active and that no additional active compounds were present. The bar charts below highlight a few classes of drugs, differentiating samples when only the expected active was found from situations when other unexpected active components were detected.
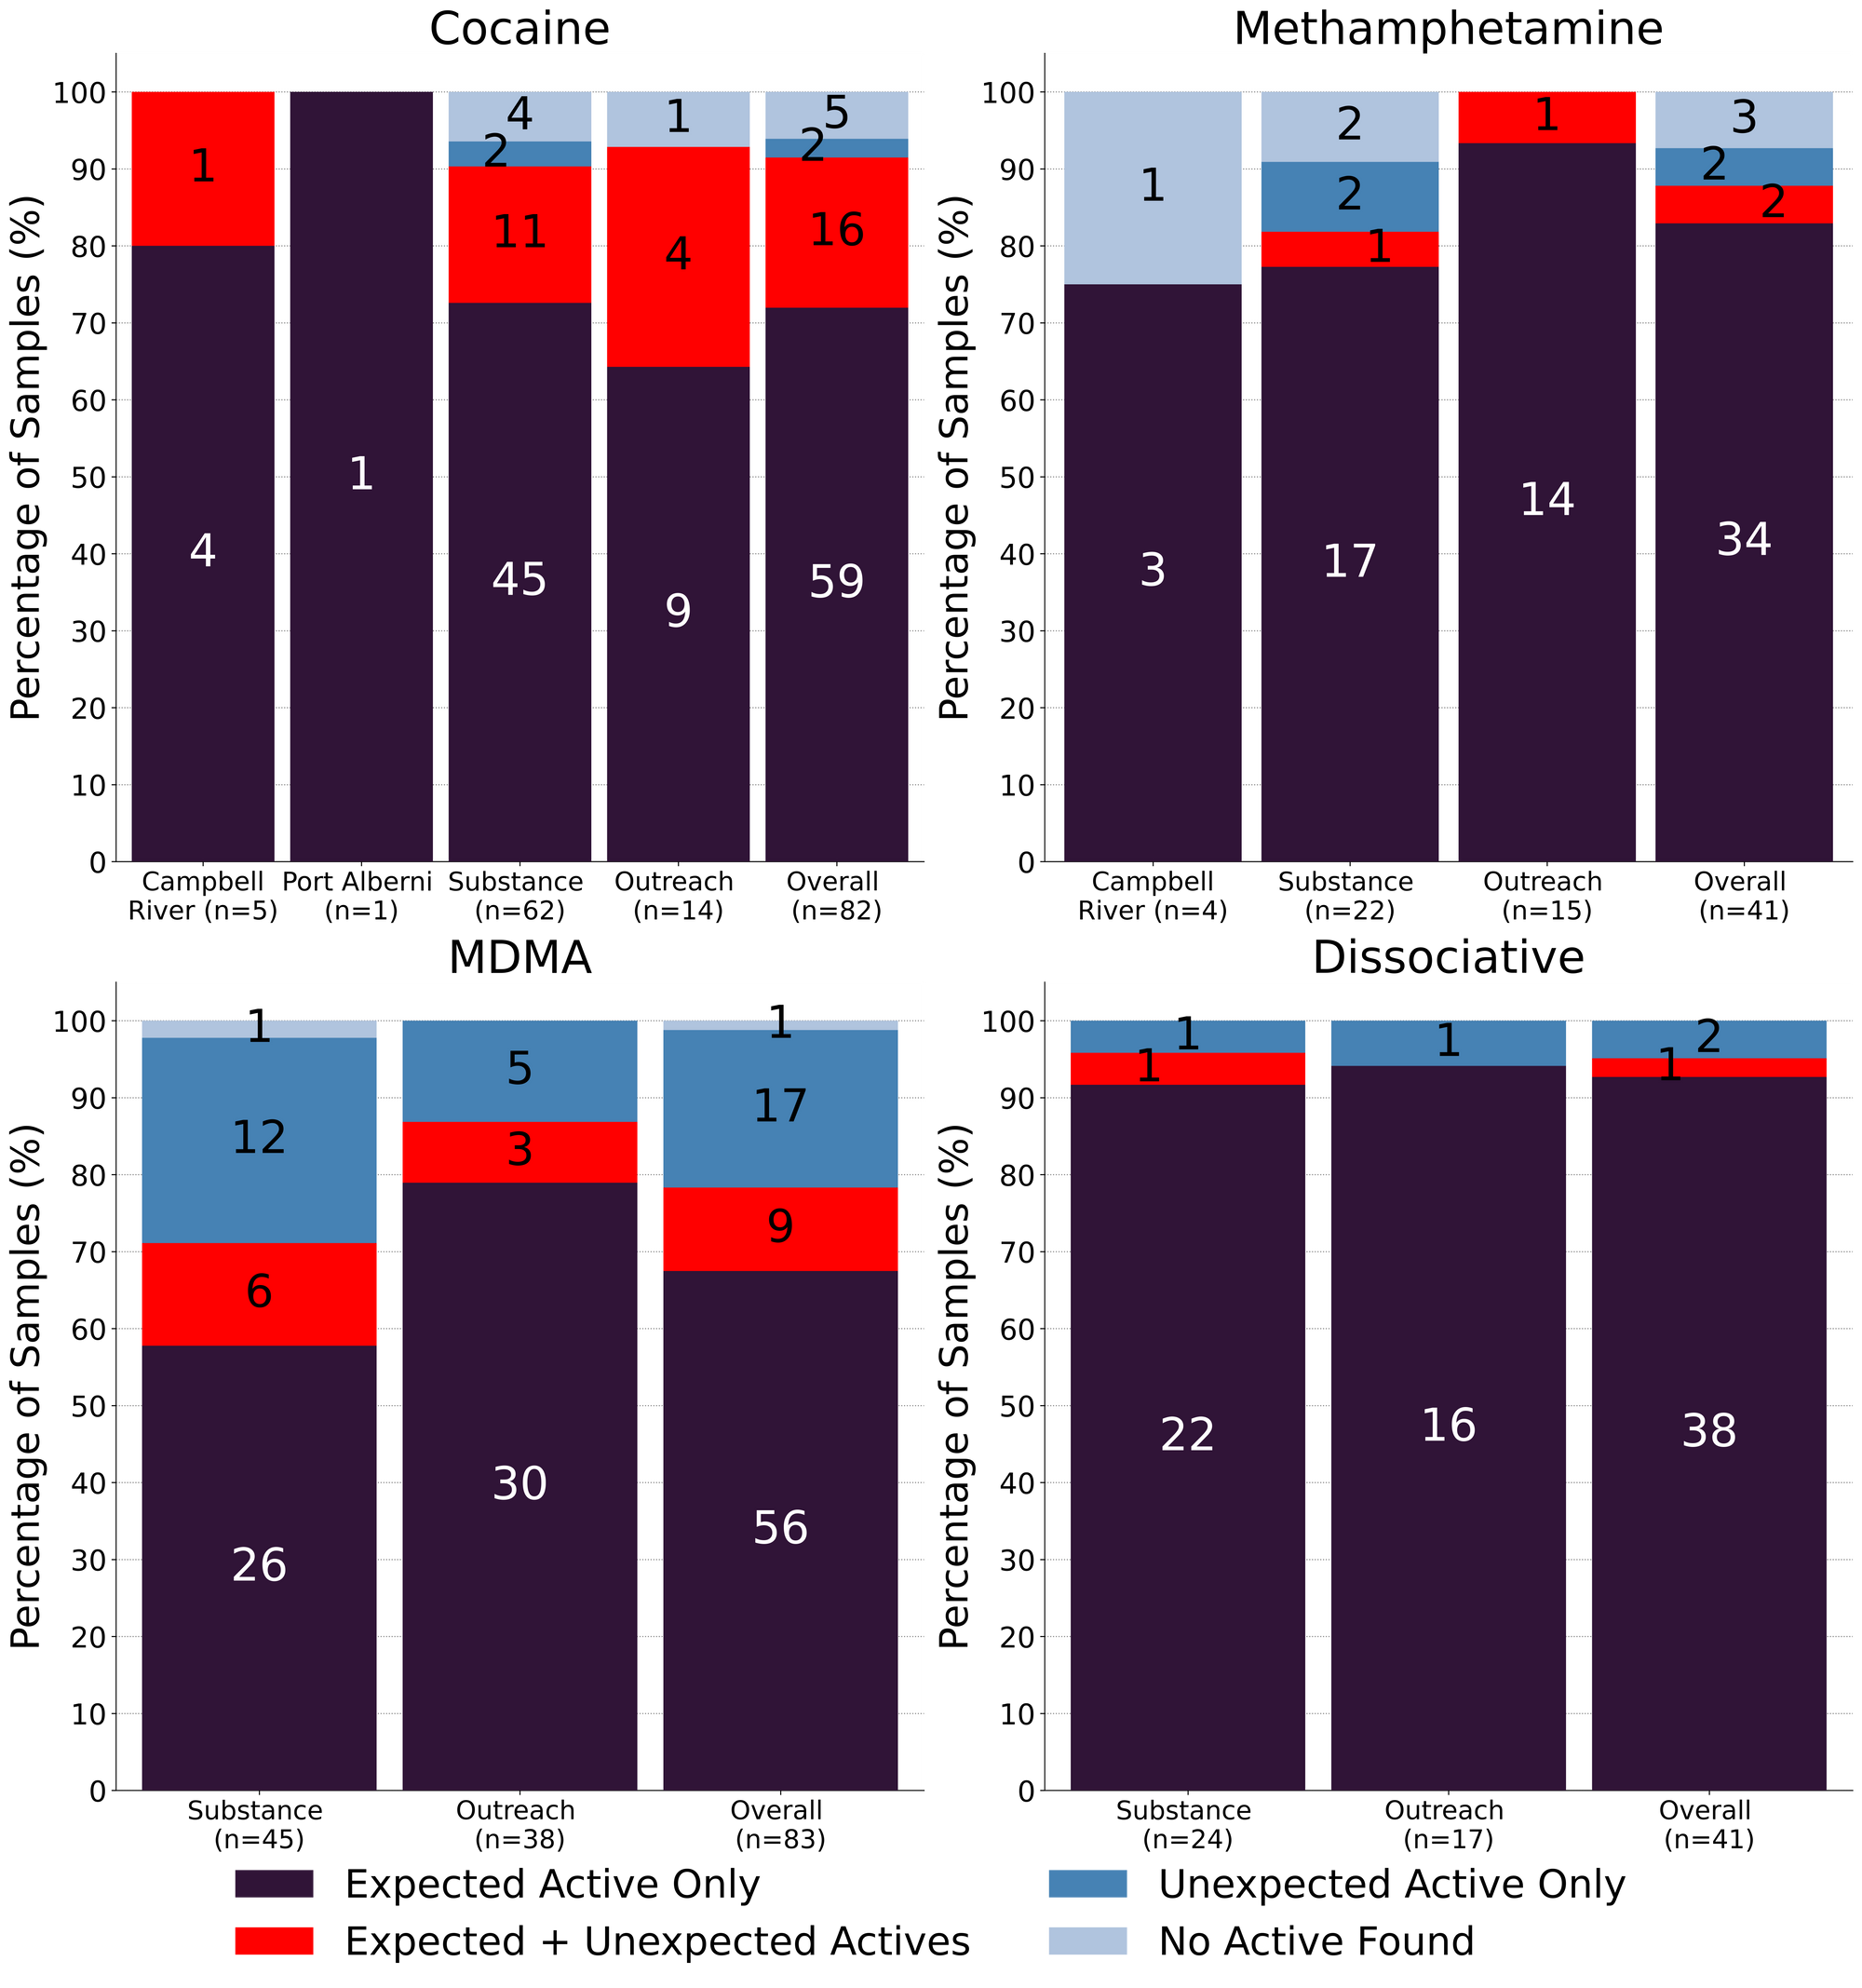
Meth is still mostly meth…83% (34/41) of expected methamphetamine samples checked in June, across all collection locations/methods, were found to be meth with no other active compounds detected. Within these samples, two were cut with caffeine and another was cut with MSM (dimethyl sulfone, an inactive compound and a common cutting agent found in meth). 2 samples were found to contain methamphetamine in addition to another active compound:
- 1 sample contained ~20% meth and ~80% cocaine HCl
- 1 sample contained meth and ~0.2% fentanyl
Of note, none of the expected meth samples checked in Sooke and in Campbell River contained an additional active other than meth. The remaining 5 expected methamphetamine samples did not contain any meth: one was a misrepresented cocaine sample, another was primarily MSM with trace amounts of fentanyl detected (<0.1%), one sample was just MSM, and the final two samples were just sugar (one sample from Campbell River and another in Victoria).
82 expected cocaine samples were checked in June. 72% (59/82) were confirmed to be cocaine with no detectable cuts or adulterants. 16 samples contained an active component in addition to cocaine:
- Levamisole - 10 samples; an antihelminthic drug used to treat parasitic worm infections, commonly seen as a cut in cocaine
- Phenacetin - 1 sample; “super buff” a tylenol-like drug, commonly seen as a cut in cocaine
- Fentanyl - 4 samples:
- 1 sample was residue from a pipe that contained trace fentanyl (<0.1%) and trace etizolam (<0.1%) attributed to reuse of the pipe for different substances.
- 2 samples contained ~1% fentanyl and caffeine which appeared to be cross contamination with shared baggies containing a down sample
- 1 sample contained trace fentanyl (<0.1%) confirmed via strip test and mass spectrometry that could not easily be attributed to direct cross contamination
- Benzocaine - 1 sample; a topical local anaesthetic
- Ketamine - 1 sample. This sample was found to be ~50% cocaine, 25% ketamine, and 25% inositol (a sugar).
2 expected cocaine samples were found to contain no cocaine and instead were found to be methamphetamine. The remaining 5 expected cocaine samples were all baggies with trace amounts of residue too sparse for us to run any of our tests beyond the fentanyl strip test (all negative).
A considerable amount of MDMA/MDA was checked in June, largely at the Otherworld festival and by folks in Victoria gearing up for the festival season. 67% (56/83) of expected MDA/MDMA samples checked were confirmed to be the expected MDA/MDMA, with the MDMA-to-MDA mixup representing a majority of the remaining samples:
- 15 expected MDMA samples were found to just be MDA
- 2 expected MDA samples were found to be MDMA instead
- 7 samples were found to contain both MDMA and MDA
- 1 sample checked at Otherworld contained both MDMA and ethylone, a cathinone entactogen and stimulant
- 1 sample was found to contain MDMA and trace amounts of fentanyl (<0.1%). The presence of fentanyl in this sample was confirmed via strip test and mass spectrometry, however we suspect there may have been cross contamination as a later test on another portion of the same batch was negative for fentanyl on all instruments
- 1 sample was too sparse for us to run any tests other than the fentanyl strip test (which was negative)
With as much MDMA as we tested in June, we saw the full display of MDMA’s colours. From white powders to light blue sand to grungy brown chunks to transparent purple crystals, MDMA’s outfits were as eclectic as those worn by the festival goers bringing in the samples.
K is still mostly K and was a close rival to MDMA for the most popular drug checked at Otherworld. 93% (38/41) expected ketamine samples checked were found to be ketamine with no other active compounds detected, however 3 samples were cut with MSM and another was cut with xylitol. One sample was found to contain both ketamine and MDMA (2%) and two samples did not contain any ketamine and were found to contain other active compounds:
- 1 sample was methamphetamine as a single component
- 1 sample was a clearly mislabelled down sample (baggie mixup) containing caffeine and 11% fentanyl
Benzodiazepines (n=21)
62% (13/21) of the benzodiazepine samples checked in June came to our service in the form of pressed pills that were expected to be alprazolam (Xanax). Only two of the pressed pills were confirmed to contain alprazolam. Within the 11 other pressed pills, one sample was just a sugar pill, while the remaining samples were found to contain a benzo or benzo-related drug other than alprazolam:
- Etizolam - 6 samples. Etizolam is ~2x weaker than alprazolam, though the concentration of each pill may be quite variable
- One sample additionally contained the topical anaesthetic lidocaine
- Flualprazolam - 3 samples. Flualprazolam is ~2x stronger than alprazolam in terms of dosage but has a similar duration of effect (5-8 hours)
- Two of these samples also contained flubromazolam. Flubromazolam is ~5x-10x stronger than alprazolam in terms of dosage and the duration is much longer with effects lasting ~12 hours
- Undifferentiated benzodiazepine - 1 sample. We could not confirm the identity of the benzo present in this sample, though the benzo strip was positive
The other 38% (8/21) of expected benzodiazepine samples came to us in the form of white or crystalline powders, none of which were “simply as expected”:
- 4 unknown expected benzo powder samples were misrepresented opioid-down samples containing flubromazepam, fentanyl, xylazine, and caffeine, with a range of concentrations between samples
- 2 unknown expected benzo powder samples contained no benzodiazepine and were found to be benzocaine instead. Despite their admittedly confusing names, benzocaine is not a benzodiazepine. Benzocaine, a topical anaesthetic, is strictly approved for topical use and may be harmful if ingested.
- An expected bromazolam powder was found to contain bromazolam and trace amounts of fentanyl (<0.1%)
- An unknown expected benzo powder was found to contain flubromazepam and 0.2% fentanyl
Opioid-Down (n=240)
In this section we present results specific to the opioid-down supply, therefore they may differ from the highlighted findings above that are inclusive of all expected drug categories.
- 97% of expected opioid-down samples contained fentanyl (232/240)
- No heroin was detected in any expected opioid-down samples
- Eleven samples contained carfentanil, with a median concentration of 0.37% and a range of 0.10% to 1.33%
- 49% of expected opioid-down samples contained a benzo and/or etizolam (117/240)
- Xylazine was detected in 18% (44/240) of opioid-down samples, with a median concentration of 0.5% and a wide range of 0.1% to 22.0%
This June, 70% of all opioid-down samples checked contained an additional active to the expected fentanyl. Examining Fig 3. we can see that the down supply has remained consistently inconsistent:
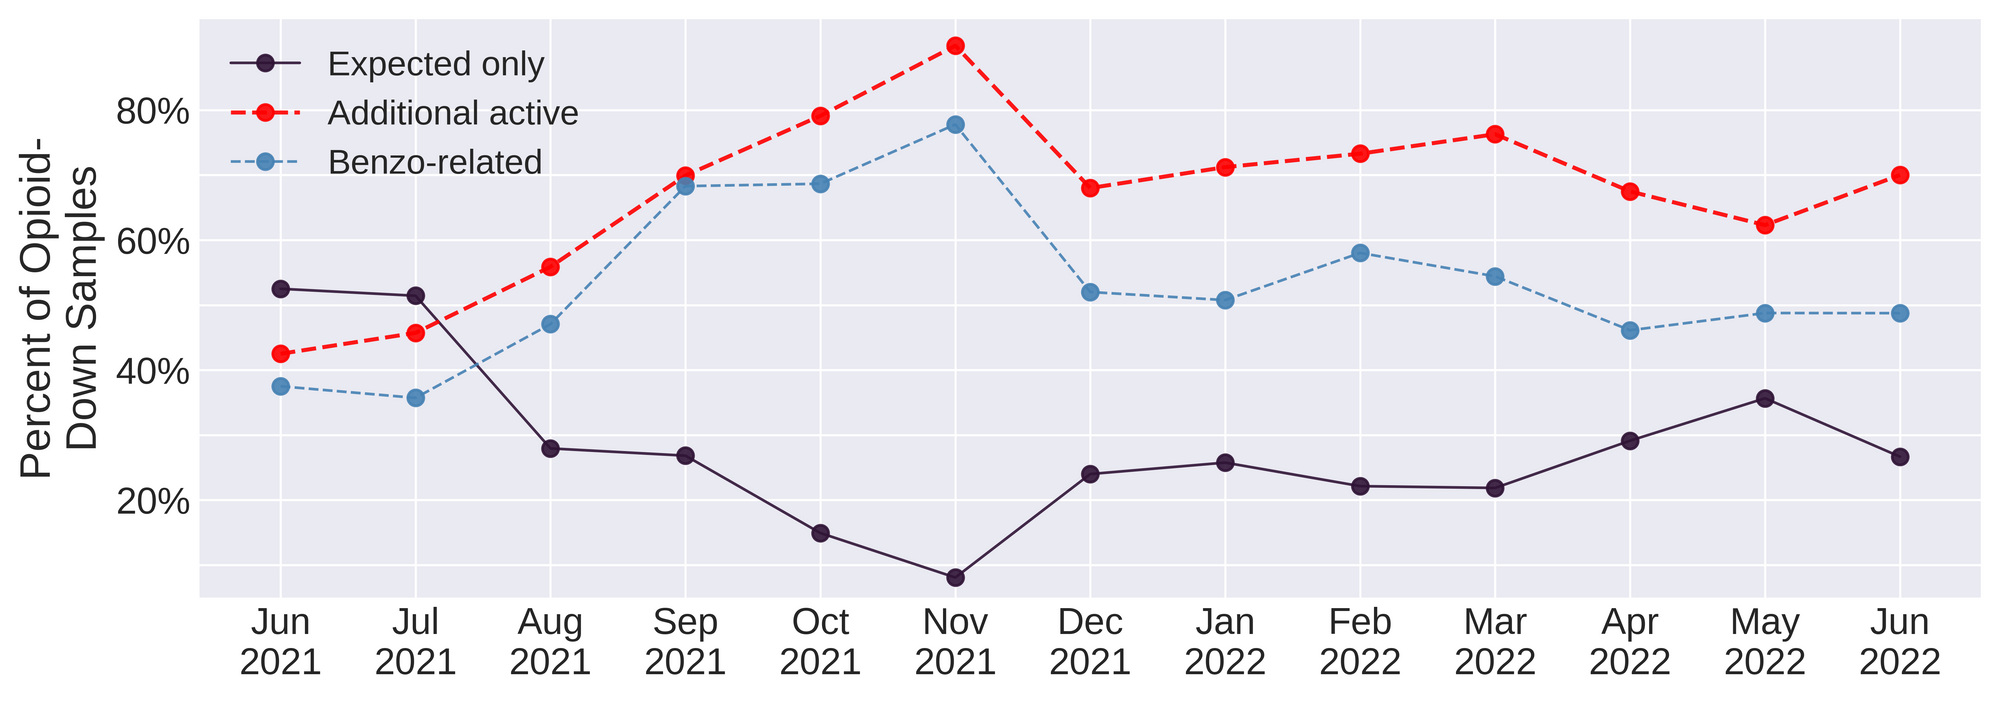
Benzo-related drugs remain the primary contributor to the additional actives found in expected opioid-down samples with 49% (117/240) of expected opioid-down samples checked containing a benzo-related drug. Unexpected fentanyl analogues like fluorofentanyl (63 samples), and the sedative xylazine (44 samples) represent a majority of the remaining adulterants, though scattered detections of other drugs are still found and can be reviewed in the pdf report at the end of this blog.
The uptick in down samples that contained xylazine is notable, when compared to previous months. Xylazine is a veterinary tranquilliser/sedative, anaesthetic, and muscle relaxant that has not been approved for human use. Reported to be used to prolong the sedating effects of down, xylazine is being seen more frequently as an adulterant in the down supply across so-called North America. Xylazine can cause respiratory depression and a decreased heart rate, which when used in tandem with opioids and/or benzodiazepines, can complicate the effects of, and response to, an opioid overdose. Xylazine does not respond to naloxone. More details on xylazine can be found in this report by the Canadian Centre on Substance Use and Addiction.
In all of 2021, we detected xylazine in 19 of 808 (2%) expected opioid-down samples; since then, the percentage of down samples containing xylazine has been increasing with xylazine being found in 6% (15/215) of down samples in March, 9% (22/244) in May, and 18% (44/240) in June. The concentration range of xylazine has remained equally volatile, with expected opioid-down samples containing xylazine at concentrations ranging from 0.1% to 22%[1]
Xylazine was first detected in the unregulated drug supply in so-called Canada in 2012. That is ten years of people rolling the dice for whether their purchase contains xylazine, regardless of whether or not somebody is intentionally seeking it, trying to avoid it, or is unaware of its existence. Individual and public health should not be left to games of chance. Rather than forcing people to navigate a potentially toxic and unpredictable market, policy makers could work smart, not hard, and actually listen to the people who use drugs who have been pointing to remedies to the unregulated market for decades: safer supply and decriminalisation of all drugs.
June also brought the highest concentration xylazine sample that we have seen to date, 34.9%, that was found in an “unknown” sample. ↩︎
Quantification for Expected Opioid-Down[1]
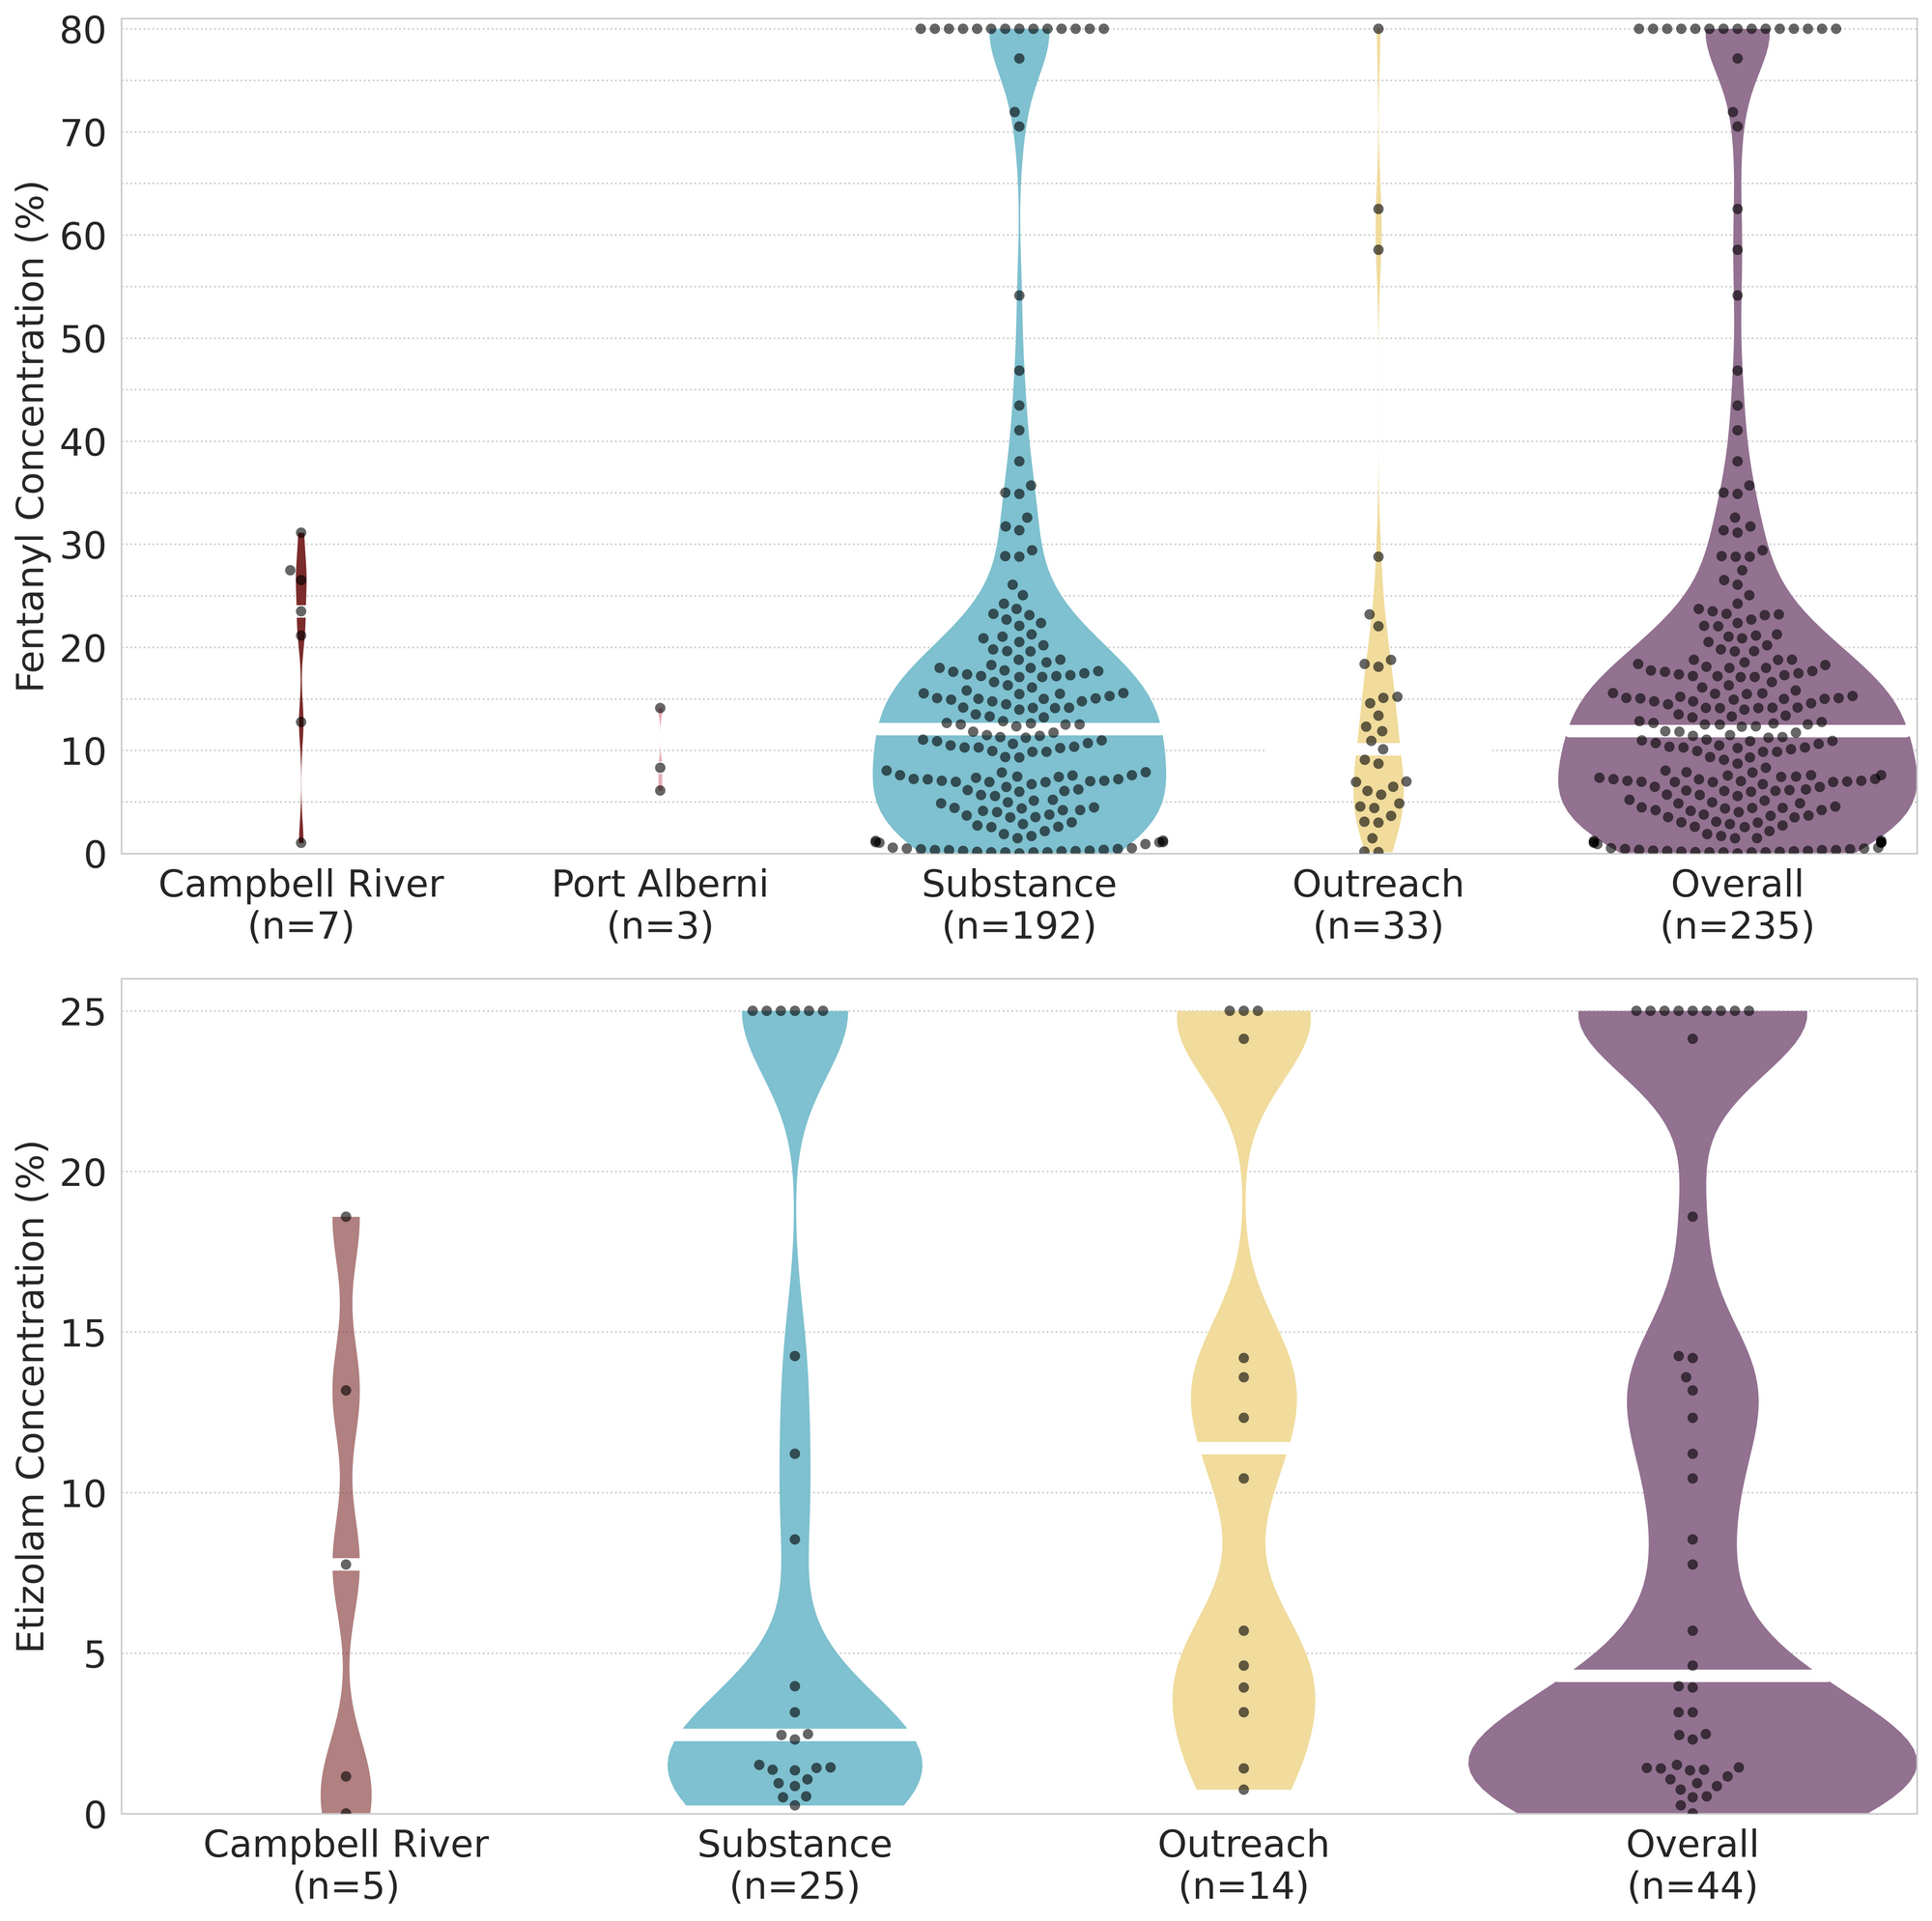
In June, we quantified fentanyl for 211 of the expected opioid-down samples containing fentanyl and found the median concentration to be 13.0%[2] with the average strength of fentanyl we normally see being around 15%. Though the median is a useful indicator, it doesn’t capture the volatility of fentanyl concentrations present in the opioid supply, as any one sample might be the lowest strength (0.1%) or the strongest (>80%[3]). Similarly, the concentration of etizolam was across the board in expected opioid down samples, ranging from 0.1% to >25%[3:1], with a median of 6.7%.
Not all opioid down samples brought to our service can be quantified. This is primarily due to too limited sample collected for our instruments to report a reliable mass percentage. Nevertheless, qualitative detection is still possible. ↩︎
This number is specific to fentanyl quantified in opioid-down samples. The median concentration listed in the Key Findings at the beginning of this blog (11.9%) is inclusive of all samples checked, across all drug classes, that contained fentanyl. ↩︎
For samples that contain more than 80% fenanyl, or more than 25% etizolam by weight, our mass spectrometer is presently unable to reproducibly assign a concentration due to the upper limits of the calibration methods currently adopted. ↩︎ ↩︎

The fentanyl and etizolam concentrations that we quantified in down samples checked in June are presented in Fig. 4. Black dots are individual opioid-down samples, Horizontal white bars show the median concentrations of fentanyl and etizolam quantified, the width of the shaded regions mirrors the number of samples at a given concentration.
Want to be notified when we release these reports? Join our mailing list to receive updates about when our reports are out. You can subscribe and unsubscribe yourself from this list at any time.
Check back next month for the July report!
As always, send us feedback at substance@uvic.ca for how we can continue to offer our drug checking results in a useful way.