June 2021 Monthly Report

In this blog post we discuss our June 2021 report and provide more information on how to interpret the results. The PDF report can be found at the end.
Key findings:
- Carfentanil found in two samples expected to be opioid-down or unknown.
- Overall median fentanyl concentration of 7.7%, with a maximum concentration of 65.8% found in an expected opioid-down sample.
- Overall median etizolam concentration of 2.3%, with a maximum concentration of 14.5% found in an expected opioid-down sample.
- Benzodiazepines and/or etizolam found in 38% of expected opioid-down samples, which is 7% lower than the previous month.
- N-ethylpentylone found in an expected MDMA sample.
Insight for the June 2021 Monthly Report
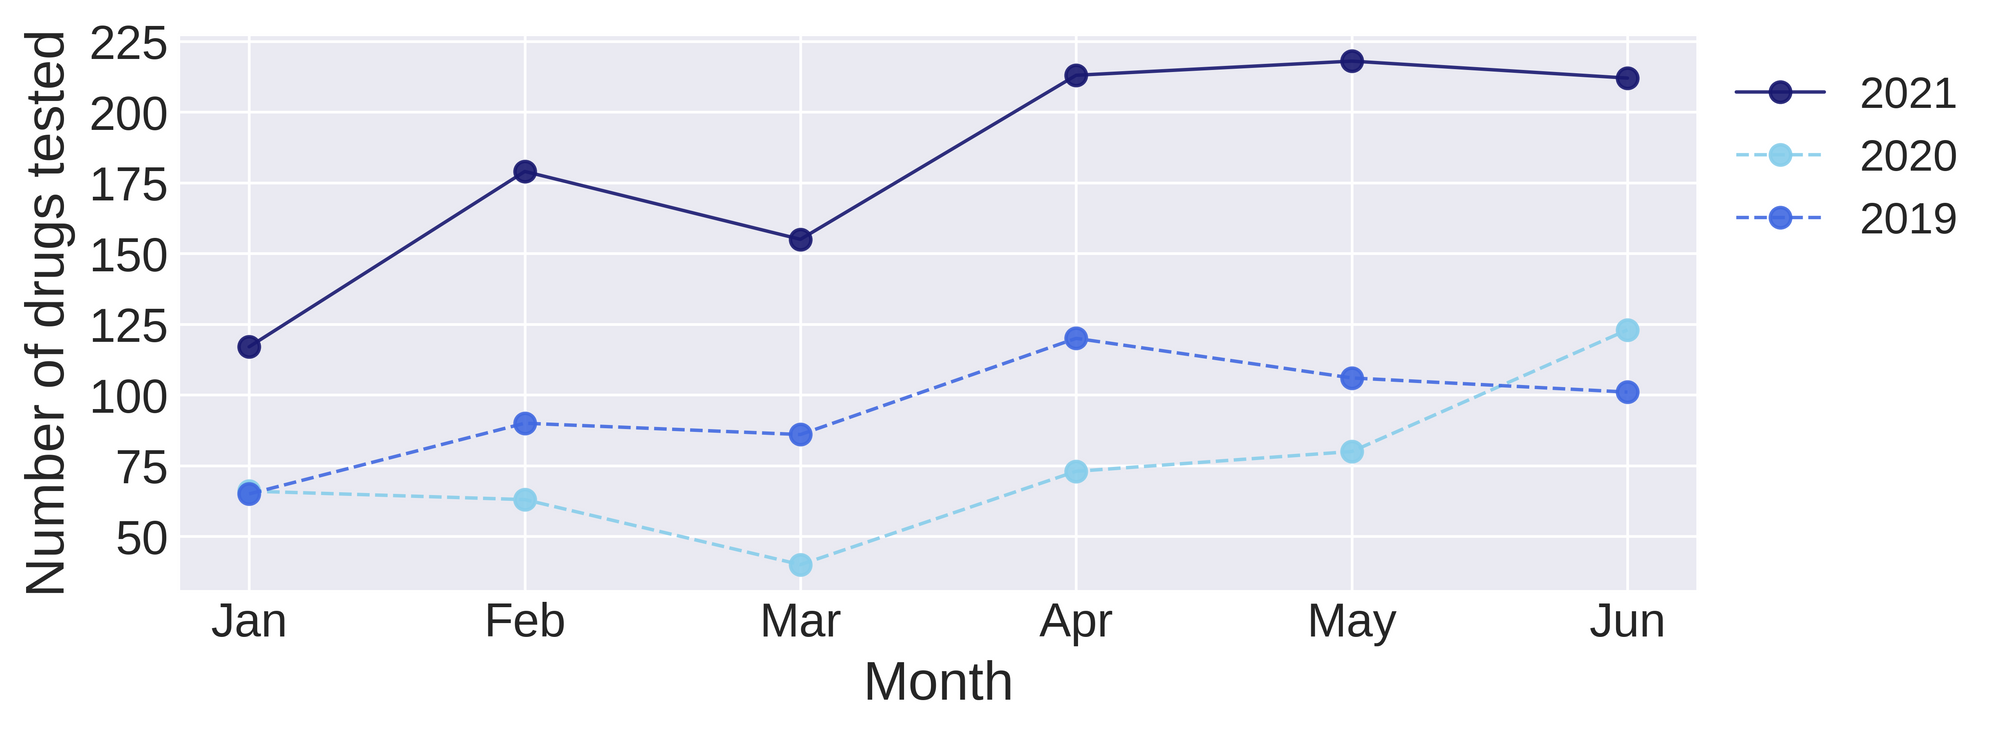
This month we remained busy checking 212 samples. This is a 72% increase from June 2020.
Drugs and cuts
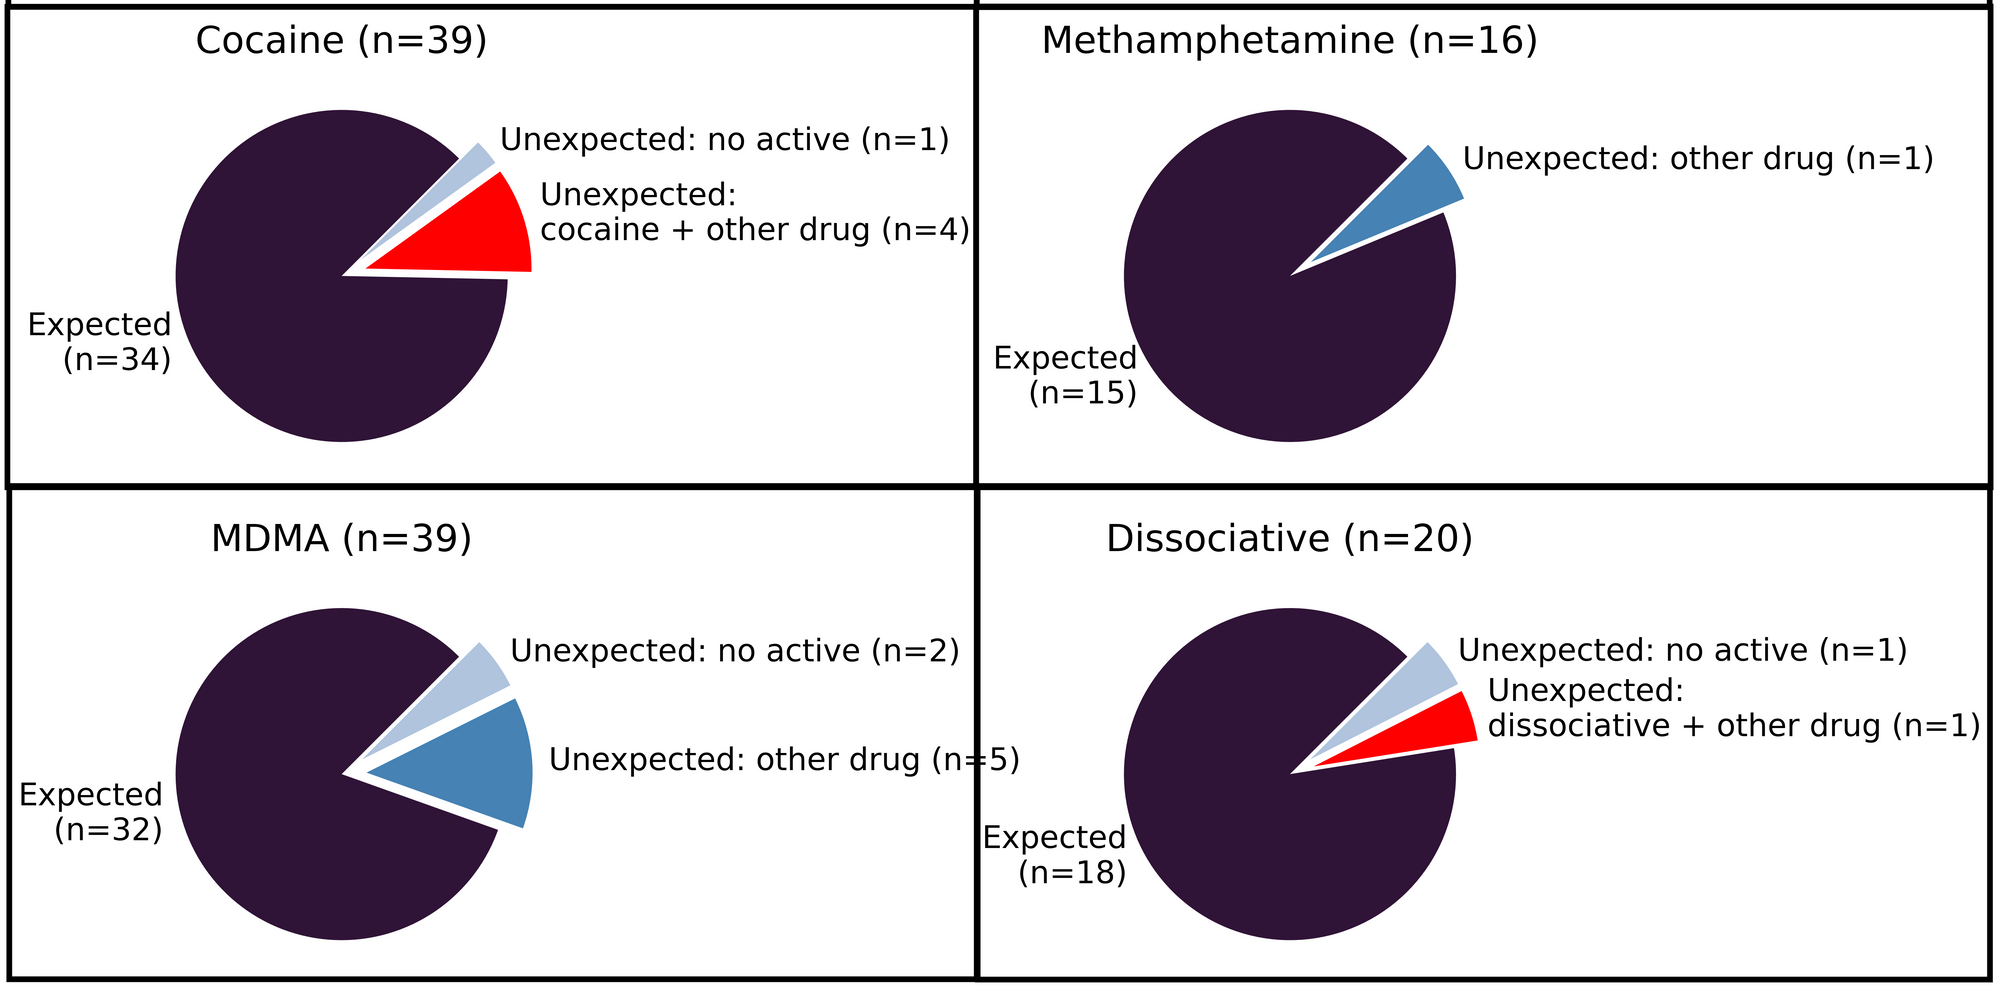
Not all the drugs we test are cut or full of unexpected actives. In many cases we actually confirm that the expected drug was indeed the only expected drug and that no additional cutting agents were present. The pie charts below differentiate when only the expected active was found from other situations that cause a sample to be unexpected.
What about cuts?
For the cocaine that was found to be as expected (no other actives found), only four out of the 34 samples contained an inert cut, either talc of sugar. This means 77% were found where cocaine was a single ingredient.
For the meth that was found to be as expected, only one sample was cut with caffeine, meaning 88% were found to be methamphetamine as a single ingredient. Meth is Meth.
For the MDMA found as expected, two were cut with sugar, meaning 77% were found with MDMA as a single ingredient.
For dissociatives found as expected, neither ketamine or 3-HO-PCE were found to contain any inert cuts.
“Drugs are incredibly misunderstood, and have always been with us. Our most ancient civilizations used drugs, and we'll continue to do so. Time to get to know them.” - Claire Zagorski, Twitter thread on drug names
Spotlight sample: A powder that’s such a beautiful blue it reminds you of the water of a glacier-fed lake. It contained fentanyl and caffeine, just like a classic opioid down sample we see. Yet this sample was labelled as methamphetamine, with no methamphetamine to be found. We suspect this down sample got mislabelled somewhere along the line.
Spotlight sample: Curious crystal chunks, orderly and opaque. MDMA comes in all shapes and sizes; oh how we’ve seen the many appearances of this prize. Yet this time we found no MDMA, but rather N-ethylpentylone. This is a cathinone-substituted stimulant, so it gives similar effects to MDMA, however it has been linked to overdoses. Read more here. Dazzling may become dangerous when the dosing is unknown, but drug checking stands to discern what cannot be described visually to prevent the disorder.
Benzodiazepines (n=5)
Though we seem to be hearing a lot about benzodiazepine adulteration in the opioid down supply, there are many substances brought to our service that are expected to be a benzo as a single ingredient, usually as a tablet.
This month, four samples were expected to be Xanax (alprazolam) and one sample was expected to be flualprazolam. In no cases was the expected active benzo drug found; instead of flualprazolam, etizolam was found; instead of Xanax, etizolam and flualprazolam was found, along with two unidentified benzos. In this case, even though we couldn’t identify which benzo was present, we know that our paper spray--mass spectrometer target list is sensitive to alprazolam and did not find any; therefore, we can tell that for whatever benzo may be present, it isn’t the expected alprazolam.
Opioid Down (n=40)
In this section we present statistics specific to the opioid-down supply, therefore they may differ from the highlighted findings above that are inclusive of all expected drug categories.
93% expected opioid-down samples contained fentanyl (37/40)
1 samples contained carfentanil
38% samples contained a benzo and/or etizolam (15/40)
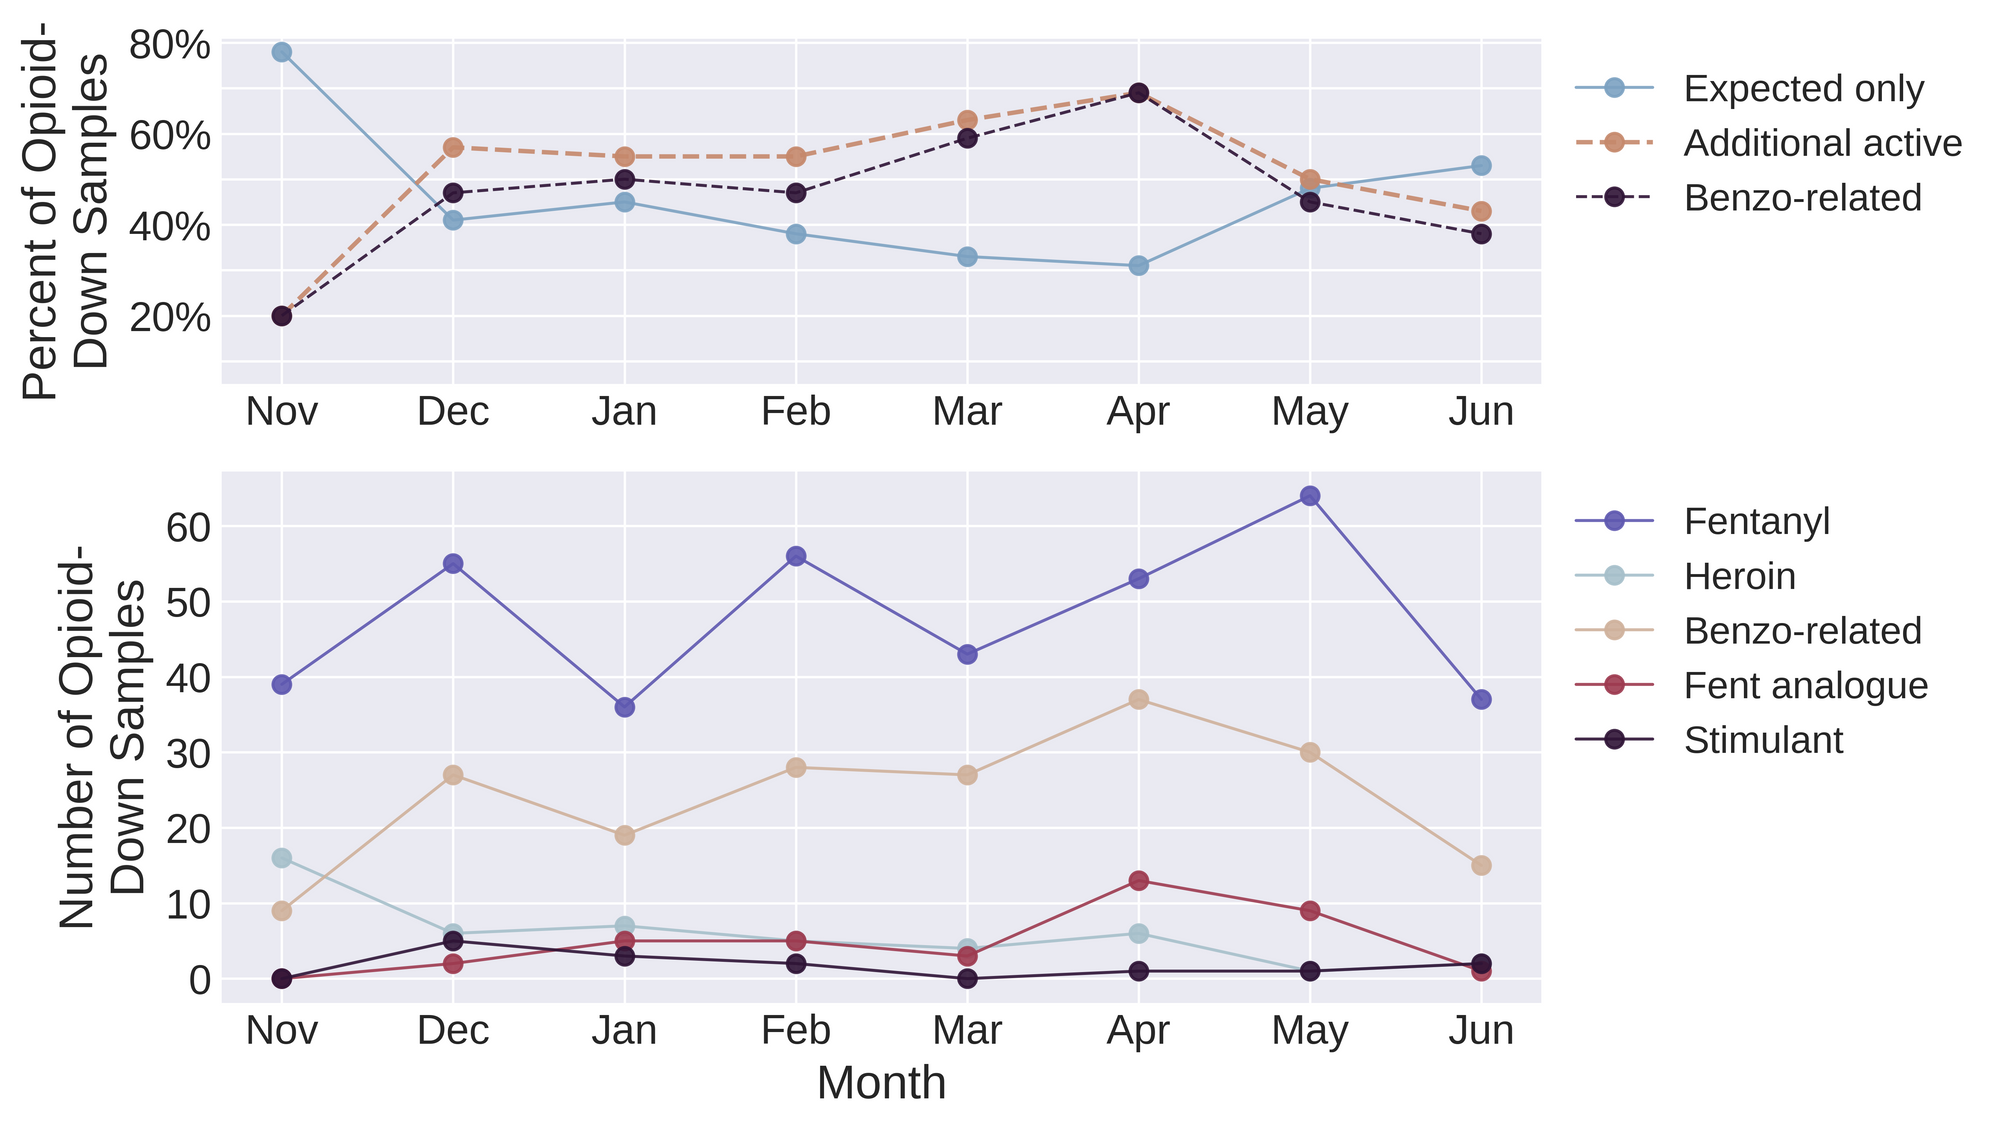
This June, 43% of opioid down samples contained an additional active to the expected fentanyl and/or heroin, with benzo-related drugs being the major contributor. This category represents the contaminated opioid down supply when adulterants are present, which is different from misrepresented samples where no expected active is found. Figure 2 illustrates the consistently high percentage of adulterants found in opioid down over time, highlighting the ever-changing conditions of prohibited markets. The only consistency we have is in knowing that each month there will be a high level of inconsistencies in the supply. People who use drugs have been pointing to the remedies to this unregulated supply for years, with calls for decriminalization and safer supply as effective interventions in the unregulated market. It’s long past time we listen.
Quantification for Opioid Down Samples

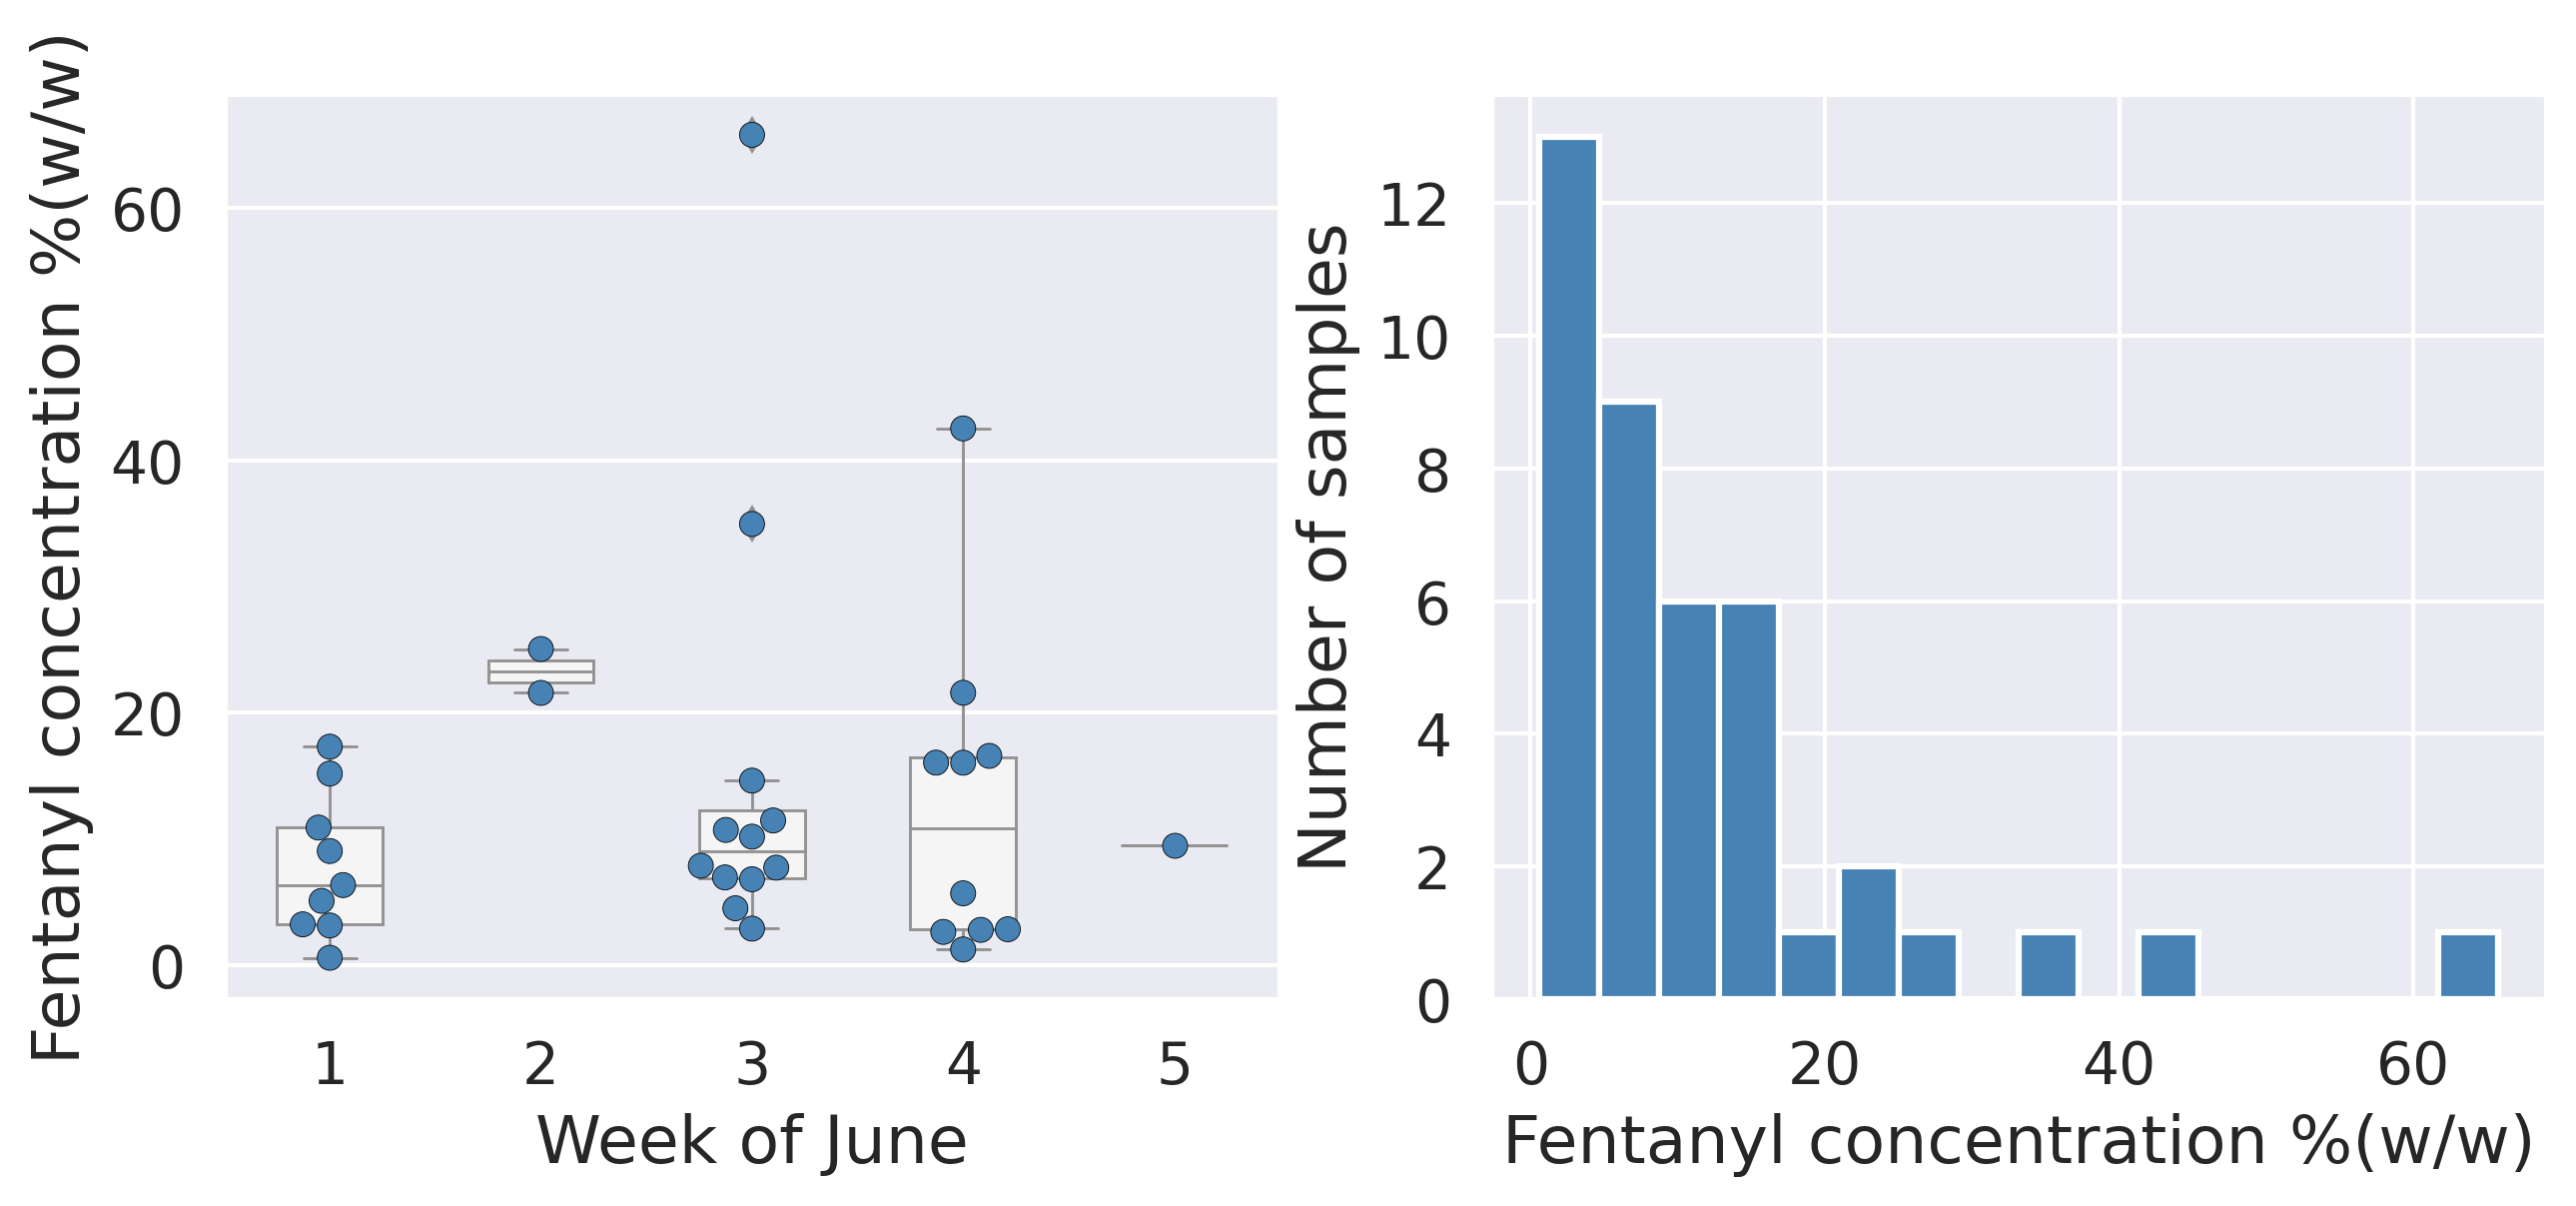
In June, we quantified fentanyl for 34/37 of the opioid down samples containing fentanyl and found the median concentration to be 9.2%, with the average strength of fentanyl we normally see being around 10%. Though the median is a useful indicator, it doesn’t capture the volatility of fentanyl concentrations present in the opioid supply, as any one sample might be the lowest strength (0.6%) or the strongest (65.8%). Figure 3 demonstrates the spread of concentrations we found in June by week (left) and for the month overall (right).
Want to be notified when we release these reports? Join our mailing list to receive updates about when our reports are out. You can subscribe and unsubscribe yourself from this list at any time.
Check back next month for the July report!
As always, send us feedback at substance@uvic.ca for how we can continue to offer our drug checking results in a useful way.