February 2023 Monthly Report

In this blog post, we discuss our February 2023 report and provide more information on how to interpret the results. The PDF report can be found at the end.
Key findings:
- The median fentanyl concentration found, across all expected drug categories, was 9.2% with a maximum of over 80%
- Carfentanil was found in 2 expected opioid-down samples at concentrations 0.09% and 7.42% (the highest concentration we have seen to date)
- Benzodiazepines and/or etizolam were found in 52% (186/356) of expected opioid-down samples
- The median concentration of bromazolam, the most common benzodiazepine found across all drug categories, was 2.2% with a maximum of 48.1% in an “unknown” sample
- Xylazine was found in 12 samples (10 expected opioid-down samples and 2 “unknown”), with a median concentration of 9.1% and a maximum concentration of 28.6%
Insight for the February 2023 Monthly Report
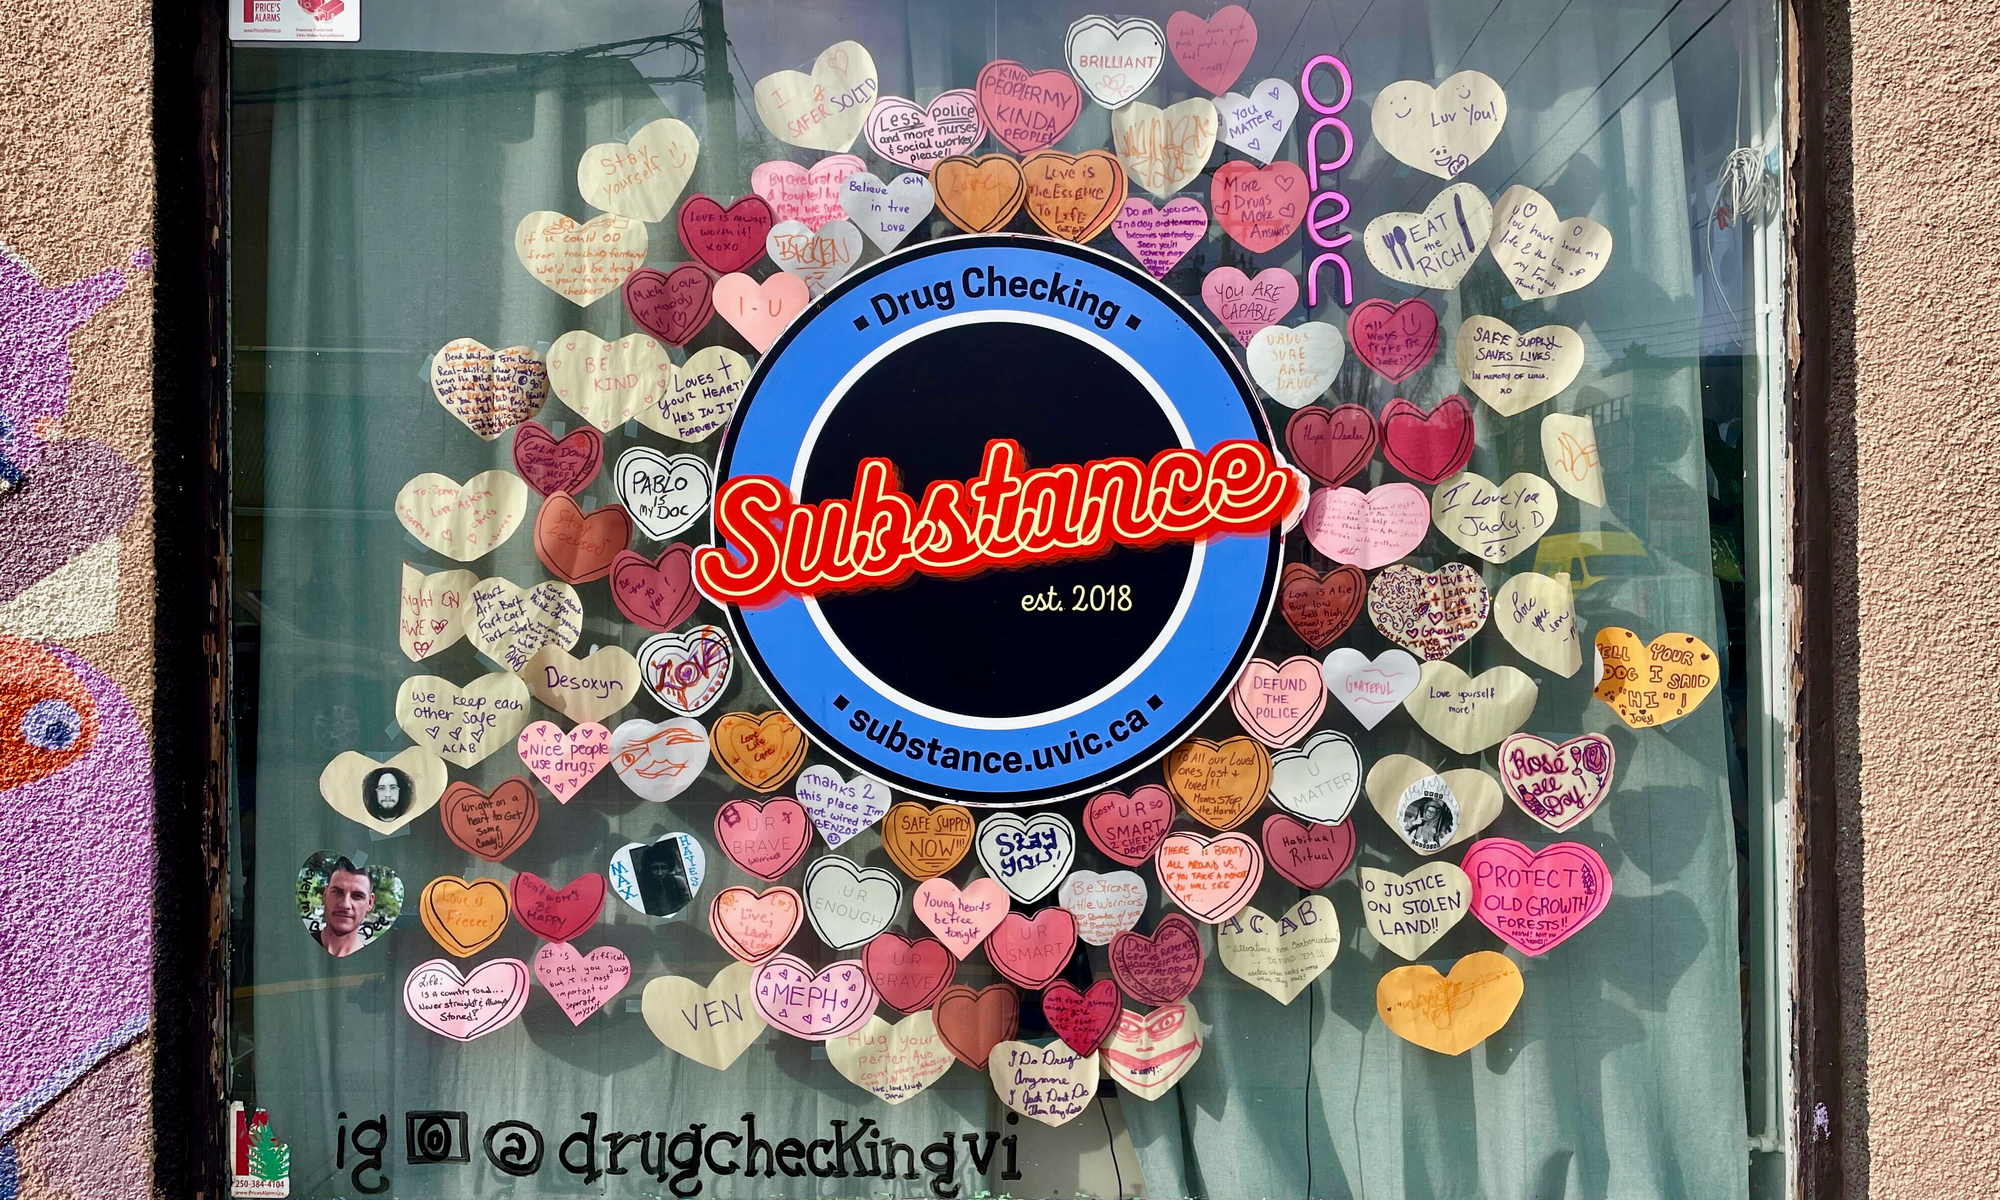
The window art at our Substance storefront has long been a point of conversation for those passing through North Park. Cleverly conceived and creatively composed by long-time project collaborator and local artist Darcie Dark, our windows have proudly hosted seasonally thematic scenes, queer puppy parades, mad elven scientists, a stoned Cerberus, somniferous dreamscapes, and countless other quirky characters and easter eggs (both literal and figurative). Adorned in kaleidoscopic colours these dazzling displays of form masterfully encapsulate the energy of the artist, the spirit of our project, and the vitality of our community.
While absolutely delightful and outright dope A.F. to enjoy on their own, Darcie’s vibrant murals also make Substance a highly visible presence in North Park. We hope that by pulling previously hushed conversations about drug use out of hidden places and broadcasting them in loud, unabashed technicolour tones, we can help to reduce the harmful stigma that has kept drug use dangerously isolated from community support. Darcie’s murals are our visual loudspeakers screaming “Come talk to us about drugs! We are here for you!” and we are immensely grateful for the resonant voice that she has shared with us through her art.
In February, the community heard our call and joined our conversations thanks to an interactive project that Darcie created. Collaborative art by the community for the community, Darcie’s vision was for people to share messages of love and care through Valentine’s Day themed conversation hearts showcased in our window display. Peep the cover photo of this blog to peruse the personal, passionate, and playful pieces that people produced for this phenomenal art project. Love is in the air and your love and support are deeply felt and cherished. We are grateful for the unwavering kindness you have shown us and each other, and we pledge to reciprocate that love in all that we do.
This blog, and the associated pdf report, breakdown our sample counts into six categories:
-
samples received through direct service provision in Victoria, where service users are bringing samples into the Substance storefront. These samples are labelled as “Substance” samples in the figures/tables of this blog post
-
samples received through direct service provision in Campbell River, where service users bring samples to the Vancouver Island Mental Health Society (VIHMS). These samples are labelled as “Campbell River”.
-
samples received through direct service provision in the Comox Valley, where service users are bringing samples to AVI Health & Community Services in Courtenay, BC. These samples are labelled as “Comox Valley”.
-
samples received through direct service provision in the Cowichan Valley, where service users bring samples to the Duncan Lookout Society OPS in Duncan, BC. These samples are labelled as “Duncan”.
-
samples received through direct service provision in Port Alberni, where service users bring samples into Port Alberni Shelter Society’s OPS. These samples are labelled as “Port Alberni”.
-
samples received through indirect service provision, where samples are collected through no-contact drop-off envelopes, are collected by harm reduction workers and other community members at supported housing sites, overdose prevention sites, and supervised consumption locations. These samples are labelled as “Outreach” samples in the figures/tables herein. February’s Outreach data also includes samples checked at the Song & Surf Music Festival.
Drug types
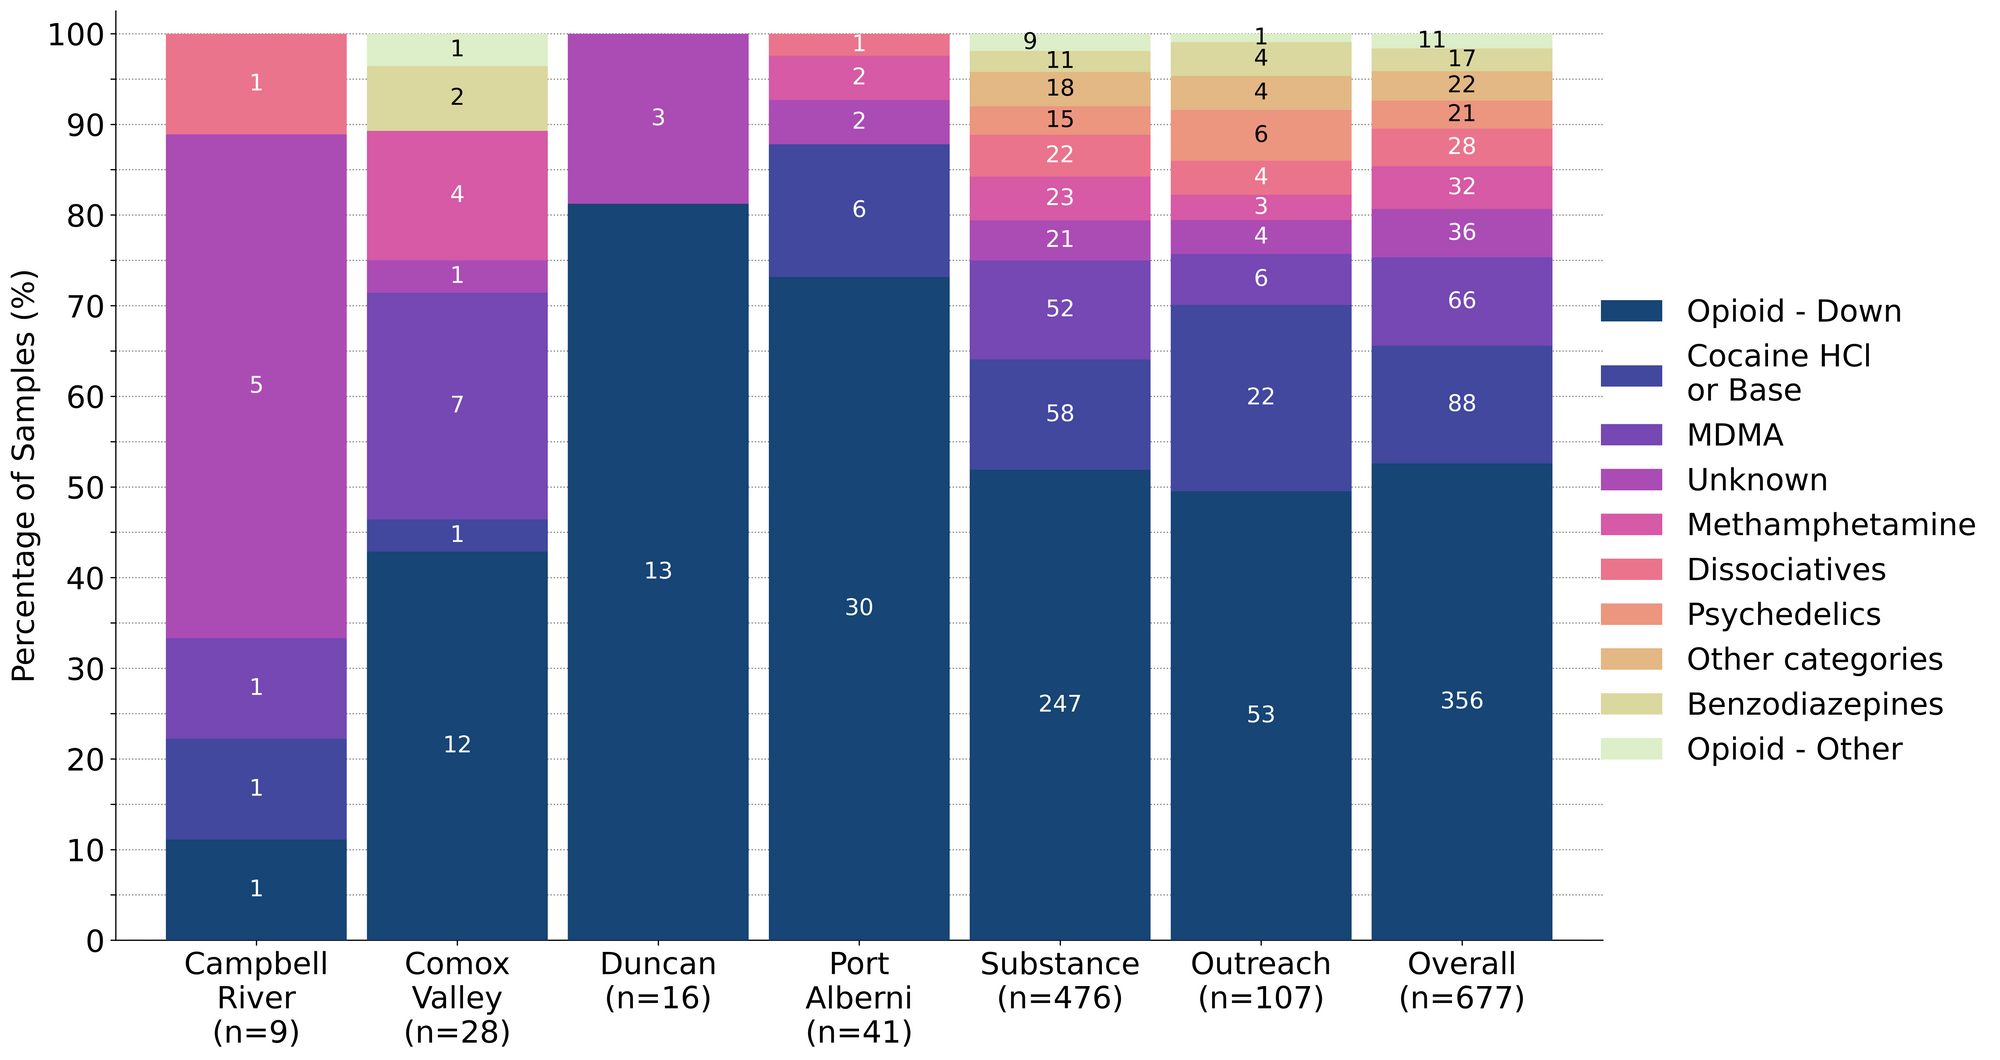
February’s fab flurry furnished us with flakes of fluorescent fluorofentanyl, fragments of flualprazolam filled formulations and a farrago of far-out things that fall between. Fig. 1 shows the prevalence of each expected drug category checked, split by sample collection location/method.

Fabled fillers or frankly familiar?
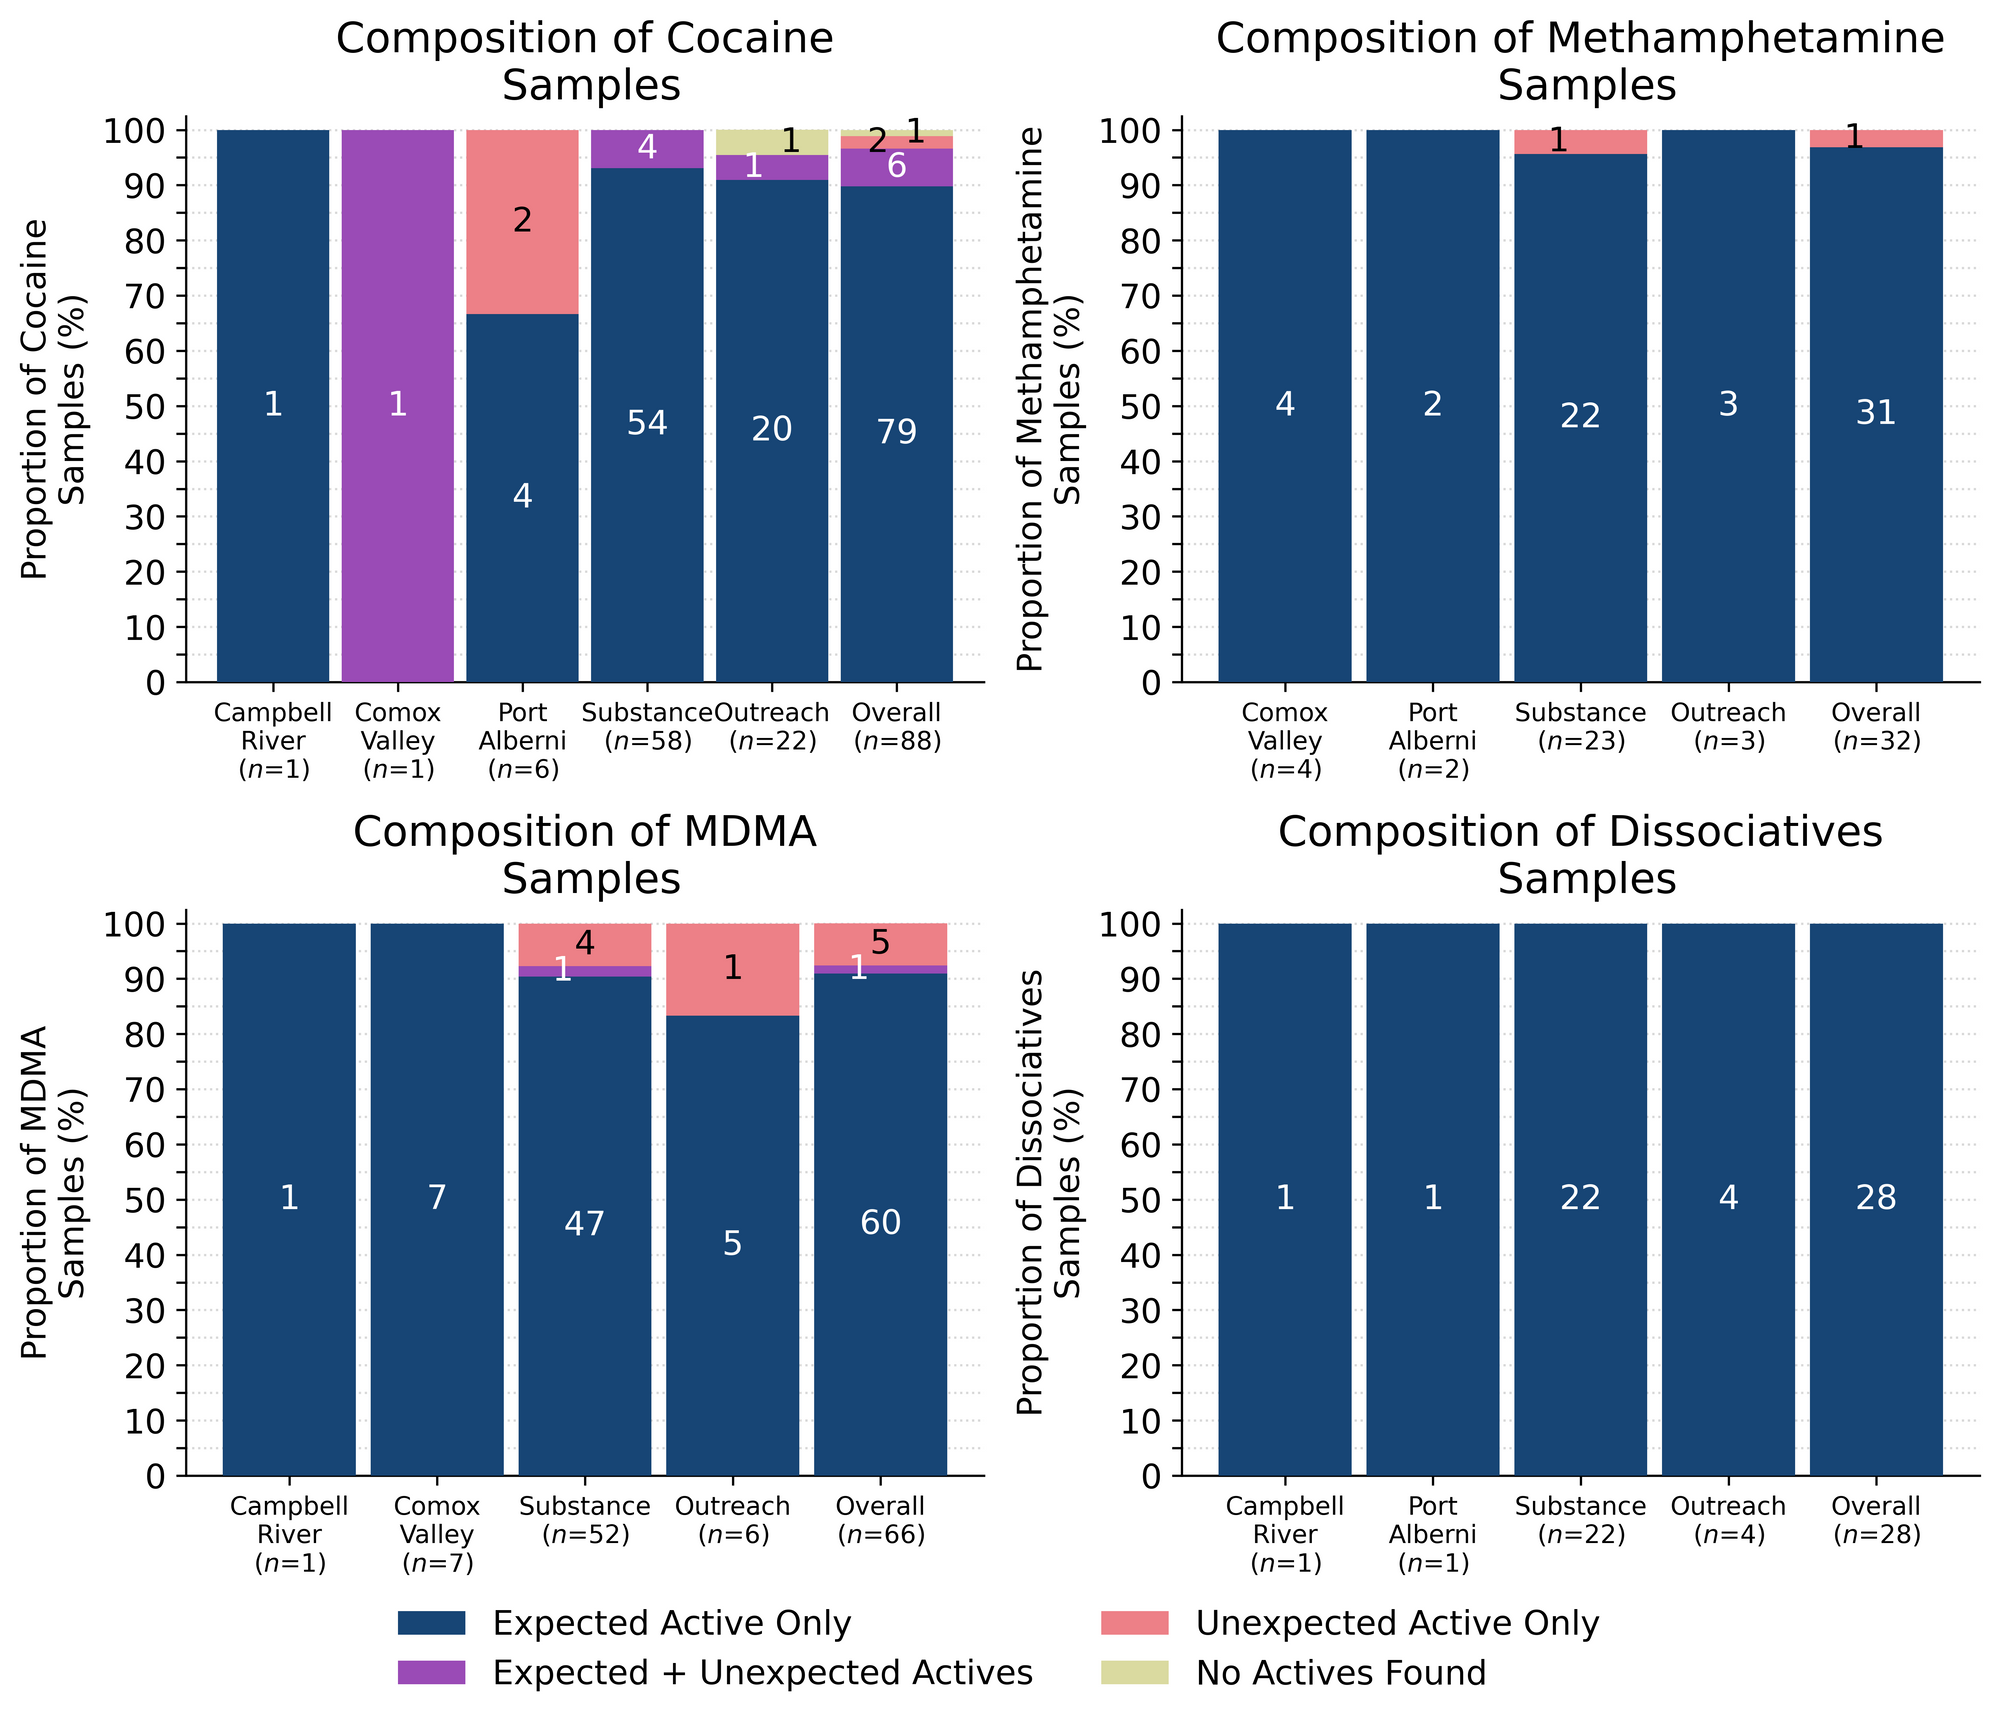
For a majority of samples checked, we confirm that the expected drug was indeed the only active and that no additional active compounds were present. The bar charts below highlight a few classes of drugs, differentiating samples when only the expected active was found from situations when other unexpected active components were detected.
Celebrate another day when K continues to be K! 100% (28/28) of expected ketamine samples checked in February were confirmed to be ketamine with no other active compounds detected. Inactive cuts were only detected in one sample, with a sparkly shard checked in Victoria containing monosodium glutamate (MSG) as a cutting agent at around 35% by weight.
97% (31/32) of expected methamphetamine samples checked were found to be meth with no other active compounds or inactive cuts detected. The remaining expected methamphetamine sample contained no meth at all; instead, it was found to be a mixture of 19% heroin and caffeine, with the related alkaloids acetylcodeine and acetylmorphine detected at 1% as well. This sample was checked in Victoria and was a bright yellow pebble speckled with green and black spots. As we like to say: “meth is meth" (except when it is not).
91% (60/66) of expected MDA/MDMA samples checked were confirmed to be MDA (7 samples) and MDMA (53 samples), as expected. Tracking inactive cuts, two MDMA samples were cut with caffeine. The remaining six expected MDA/MDMA samples displayed a range of compositions:
- Two expected MDMA samples were found to be MDA instead. Both were checked in Victoria
- Two expected MDA samples from Victoria were found to be MDMA instead
- One expected MDMA sample from Victoria was found to be a mixture of both MDA and MDMA
- One expected MDMA sample from Victoria contained no MDMA and was found to be the steroid methandrostenolone instead
90% (79/88) of expected cocaine samples checked were confirmed to be cocaine with no active adulterants detected. Five of these samples were found to contain an inactive cutting agent, with creatine, flour, glutamine, inositol, and sugar individually detected in the five samples. Four of these samples were checked in Victoria, while the sample containing glutamine was checked at the Song & Surf Music Festival.
6 samples contained an active component in addition to cocaine:
- Acetaminophen - 1 sample (Song & Surf); Tylenol/Paracetamol
- Benzocaine - 1 sample (Comox Valley); a local anesthetic/numbing agent
- Levamisole - 1 sample (Victoria); an antihelminthic drug used to treat parasitic worm infections, commonly seen as a cut in cocaine
- Phenacetin - 3 samples (all from Victoria); “super buff” a tylenol-like drug, commonly seen as a cut in cocaine
- One sample was additionally cut with inositol
Two samples, both checked in Port Alberni, did not contain any cocaine and appeared to be misrepresented down samples as they were found to contain fentanyl, fluorofentanyl, bromazolam, and caffeine. Both samples were reported to be cocaine base (crack/hard/rock), with one sample being a hot pink powder and the other a lavender purple powder. The remaining cocaine sample, received at Song & Surf, was unfortunately too sparse for us to collect any usable data.
Benzodiazepines (n=17)
All of the expected benzodiazepine samples checked in February came to our service sites in the form of pressed pills with the following expected and detected compositions:

Opioid-Down (n=356)
In this section we present results specific to the opioid-down supply, therefore they may differ from the highlighted findings above that are inclusive of all expected drug categories.
- 95% of expected opioid-down samples contained fentanyl (337/356)
- 8 samples contained heroin (2% of expected opioid-down samples)
- 2 samples were just heroin (and related alkaloids like acetylmorphine (MAM) and acetylcodeine). All were checked in Victoria
- 6 samples additionally contained fentanyl ranging from 10% to 21%.
- Etizolam was detected in one of these samples at over 25% as well
- 37% of expected opioid-down samples contained fluorofentanyl (130/356)
- 2 samples contained carfentanil, with the following compositions:
- One sample (Comox Valley) contained carfentanil at 0.09%, fentanyl at 3%, fluorofentanyl at 0.1%, bromazolam at 3%, etizolam at 0.8%, and xylazine at 0.2%, with caffeine as a cutting agent
- One sample (Victoria) contained carfentanil at 7.42% and an undifferentiated benzodiazepine, with caffeine and mannitol (a sugar) as cutting agents. This sample had already been tried by the service user who reported it to be “quite strong” and noted its unique chemical taste. This is the highest concentration of carfentanil that we have detected to-date
- 52% of expected opioid-down samples contained a benzodiazepine and/or etizolam (186/356)
- Xylazine was detected in 3% (10/356) of opioid-down samples
- We did not detect any nitazenes (benzimidazole-opioids) within the opioid-down supply in February
In February, 67% (237/356) of all opioid-down samples checked contained an additional active to the expected fentanyl/heroin. These data are shown in Fig. 3 highlighting the prevalence of benzos, fluorofentanyl, and xylazine in the down supply.
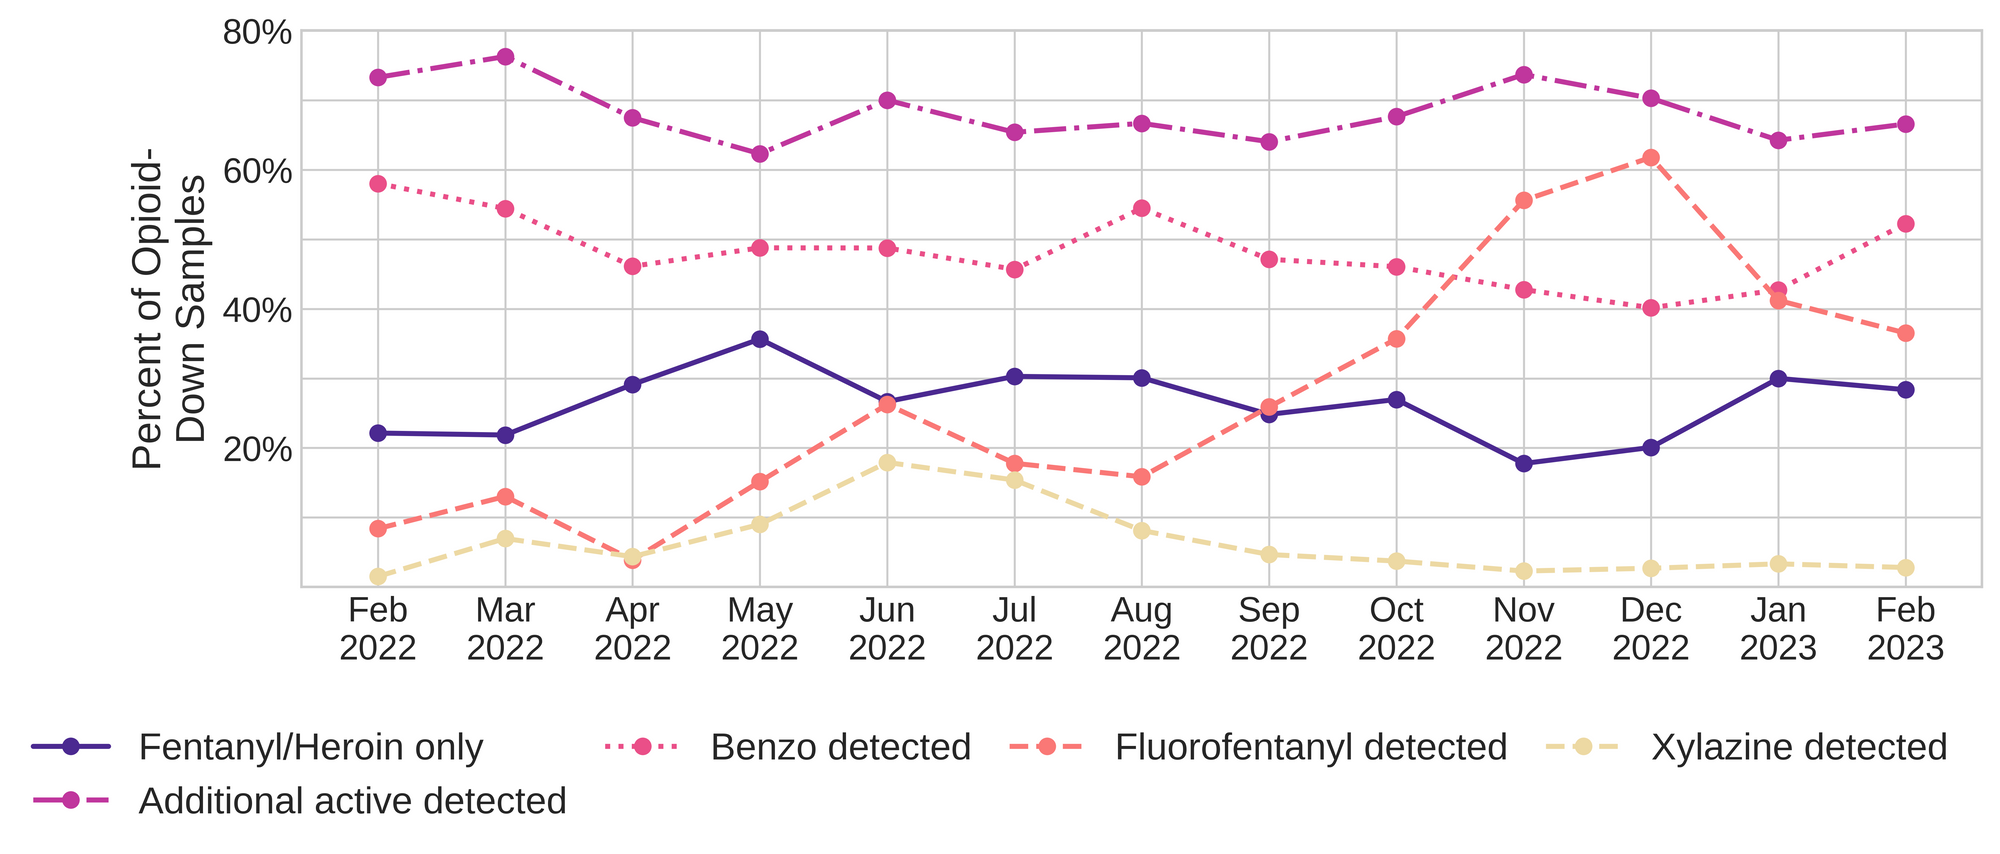
Fluorofentanyl was the most common additional active found within the opioid-down supply, with 33% (119/356) of opioid-down samples containing fluorofentanyl in addition to fentanyl. Additionally, fluorofentanyl was the only opioid detected in 3% (11/356) of opioid-down samples (i.e. no fentanyl or heroin was detected in these samples). The prevalence of fluorofentanyl in the down supply continues to appear to be decreasing when compared to previous months (see Fig. 3), however, this trend may just be another example of volatility in the unregulated supply.
Benzo-related drugs contribute to a majority of the other additional actives found in expected opioid-down samples, with 52% (186/356) of expected opioid-down samples checked containing a benzo-related drug, a slight increase in the prevalence of benzo-down seen in January (43% of opioid-down samples). Bromazolam continues to be the most common benzo seen in the down supply, with bromazolam being detected in 77% (144/186) of the benzo-positive opioid-down samples. Scattered detections of other drugs are still found and can be reviewed in the pdf report at the end of this blog.
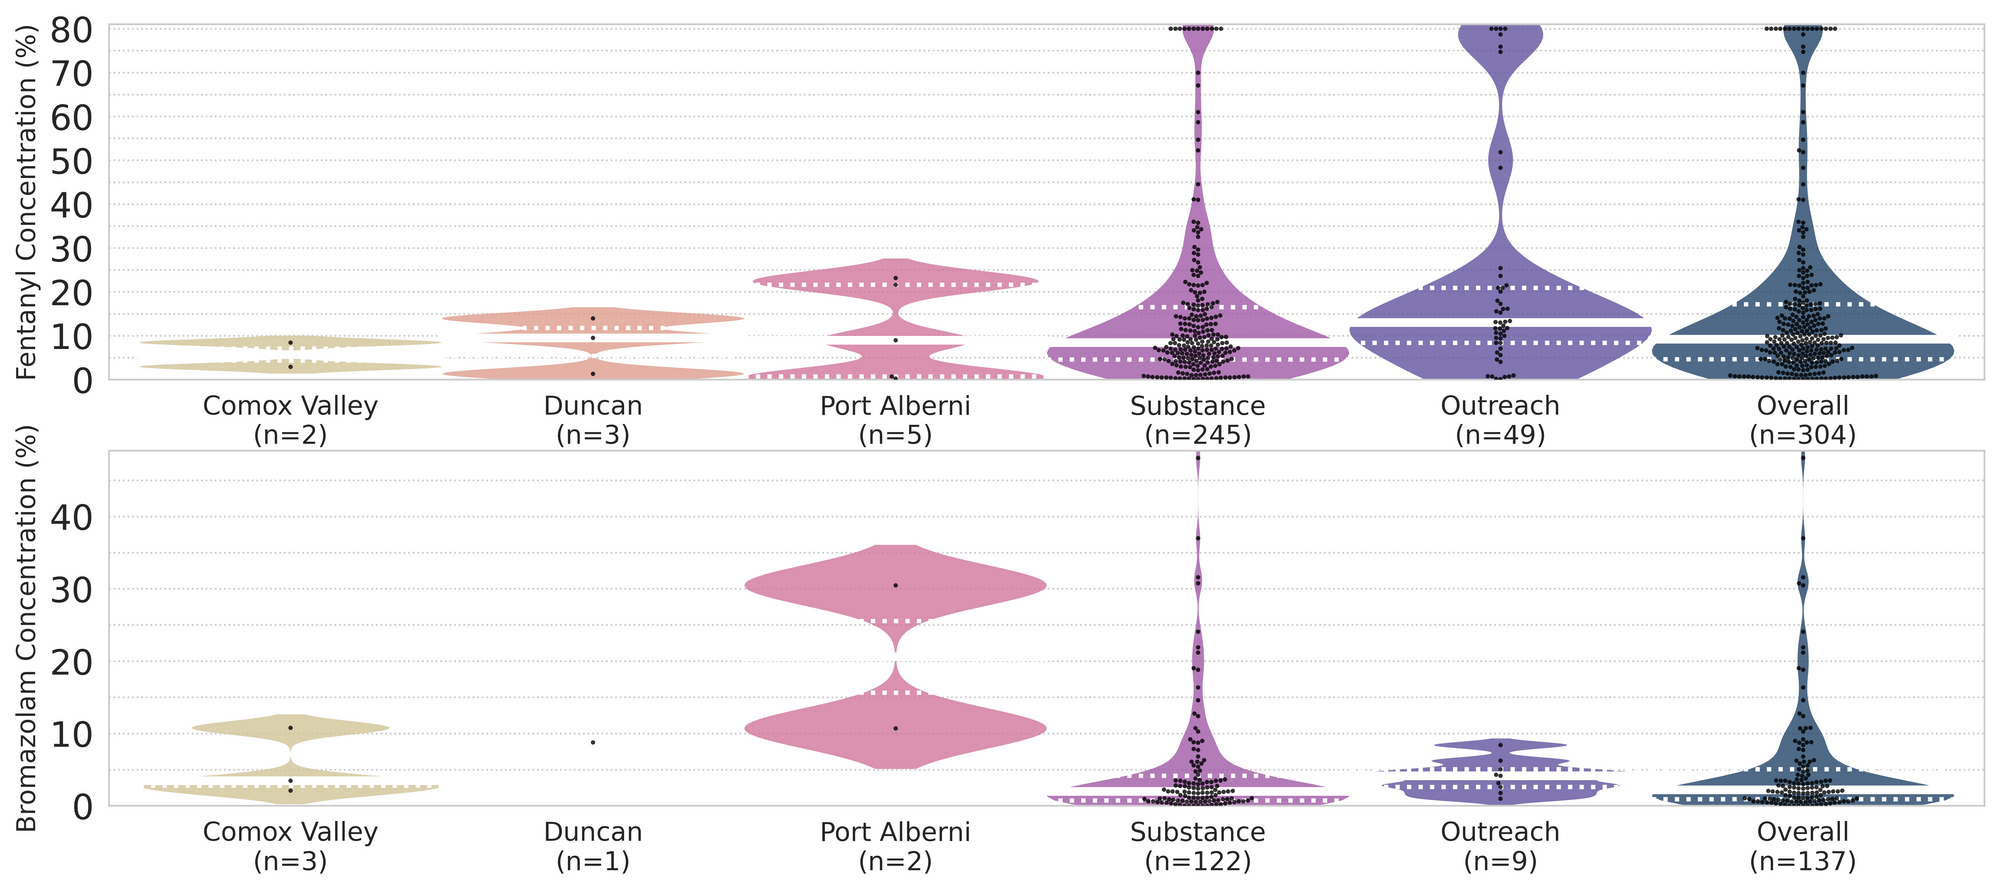
Quantification for Expected Opioid-Down[1]
In February, we quantified fentanyl for 295 of the expected opioid-down samples containing fentanyl and found the median concentration to be 9.2%[2]. Though the median is a useful indicator, it doesn’t capture the volatility of fentanyl concentrations present in the opioid supply, as half of fentanyl-positive down samples contained between 4.7% and 17.3% fentanyl, and any one sample might be the lowest strength (0.1%) or the strongest (>80%[3]). Similarly, the concentration of bromazolam was across the board in expected opioid down samples, with samples ranging from 0.1% to 37.0% bromazolam, with a median of 2.2%.
Not all opioid down samples brought to our service can be quantified. This is primarily due to too limited sample collected for our instruments to report a reliable mass percentage. Nevertheless, qualitative detection is still possible. ↩︎
This number is specific to fentanyl quantified in opioid-down samples. The median concentration listed in the Key Findings at the beginning of this blog (9.2%) is inclusive of all samples checked, across all drug classes, that contained fentanyl. ↩︎
For samples that contain more than 80% fentanyl, or more than 25% etizolam by weight, our mass spectrometer is presently unable to reproducibly assign a concentration due to the upper limits of the calibration methods currently adopted. ↩︎

Want to be notified when we release these reports? Join our mailing list to receive updates about when our reports are out. You can subscribe and unsubscribe yourself from this list at any time.
Check back next month for the March report!
As always, send us feedback at substance@uvic.ca on how we can continue to offer our drug checking results in a useful way.