February 2021 Monthly Report

In this blog post we discuss our February 2021 report and provide more information on how to interpret the results. We are excited to present additional reporting of fentanyl, etizolam, heroin, and carfentanil concentrations through our collaboration with Dr. Chris Gill and the team at Vancouver Island University. The PDF report can be found at the end.
Highlighted findings:
- Carfentanil found in 5 samples expected to be opioid-down
- 49% of samples containing fentanyl found to have concentrations greater than 10% fentanyl
- Fentanyl median concentration of 10.0% found, with a max concentration of 67.7% found in an expected opioid-down sample
- Benzodiazepines and/or etizolam found in 47% of expected opioid-down samples
- Etizolam median concentration of 2.2% found, with a max concentration of 9.6% found in an expected opioid-down sample
This February 2021 we set a record for our busiest month to date with 179 samples! We saw a 184% increase in service uptake from 2020.

Are all drugs cut?
No! For many drug types, we often find over half of the drugs to be uncut. When we say uncut, we mean that through our various technologies we find nothing additional to the expected drug.
Methamphetamine - 12/12 samples (100%) were found to only contain methamphetamine.
Cocaine - 11/16 samples (69%) were found to only contain cocaine. When cut, samples contained various agents, including baking soda, creatine, phenacetin (acetaminophen-like substance), and procaine (topical anesthetic). One sample was found to be ketamine.
Ketamine - 4/6 samples (67%) were found to contain only ketamine. One sample contained an oily residue and one was found to be cocaine.
MDMA - 9/13 samples (69%) were found to only contain MDMA. Two samples contained sugars, one sample contained cocaine, and one sample contained MDA.
Expected Benzodiazepine (n=11)
9 expected Xanax (alprazolam): we found undifferentiated benzodiazepine (4), etizolam (3), flualprazolam (1), alprazolam (1).
1 expected clonazolam: we found undifferentiated benzodiazepine (1).
1 expected flualprazolam: we found flualprazolam (1).
When we say “undifferentiated benzodiazepine” we mean the benzodiazepine strip test was found positive, but due to the limit of detection of our instruments or lack of reference standards available we were unable to identify which benzo in the diverse class was present.
Expected Opioid Down (n=60)
In this section we will present statistics specific to the opioid-down supply, therefore they may differ from the highlighted findings above that are inclusive to all expected drug categories.
Fentanyl and analogues
- 93% expected opioid samples contain fentanyl (56/60)
- 8% samples contained carfentanil (5/60)
- 49% samples quantified contained over 10% fentanyl (24/49)
Benzos and etizolam
- 47% samples contained etizolam (28/60)
- 7% samples contained etizolam and a benzo (4/60)
55% of opioid-down samples contained an active in addition to fentanyl and/or heroin. These actives come in various combinations. A comprehensive list for February combinations can be seen in Table 2.

Quantification for expected opioid-down
These values differ from those contained in the attached PDF report because they are restricted to expected opioid-down samples.

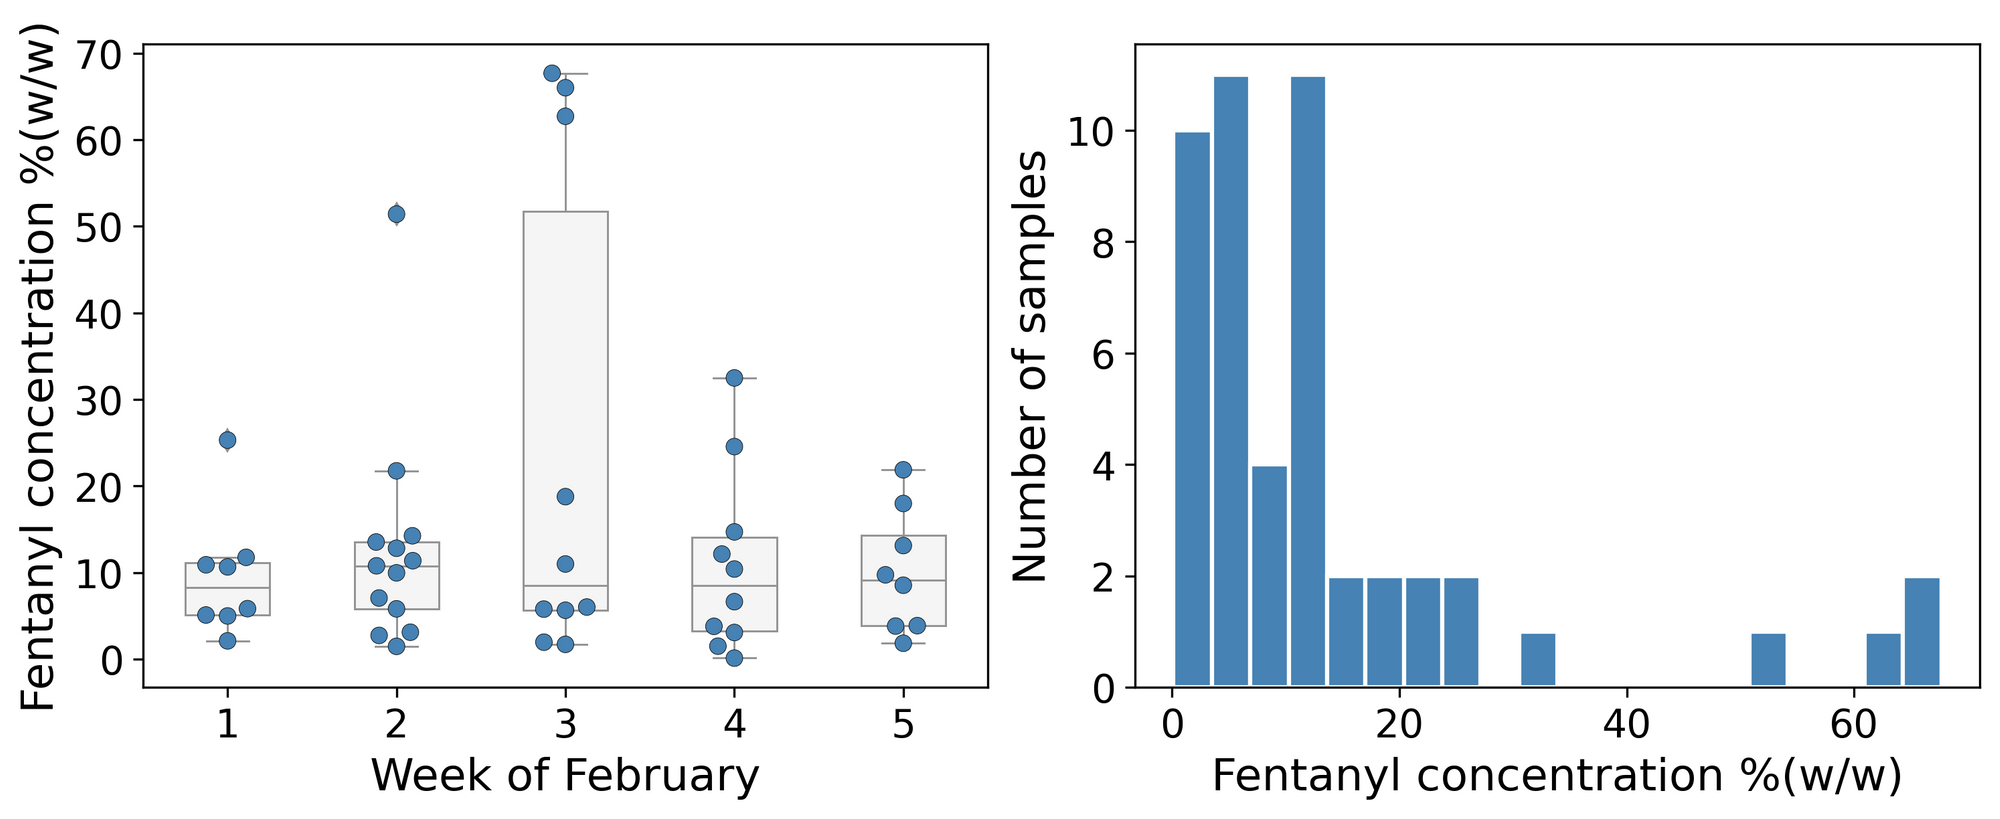
In February, we quantified fentanyl for 49 of the 56 of the expected opioid-down samples containing fentanyl. We found the median concentration to be 10.0% fentanyl. Figure 1 demonstrates the spread of fentanyl concentrations in February by week (left) and for the month overall (right).
The average strength of fentanyl in opioid-down we see during service in general is around 10%. The median concentration of 10% fentanyl for February is consistent with this. Our findings illustrate the variable concentrations of fentanyl in the opioid-down supply, as any one sample may be low strength (less than 1% fentanyl) or very strong (up to 70% fentanyl). Overall, 49 percent of samples were found to be above average strength (greater than 10% fentanyl).
Want to be notified when we release these reports? Join our new mailing list to receive updates about when our reports are out. You can subscribe and unsubscribe yourself from this list at any time.
Check back next month for the March report!
As always, send us feedback at substance@uvic.ca for how we can continue to offer our drug checking results in a useful way.