December 2020 Monthly Report


In this blog post we discuss our December 2020 report and provide more information on how to interpret the results. We are also excited to announce the additional reporting of fentanyl concentrations through our collaboration with Dr. Chris Gill and his team at Vancouver Island University. The PDF report can be found at the end.
Key findings:
- Carfentanil was found in two expected opioid-down samples
- 41% of expected opioid-down samples contained etizolam, a benzodiazepine-related drug
- 14% of expected opioid-down samples contained a benzodiazepine drug
- 59% of expected opioid-down samples contained an active in addition to the expected fentanyl and/or heroin
- The median concentration of the expected opioid-down samples quantified in December was 8.8% fentanyl
- 44% of the expected opioid-down samples quantified were found to have concentrations higher than 10% fentanyl
- 50% of expected benzodiazepine samples contained fluaplrazolam
Insight for the December 2020 Monthly Report
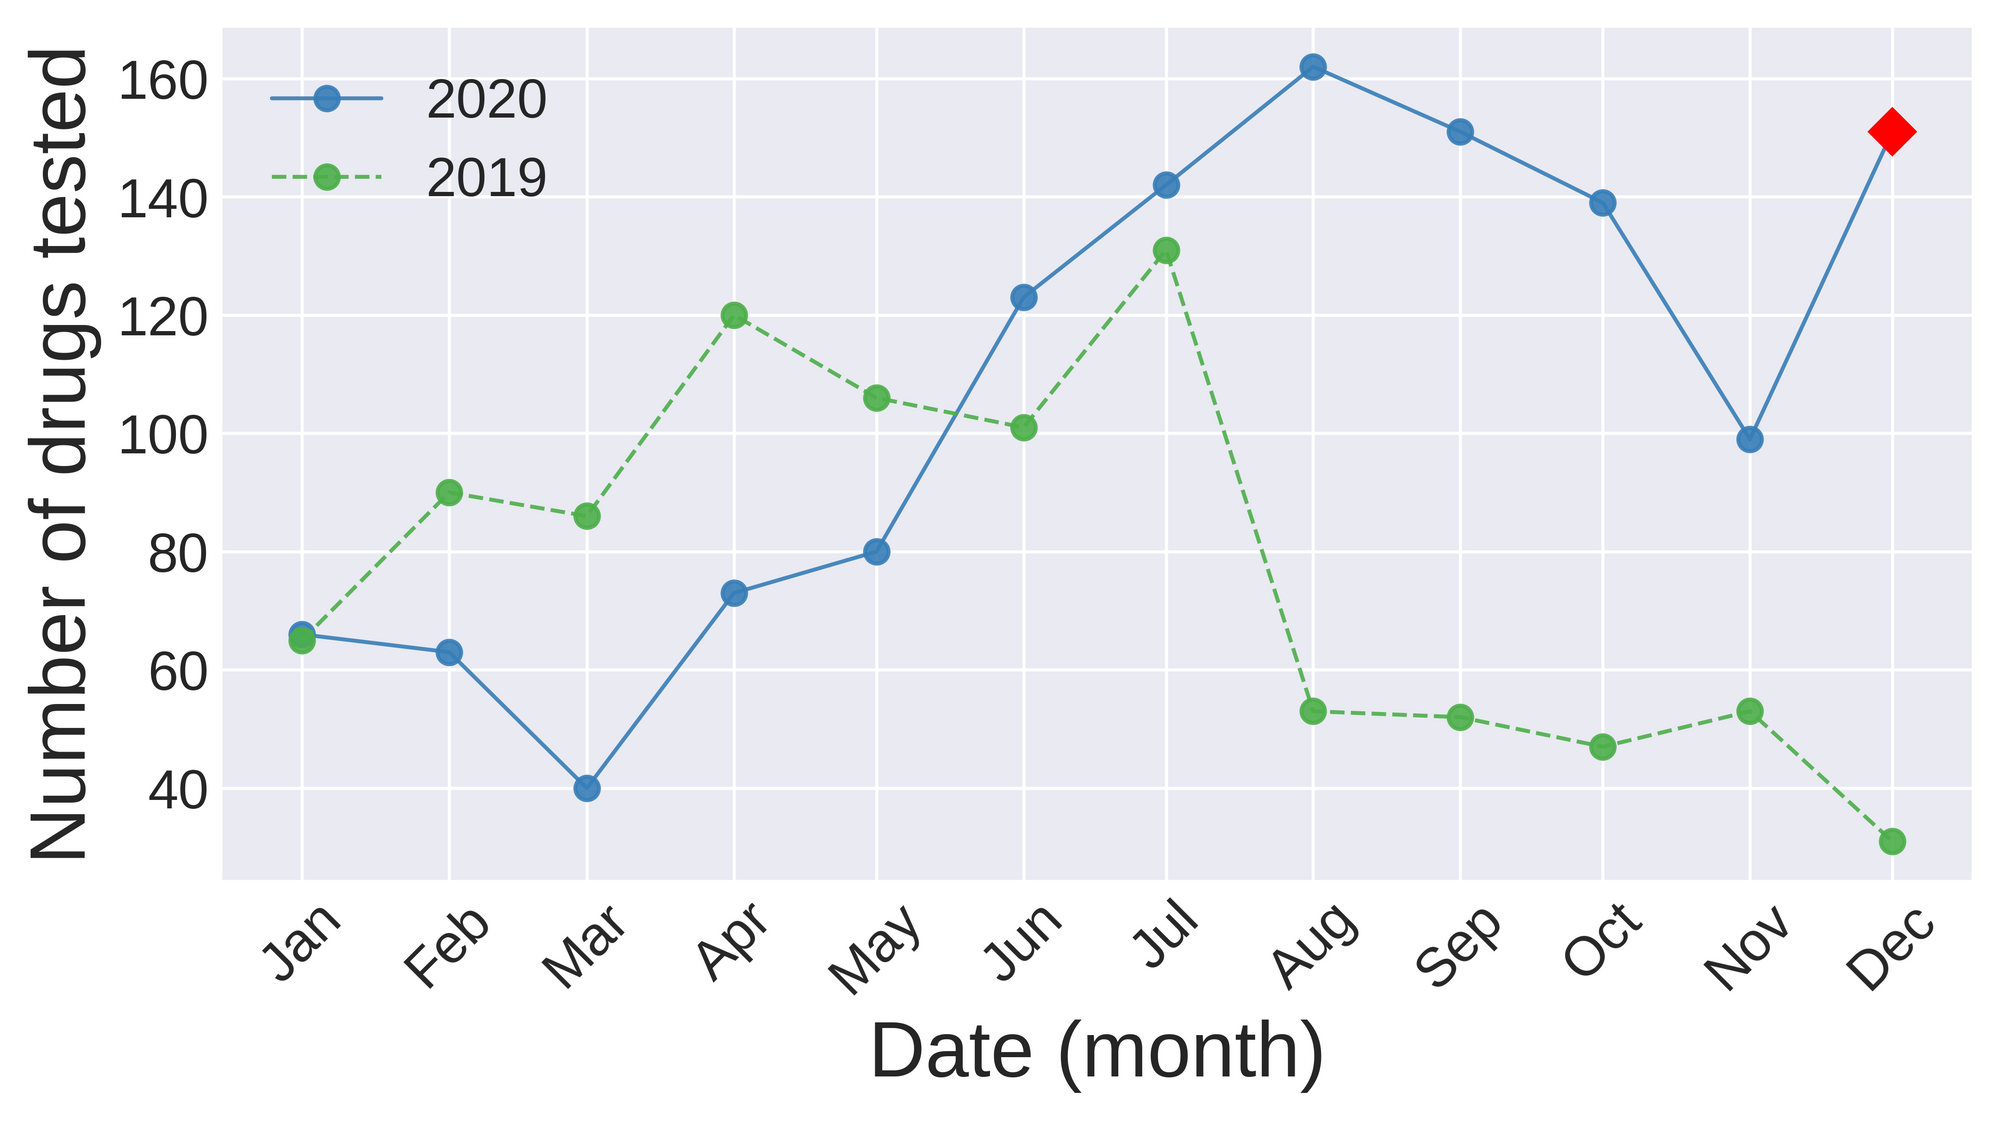
This December was busy for our service with 151 samples checked. This is a huge jump from November where we checked 99 samples. In comparison to December 2019 with 31 samples, this month showed a 387% increase over the same time period last year. We are happy to have been active in the community during the holiday season!
Expected Depressant-Benzodiazepine
This December we checked eight samples expected to be benzodiazepines. All samples resulted in a negative fentanyl strip test. Flualprazolam was found in 4 samples; this is a designer benzodiazepine. Read more here.
Unspecified benzodiazepine (n=4).
Alprazolam (the active in Xanax) was detected in one sample. Flualprazolam was detected in one sample. Two samples were unable to differentiated in their active.
Expected alprazolam (Xanax) (n=2).
Flualprazolam was found in both samples. It is important to note that the expected active alprazolam was not found. The majority of Xanax bars come from the dark net and are not pharmaceutical made. It’s a good idea to test before you ingest.
Expected flualprazolam (n=1).
Flualprazolam was found.
Expected etizolam (n=1).
Etizolam was found.
Expected Psychedelic
Hey all you party people, day trippers, psychonauts and microdosers; we haven’t forgotten about you! This December we checked 16 samples expected to be psychedelics. All samples resulted in a negative fentanyl strip test.
Expected LSD (n=2).
LSD was detected in one sample. The other sample the result was inconclusive, so we cannot confirm or deny the presence of LSD.
Expected 2CB (n=1).
A mixture of MDMA and Ketamine were found in this sample expected to be 2CB.
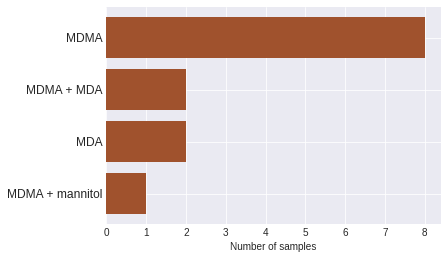
Expected MDMA (n=13).
The MDMA results are summarized in Figure 4. Ten samples contained MDMA as the only active, while three samples contained MDA. Read more about MDA here.
Expected Opioid-Down
As demonstrated in our previous reports, benzodiazepines and the structurally-related etizolam continue to be found in the opioid-down supply. The additive effects of these sedatives leads to a higher risk of overdose and are cause for concern as they do not respond to naloxone, however naloxone should still be given in the event of an overdose.
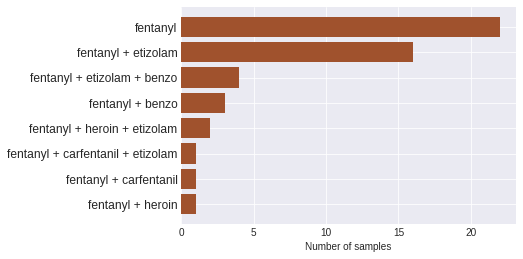
In December, etizolam was found in 24 down samples (41%) and benzodiazepines were found in eight down samples (14%). Figure 2 shows the varying combinations of fentanyl, carfentanil, etizolam and benzodiazepines to provide clarification from the overall component counts found in the monthly aggregate report. These combinations are not an exhaustive list for this month and for simplicity only represent 50 of the 58 opioid-down samples.
Carfentanil is a highly potent active present at low concentrations that our instruments struggle to detect. From our collaboration with Vancouver Island University and their paper spray - mass spectromety technology we are now able to accurately detect carfentanil.
F E N T A N Y L . Q U A N T I F I C A T I O N
Fentanyl detection has been a drug checking focus for many years, which is achieved through the use of test strips. More recently, the focus has shifted from detection to quantification in order to provide meaningful results for when fentanyl is the expected drug. Detection is centered on finding whether fentanyl is present while quantification is centered on finding out how much fentanyl is present. Our team has made significant progress in achieving this through FTIR technology, but due to instrument limitations we can only currently provide rough approximations of fentanyl concentrations. With our recent collaboration with Dr. Chris Gill and his team at Vancouver Island University, we are able to more accurately quantify fentanyl through the use of paper spray - mass spectrometry. An important limitation to keep in mind with quantification data is that we are only testing a small portion of the bulk drug sample a service user brings in. We get an idea about the concentration, but due to possibilities of incomplete mixing, we are unable to say this value fully represents the bulk sample.
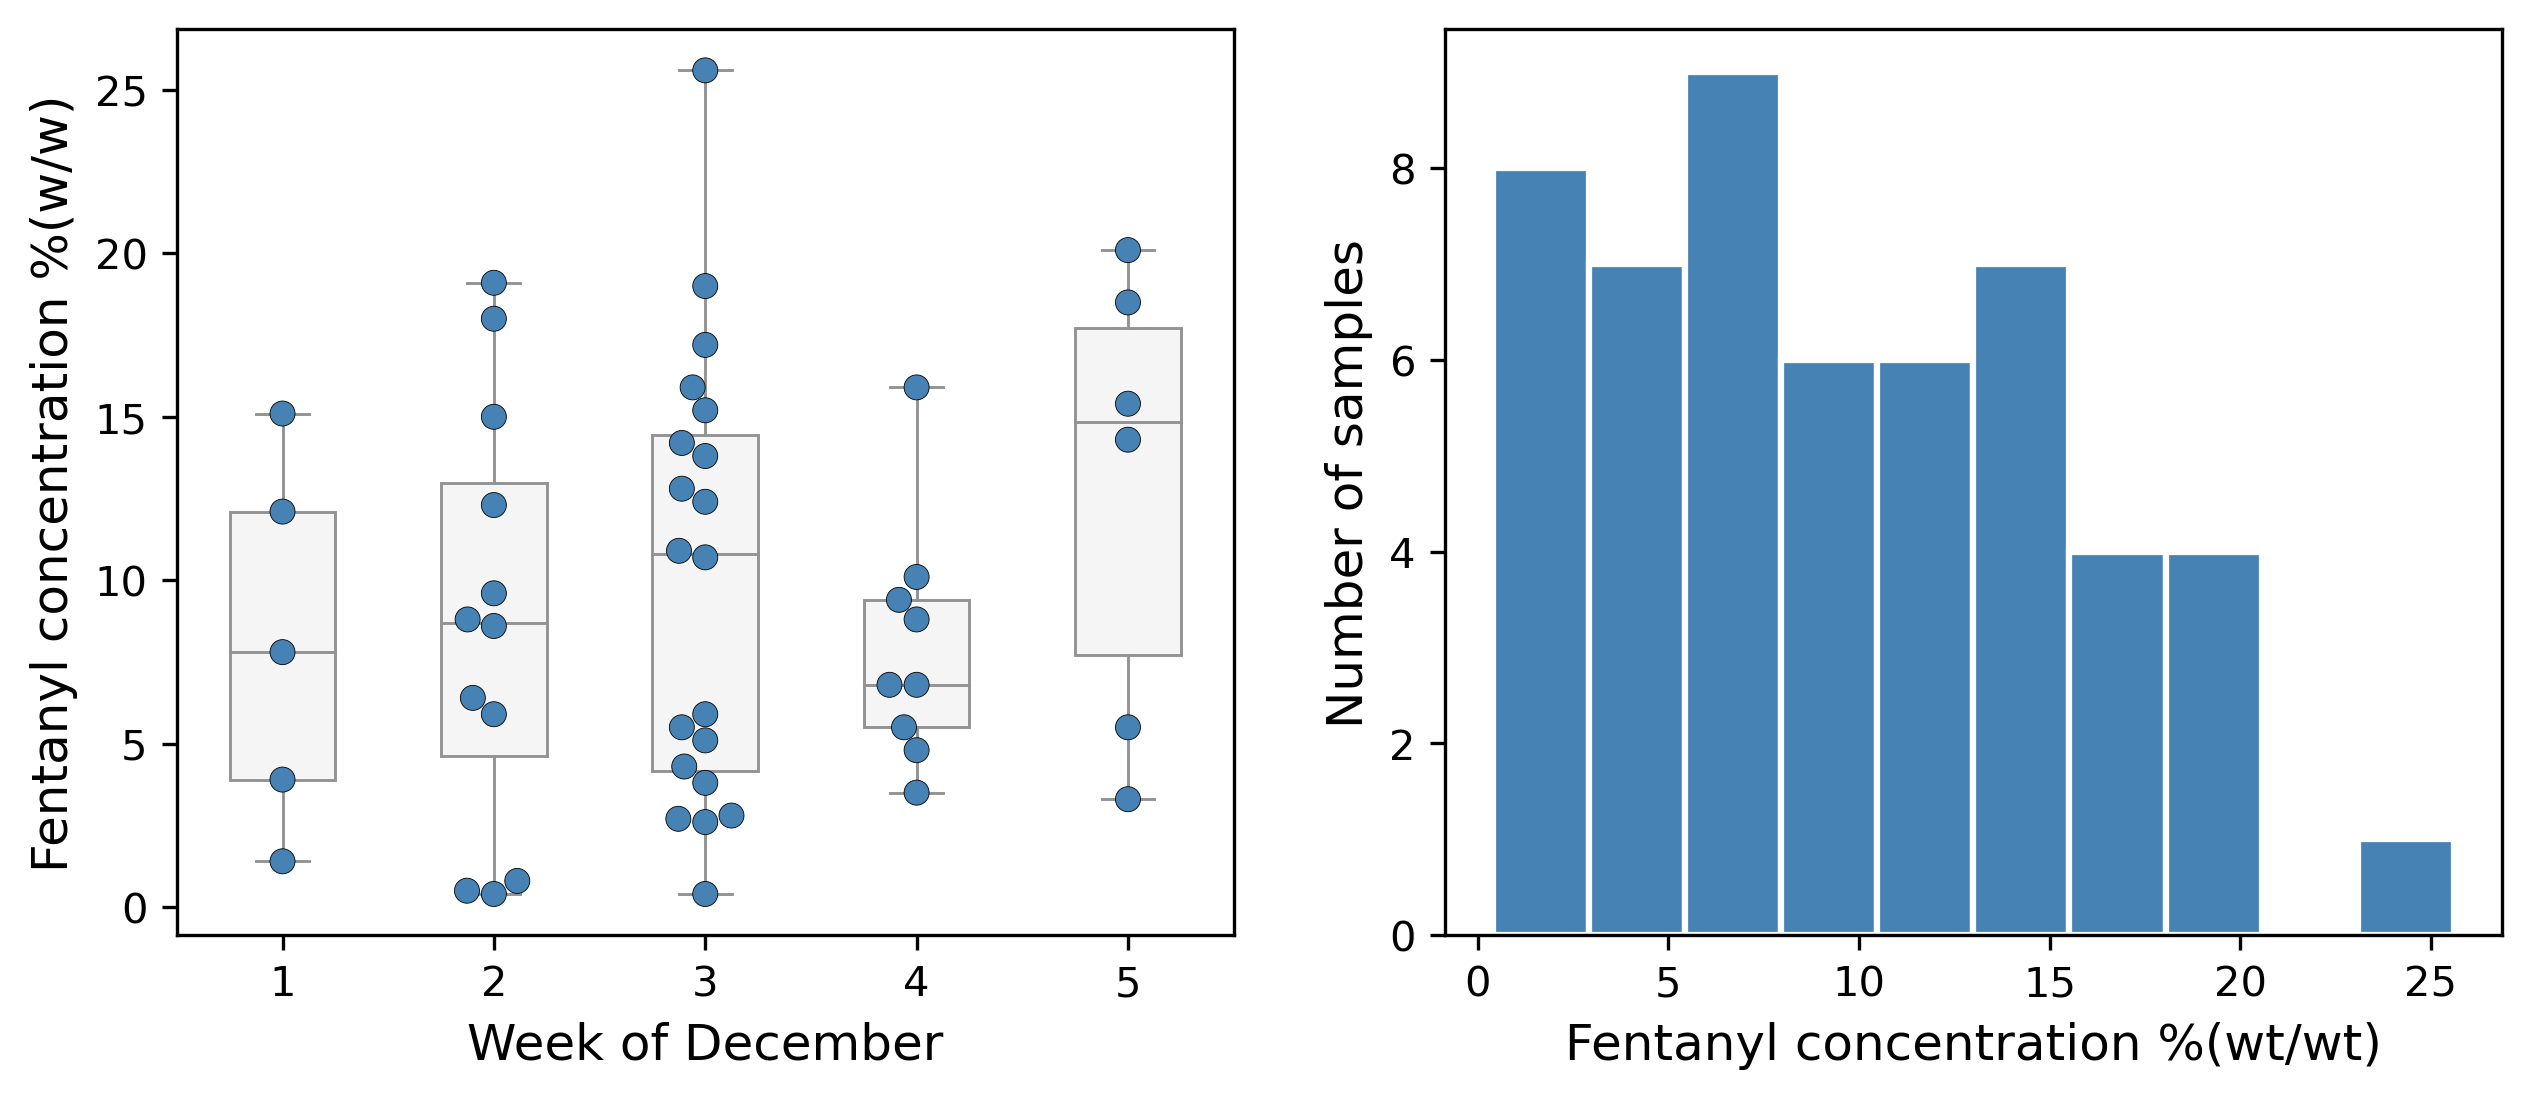
In December we quantified fentanyl for 52 of the 58 expected opioid-down samples. We found the median fentanyl concentration to be 8.8% fentanyl. Figure 3 demonstrates the spread of fentanyl concentrations in December by week (left) and for the month overall (right).
The average strength of fentanyl we see during service is around 10% fentanyl. The median concentration of 8.8% fentanyl is right at this average strength. Our findings illustrate the uncertainty in the fentanyl supply as one sample may be low strength (less than 1% fentanyl) while another may be very strong (over 25% fentanyl). Overall, 44 percent of samples were found to be above average strength (greater than 10% fentanyl).
The continued adulteration of the drug supply is consistent with the ongoing impacts of prohibition. Criminalizing drugs continues to facilitate an unpredictable and dangerous drug supply as seen in this report. This adulteration and contamination of the drug supply continues to ensure increases in overdose deaths. As a service monitoring the drug supply in Victoria B.C., we continue to call for additional measures and interventions that mitigate the unpredictability of the supply, including the expansion of harm reduction services, the provision of safer alternatives and an end to the criminalization of people who use and sell drugs.
Happy New Years! Stay safe this new year and get your drugs checked! Check back next month for the January report.
As always, send us feedback at substance@uvic.ca for how we can continue to offer our drug checking results in a useful way.