April 2023 Monthly Report

In this blog post, we discuss our April 2023 report and provide more information on how to interpret the results. The PDF report can be found at the end.
Key findings:
- The median fentanyl concentration found across all drug categories was 10.4%
- Carfentanil was found in 9 expected opioid-down samples with a median concentration of 1.13% and a maximum concentration of 5.25%
- Benzodiazepines and/or etizolam were found in 39% (184/471) of expected opioid-down samples
- Bromazolam, the most common benzo found within opioid-down, was found in 150 down samples with a median concentration of 2.9% and maximum concentration greater than 80%
- Xylazine was found in 17 samples (16 expected opioid-down, 1 “unknown”) with a median concentration of 0.3% and a maximum concentration of 25.2%
- Opioids were detected in 8 samples expected to be cocaine base (hard/crack). One sample (from Port Alberni) contained cocaine and fluorofentanyl, while the other 7 samples (x3 from Duncan, x4 from Victoria) did not contain cocaine. These seven were found to be opioid-down samples with a median fentanyl concentration of 0.7% and maximum concentration of 15.4%
Insight for the April 2023 Monthly Report
April’s showers brought flowers and drugs to Substance and the rest of Vancouver Island in a delightful introduction to spring. The Pacific polar jet stream carried rain that gave rise to beautiful fields of six-petaled, purple, and pale lilac-pigmented Camas, and as the jet stream moved across the country, it picked up some of our researchers along its path. Propelling them over the Atlantic to Scotland, our staff was greeted by a low-pressure depression that brought heavy rainfall from Portree to Pitlochry to Perth (not Perth, Australia—more on that conference below).
As a research project, one of our objectives is to establish connections with other drug checking organizations and researchers. This allows us to learn from experts in the field and share valuable insights from our project to assist others who are just starting. During a visit to Scotland, Substance researchers had the pleasure of collaborating with the fine folks at Stirling University and Crew 2000, a harm reduction organization based in Edinburgh, who have been developing drug checking services.
Discussions from Australia and the Harm Reduction International conference also sparked conversations about the benefits and harms of alerts in drug checking. We perpetually contemplate how we can best serve community members through our reporting, aiming to strike a balance between improving drug literacy, informing people about novel compounds, promoting autonomy, and uplifting the voices of those with lived experience, without contributing to the stigmatizing tsunami of alarmist rhetoric around “toxic drugs”. We have touched on these themes in previous blog posts, but as we say: “toxic drugs” are not the problem; the unregulated supply is. If there are ways you think the community can benefit from drug checking information, we are always eager for your feedback.
This blog, and the associated pdf report, breakdown our sample counts into six categories:
-
samples received through direct service provision in Victoria, where service users are bringing samples into the Substance storefront. These samples are labelled as “Substance” samples in the figures/tables of this blog post
-
samples received through direct service provision in Campbell River, where service users bring samples to the Vancouver Island Mental Health Society (VIHMS). These samples are labelled as “Campbell River”.
-
samples received through direct service provision in the Comox Valley, where service users are bringing samples to AVI Health & Community Services in Courtenay, BC. These samples are labelled as “Comox Valley”.
-
samples received through direct service provision in the Cowichan Valley, where service users bring samples to the Duncan Lookout Society OPS in Duncan, BC. These samples are labelled as “Duncan”.
-
samples received through direct service provision in Port Alberni, where service users bring samples into Port Alberni Shelter Society’s OPS. These samples are labelled as “Port Alberni”.
-
samples received through indirect service provision, where samples are collected through no-contact drop-off envelopes, are collected by harm reduction workers and other community members at supported housing sites, overdose prevention sites, and supervised consumption locations. These samples are labelled as “Outreach” samples in the figures/tables herein.
Drug types
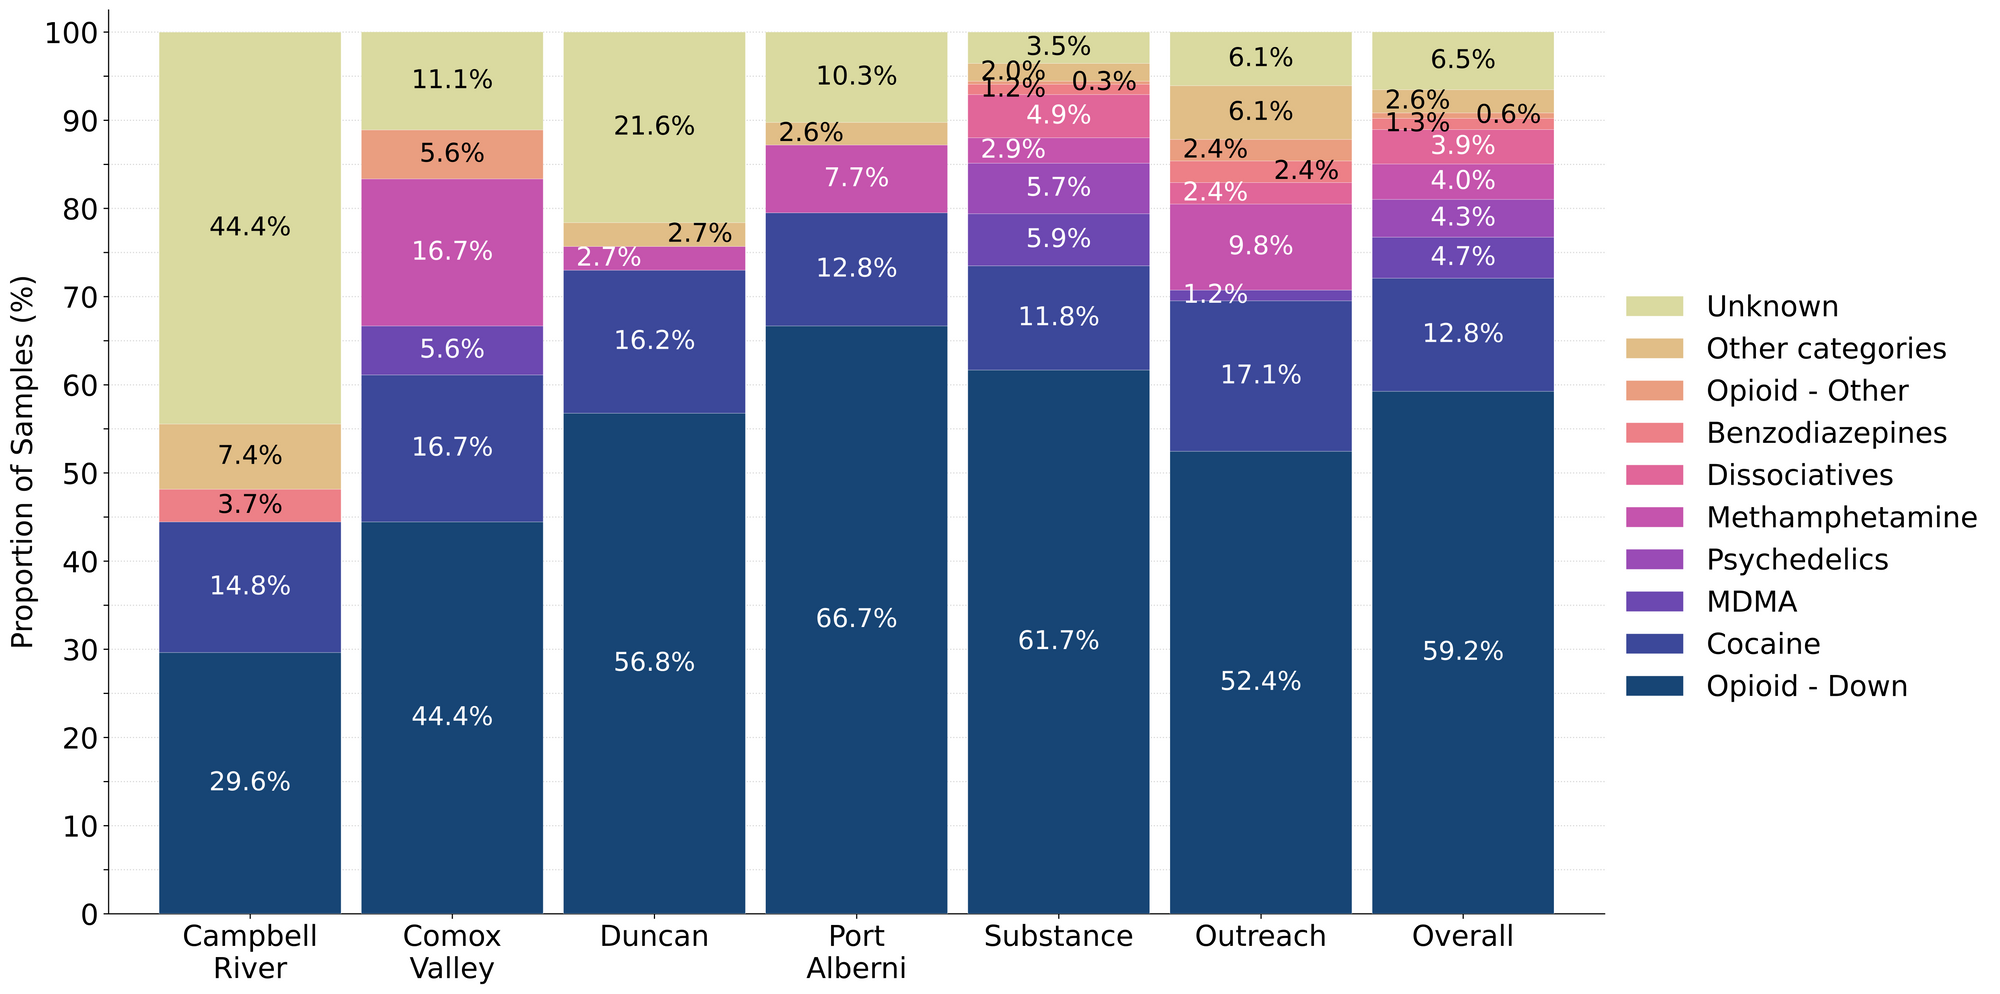
Fig. 1 shows the prevalence of each expected drug category checked, split by sample collection location/method.

April’s assortment of “as expected” analyses and additional active admixtures
For a majority of samples checked, we confirm that the expected drug was indeed the only active and that no additional active compounds were present. The bar charts below highlight a few classes of drugs, differentiating samples when only the expected active was found from situations when other unexpected active components were detected.
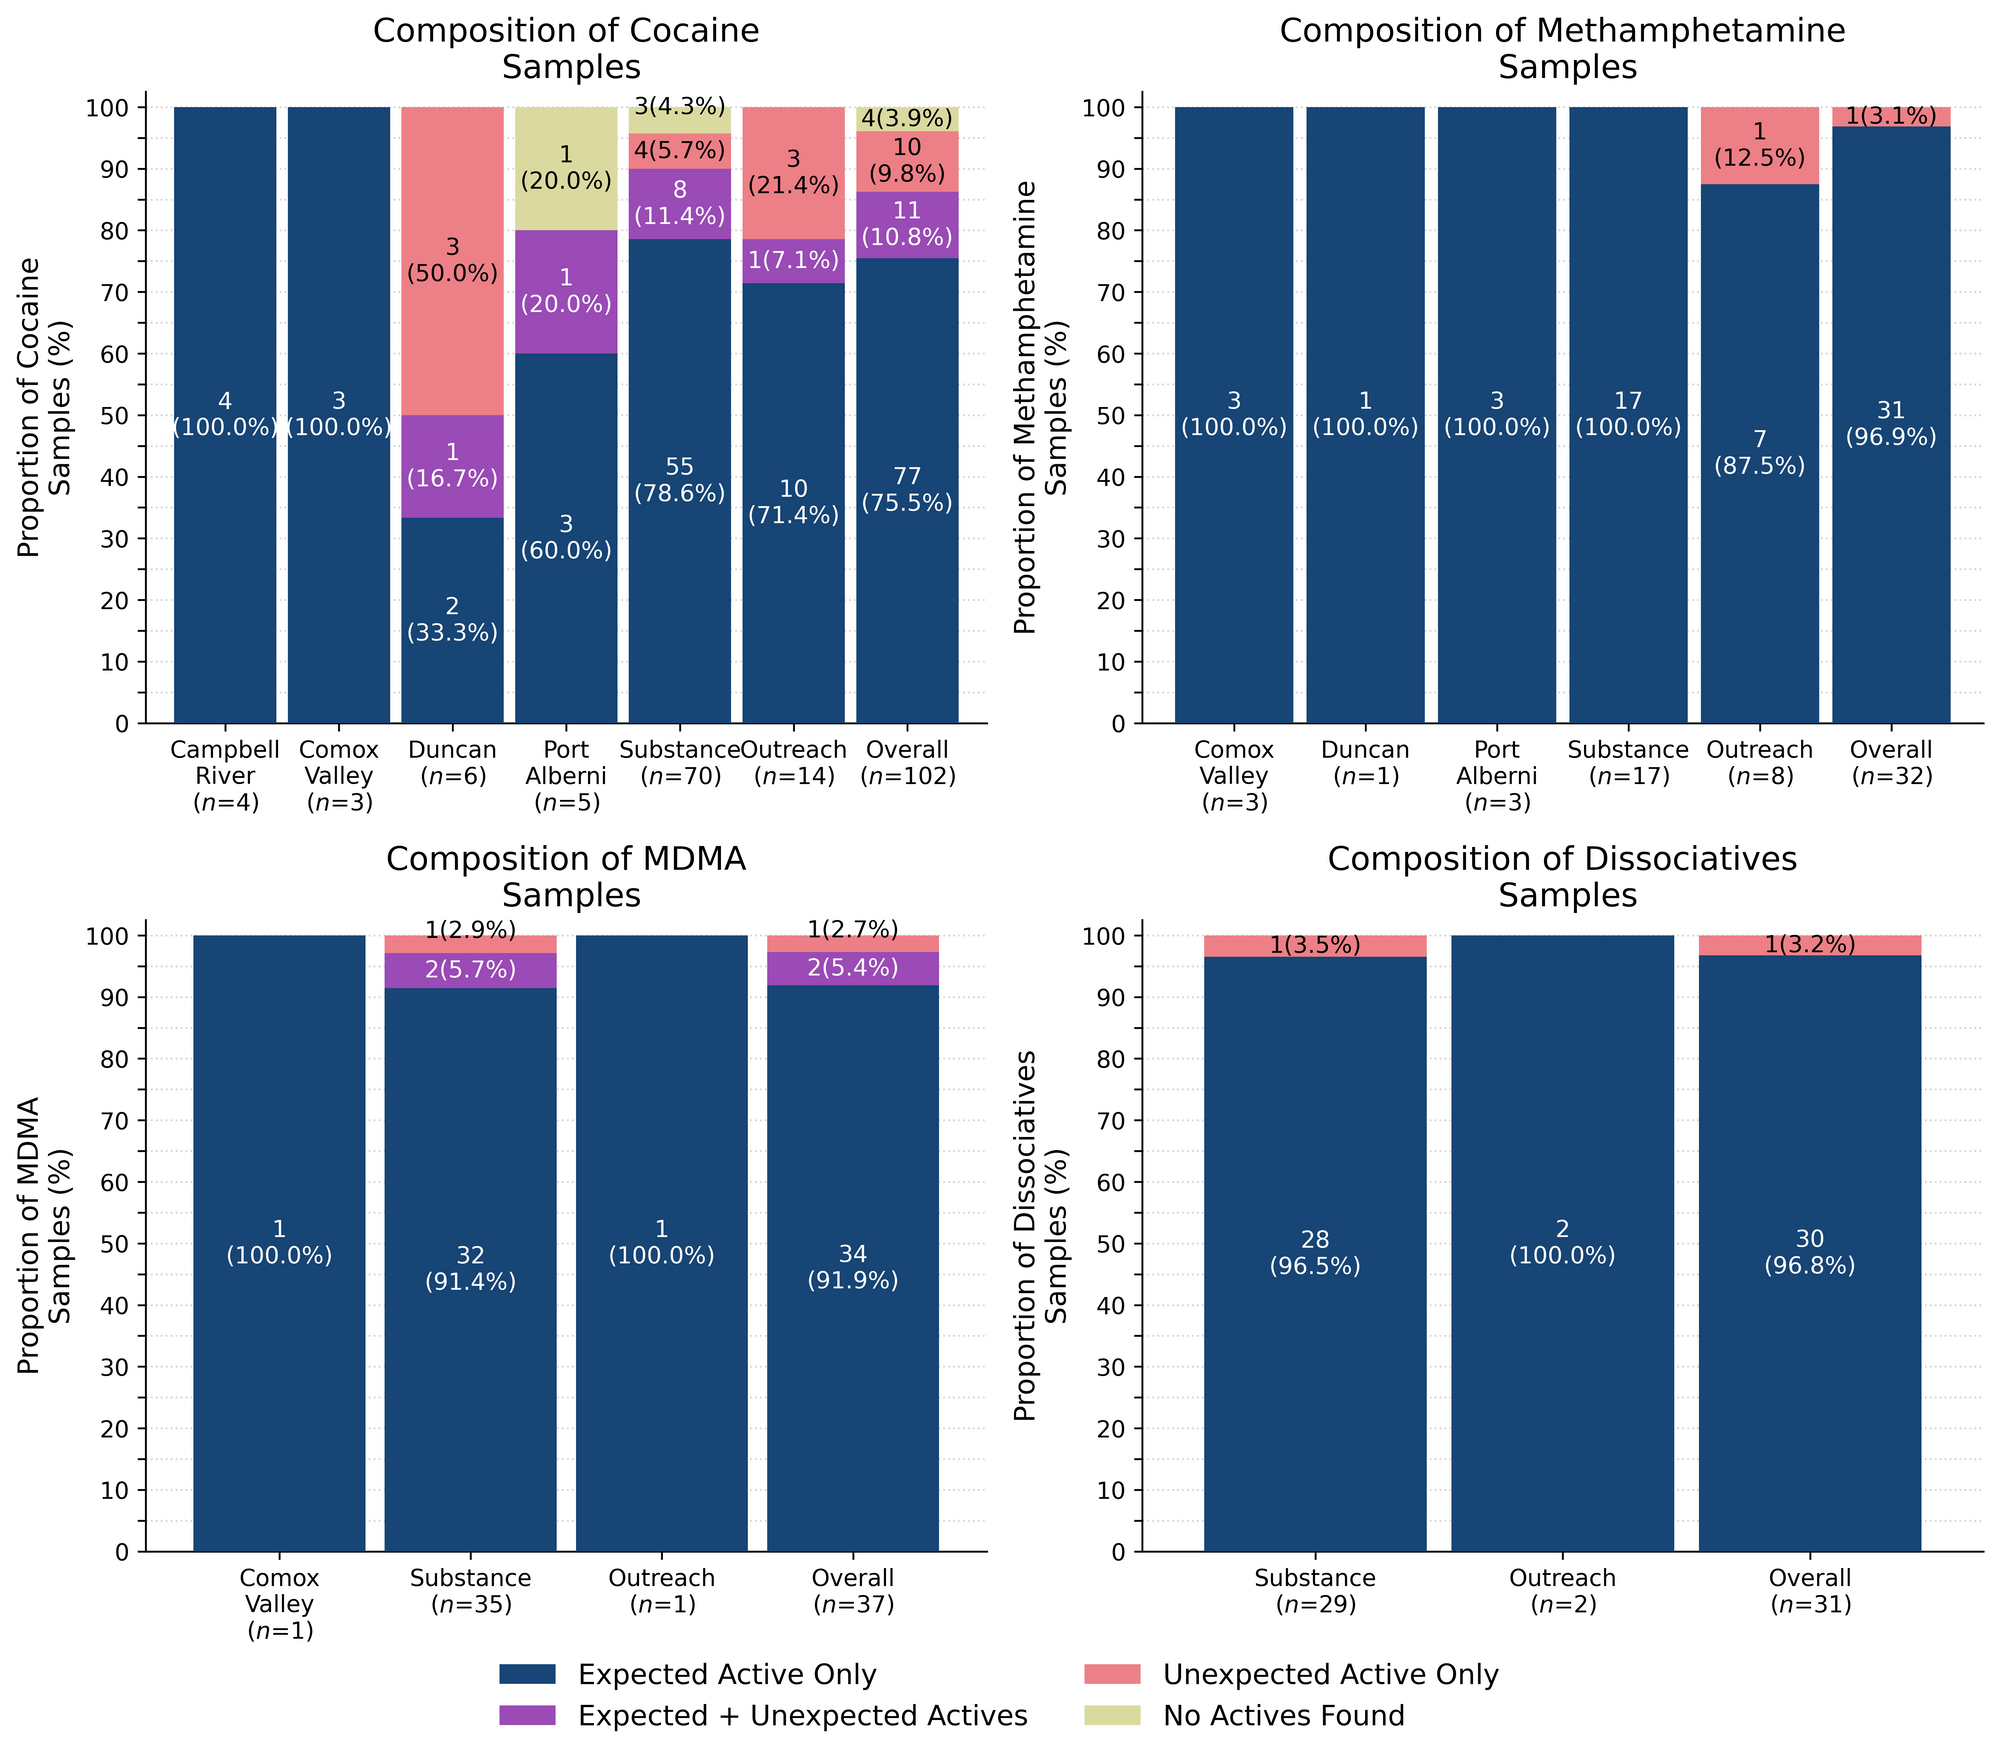
97% (31/32) of expected methamphetamine samples checked were found to be meth with no other active compounds detected. Inactive cuts were detected in two of these samples, with one sample from Victoria primarily containing meth and a minor cut of dimethyl sulfone (MSM) at around 5%, and one sample from Port Alberni primarily containing MSM (80-90%) with meth detected at 10-20%. The remaining expected methamphetamine sample contained no meth at all and instead was found to be MDA.
96% (26/27) of expected ketamine samples checked in April were confirmed to be ketamine with no other active compounds, or inactive cuts, detected. The other expected ketamine samples did not contain any ketamine and instead were found to be MDMA instead. K is K except when it is MDMA!
Rounding out the dissociative class, we also checked samples that were expected to be, and were confirmed to be 3-HO-PCP, 3-MeO-PCE, 3-MeO-PCP, and O-PCE. All four compounds are novel dissociatives structurally related to ketamine and PCP that are noted to be more potent, longer lasting, and more stimulating than ketamine. Given that these drugs are commonly dosed at around 10mg or less, that they have a steep dose-response relationship, and that many scales lack the precision/accuracy required to weigh out powders below 10mg, volumetric dosing is a suggested harm reduction strategy). If you find yourself in need of precision harm reduction equipment, swing by Substance and feel free to use our sub-milligram analytical balance to weigh your doses accurately. Additionally, we offer free volumetric syringes for all of your volumetric dosing needs.
92% (34/37) of expected MDA/MDMA samples checked were confirmed to be MDA (2 samples) and MDMA (32 samples), as expected. Tracking inactive cuts, one MDMA sample from Victoria was cut with around 50% mannitol (a sugar alcohol), and another MDMA sample from the Comox Valley was cut with glutamine (an amino acid) at around 50%.
The remaining 3 expected MDA/MDMA samples displayed a range of compositions:
- One expected MDA sample from Victoria was found to be MDMA instead
- One expected MDMA sample from Victoria was found to be a mixture of both MDA and MDMA (around 20% MDA, 80% MDMA)
- One expected MDMA sample from Victoria was found to be a mixture of MDMA and 2% MDEA. MDEA (MDE/“Eve”) is reported to be less potent and less stimulating than MDMA but generally produces similar effects
76% (77/102) of expected cocaine samples (62 cocaine HCl/soft, 15 cocaine base/hard/crack) checked were confirmed to be cocaine with no additional actives detected. Only one of these samples was found to contain an inactive cutting agent, with baking soda detected at 45% by weight in a cocaine base sample from Port Alberni.
11 samples contained an active component in addition to cocaine:
- Benzocaine - Three samples (x1 Duncan, x2 Victoria); a local anesthetic/numbing agent
- The sample from Duncan also contained phenacetin
- Ketamine - Three samples (all from Victoria)
- These samples were found to be 50/50 cocaine HCl / ketamine with levamisole detected at 0.2% in two of the three samples as well
- Levamisole - Five samples (x4 Victoria, x1 Outreach); an antihelminthic drug used to treat parasitic worm infections, commonly seen as a cut in cocaine
- Phenacetin - Two samples (x1 Duncani, x1 Victoria); “super buff” a tylenol-like drug, commonly seen as a cut in cocaine
10 expected cocaine samples did not contain any cocaine and instead were found to be:
- Ketamine - Three samples (Victoria); all were expected to be cocaine HCl
- “Down” - Seven samples; all were expected to be cocaine base:
- Duncan
- Fentanyl (0.6%), Caffeine - this sample was a sticky, hard pebble that was sold as cocaine base and was reported to not feel like cocaine
- Fentanyl (0.5%), Bromazolam (3%), Caffeine - this sample was a sticky rock with pink specks that was sold as cocaine base
- Fentanyl (0.7%), Bromazolam (4%), Procaine (0.1%), Caffeine - this sample was another sticky rock that was sold as cocaine base
- Victoria
- Fentanyl (15%), Caffeine, Erythritol - this sample was a hard, off-white chunk that was sold as cocaine base and was reported to “not feel like rock”
- Outreach
- Fentanyl (0.3%), Fluorofentanyl (12%), Caffeine - this sample was a white powder and had not been tried
- Fentanyl (15%), Fluorofentanyl (0.5%), Caffeine - this sample was a clumpy light yellow powder and had not been tried
- Fentanyl (9%), Bromazolam (0.2%), Caffeine - this sample was a light brown chunk that was reported to have felt “much weaker than expected” and had no cocaine effect
- Duncan
Two expected cocaine samples did not contain cocaine or any other active drugs: A sample from Port Alberni was found to be lactose, and a sample from Victoria was found to be baking soda. The remaining two samples were baggie residue too sparse for any tests beyond the fentanyl strip tests (which were both negative).
Benzodiazepines (n=10)
70% (7/10) of the expected benzodiazepine samples checked in April came to our service sites in the form of pressed pills with the following expected and detected compositions:

Within the remaining three samples:
- One sample from Victoria was a white blotter paper confirmed to contain fluclotizolam, as expected
- One sample from Victoria was a light peach powder that was found to primarily be bromazolam. Fentanyl was detected at 2% as well. The expected benzo was not known.
- One sample from Victoria was a white granular powder that was found to be a sugar pill with no benzos detected. The expected benzo was not known.
Opioid-Down (n=471)
In this section we present results specific to the opioid-down supply, therefore they may differ from the highlighted findings above that are inclusive of all expected drug categories.
- 81% of expected opioid-down samples contained fentanyl (383/471)
- Eleven samples contained heroin (2.3% of expected opioid-down samples)
- Seven samples from Victoria were just heroin (and related alkaloids like acetylmorphine (MAM) and acetylcodeine) and cutting agents like caffeine or sugar
- Four samples contained heroin with the additional actives or adulterants fentanyl and fluorofentanyl
- 58% of expected opioid-down samples contained fluorofentanyl (274/471)
- Nine samples contained carfentanil (2% of all opioid-down samples)
- Three were checked in Campbell River (38% of opioid-down samples checked in Campbell River)
- Two from the Comox Valley (10% of opioid-down samples checked in the Comox Valley)
- Two from Port Alberni (8% of opioid-down samples checked in Port Alberni)
- Two from Substance (1% of opioid-down samples checked at Substance)
- 39% of expected opioid-down samples contained a benzodiazepine and/or etizolam (184/471)
- Xylazine was detected in 3% (16/471) of opioid-down samples
In April, 68% (318/471) of all opioid-down samples checked contained an additional active to the expected fentanyl/heroin. These data are shown in Fig. 3 highlighting the prevalence of benzos, fluorofentanyl, and xylazine in the down supply.
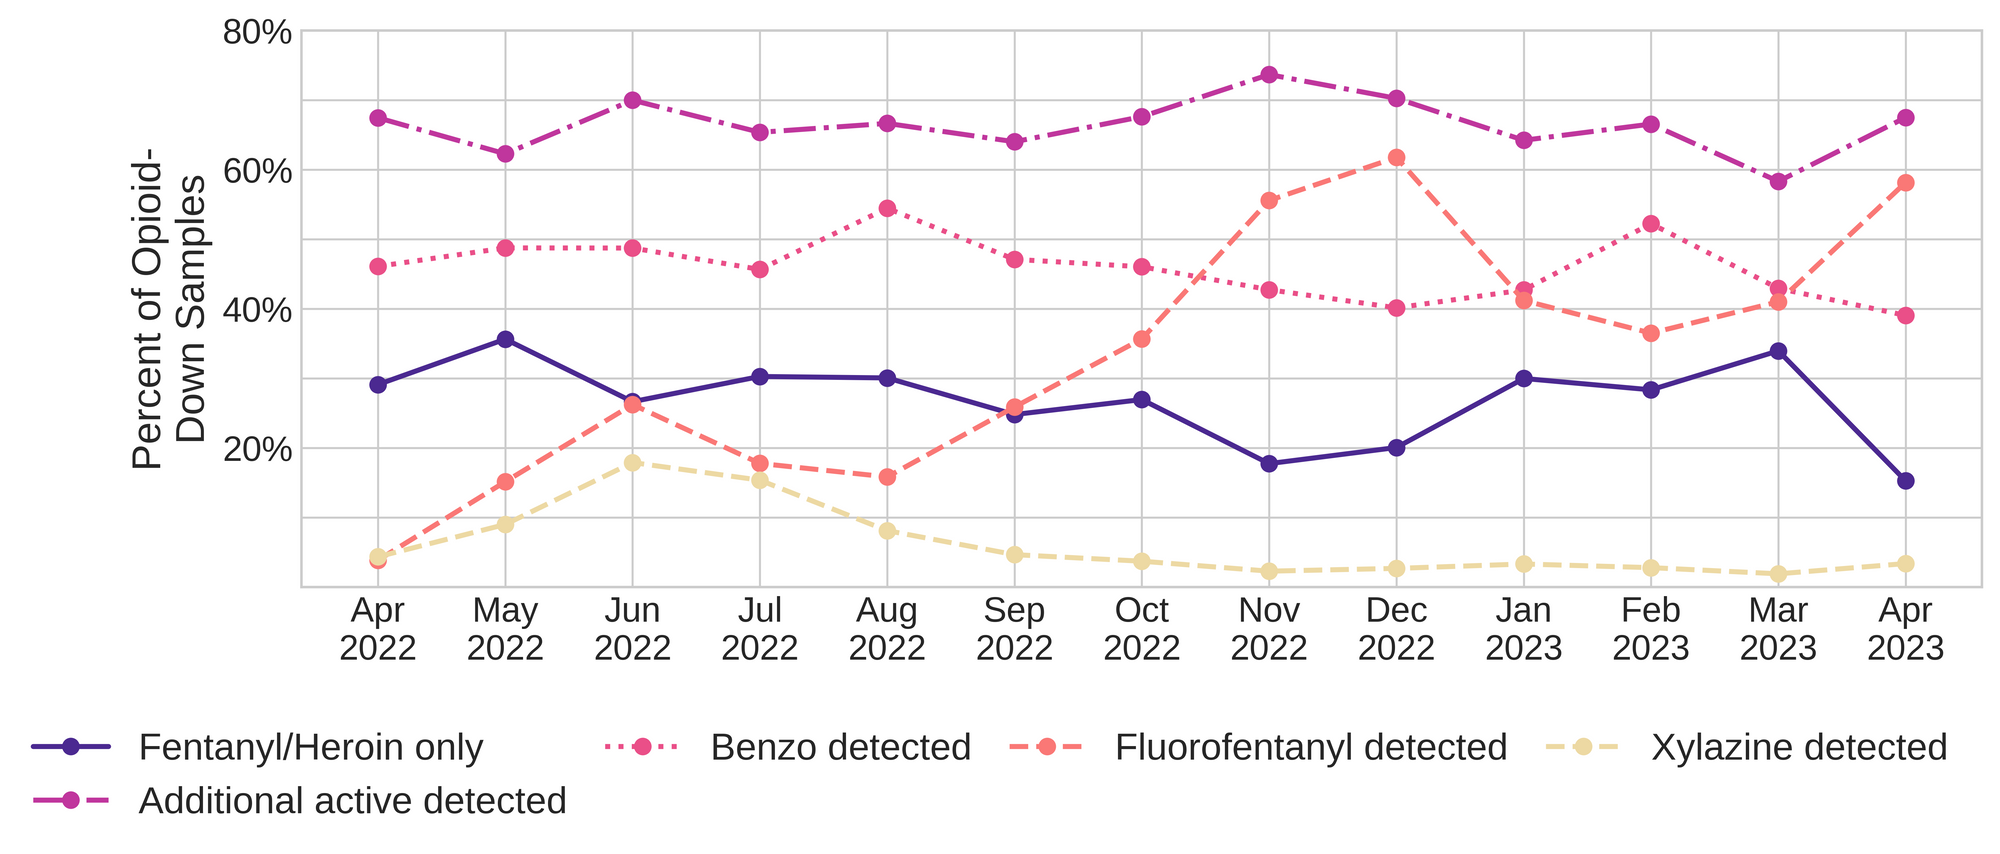
Fluorofentanyl was the most common additional active found within the opioid-down supply, with 46% (219/471) of opioid-down samples containing fluorofentanyl in addition to fentanyl. Additionally, fluorofentanyl was the only opioid detected in 6% (55/471) of opioid-down samples (i.e. no fentanyl or heroin was detected in these samples).
Benzo-related drugs contribute to a majority of the other additional actives found in expected opioid-down samples, with 39% (184/471) of expected opioid-down samples checked containing a benzo-related drug. Bromazolam continues to be the most common benzo seen in the down supply, with bromazolam being detected in 84% (153/184) of the benzo-positive opioid-down samples. Scattered detections of other drugs are still found and can be reviewed in the pdf report at the end of this blog.
Quantification for Expected Opioid-Down[1]
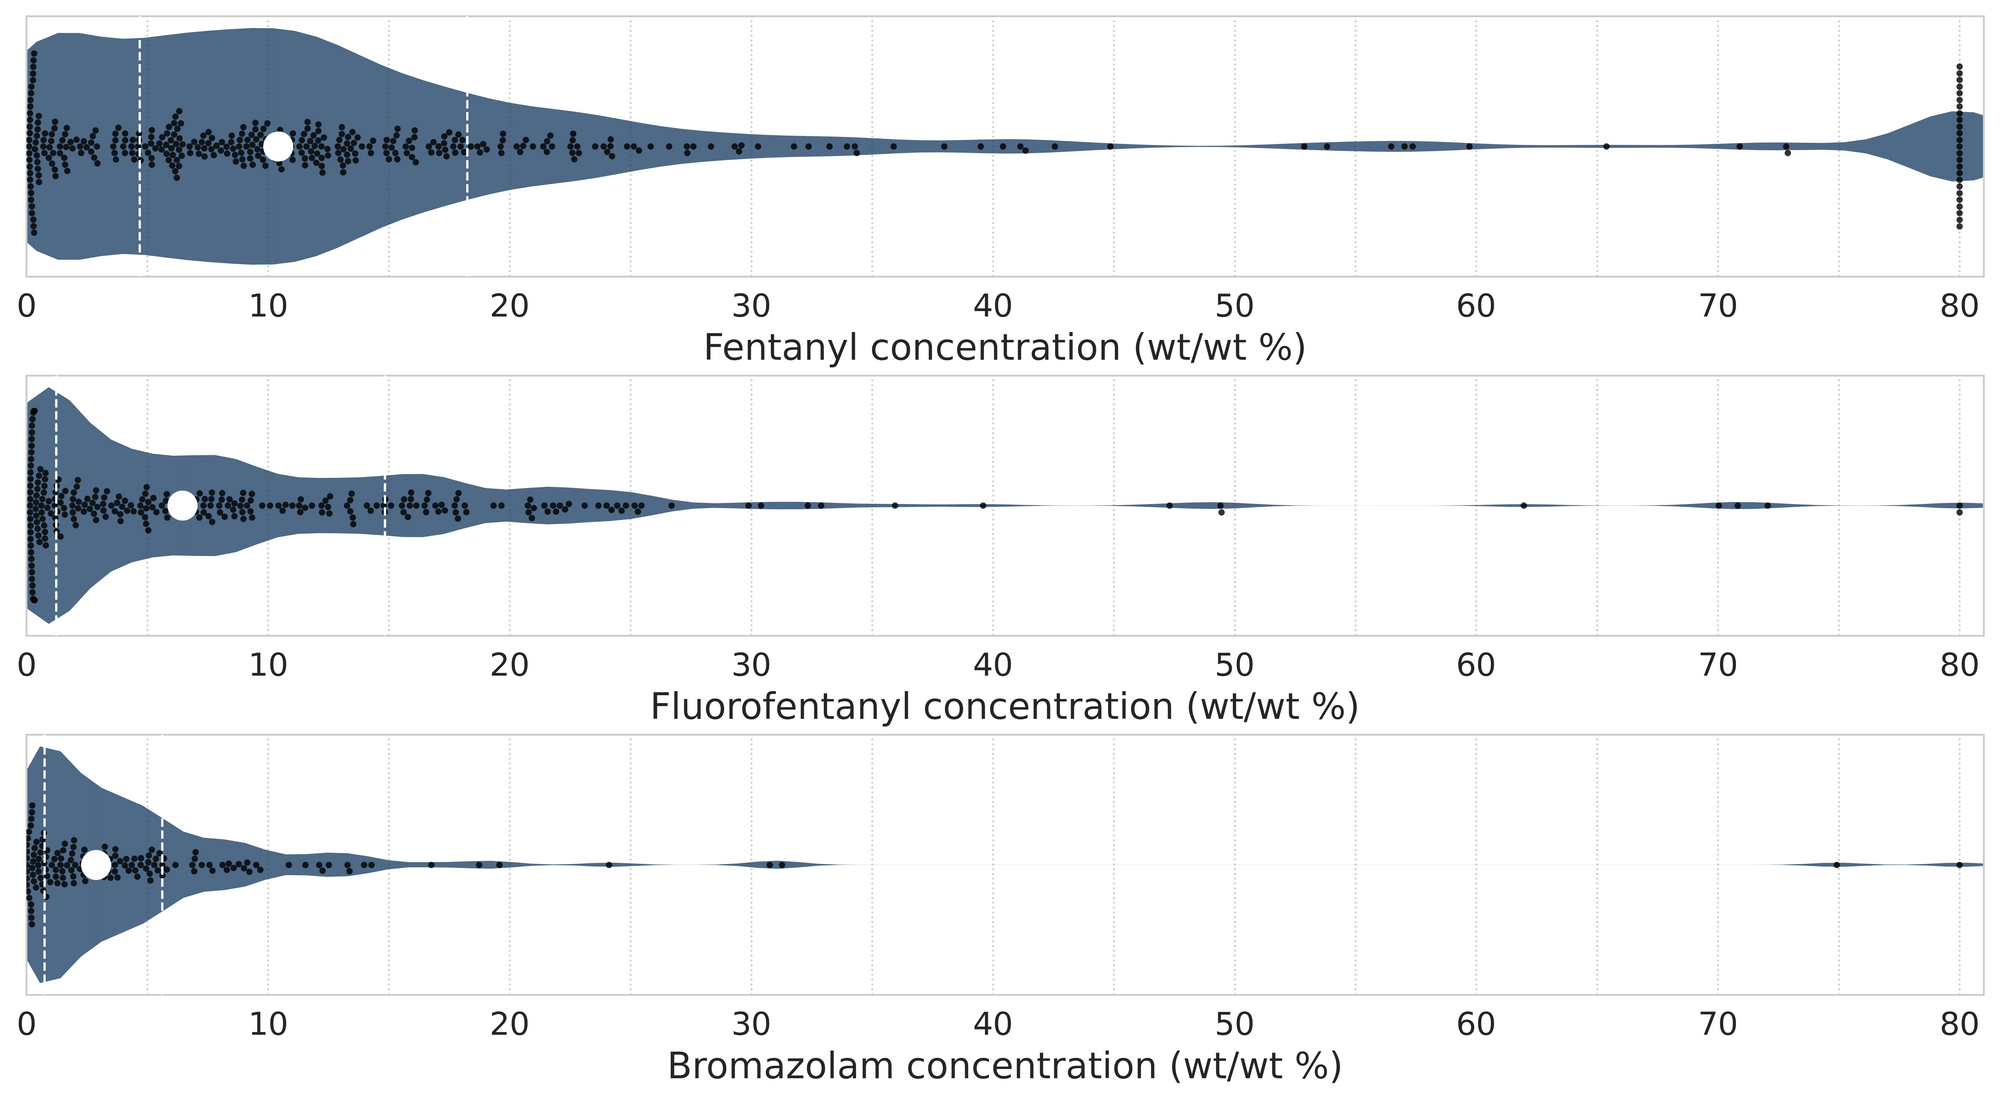
In April, we quantified fentanyl for 375 of the expected opioid-down samples containing fentanyl and found the median concentration to be 10.4%[2]. Though the median is a useful indicator, it doesn’t capture the volatility of fentanyl concentrations present in the opioid supply, as half of fentanyl-positive down samples contained between 4.7% and 18.2% fentanyl, and any one sample might be the lowest strength (0.1%) or the strongest (>80%[3]). Similarly, the concentration of bromazolam was across the board in expected opioid down samples, with samples ranging from 0.1% to >80% bromazolam, with a median of 2.9%.
Not all opioid down samples brought to our service can be quantified. This is primarily due to too limited sample collected for our instruments to report a reliable mass percentage. Nevertheless, qualitative detection is still possible. ↩︎
This number is specific to fentanyl quantified in opioid-down samples. The median concentration listed in the Key Findings at the beginning of this blog (10.3%) is inclusive of all samples checked, across all drug classes, that contained fentanyl. ↩︎
For samples that contain more than 80% fentanyl, or more than 25% etizolam by weight, our mass spectrometer is presently unable to reproducibly assign a concentration due to the upper limits of the calibration methods currently adopted. ↩︎

The fentanyl, fluorofentanyl, and bromazolam concentrations that we quantified in April, across all expected drug categories and service models, are presented in Fig. 4. Small black dots are individual opioid-down samples, the large white dot shows the median concentration, dashed white lines bound half of the quantified samples, and the width of the shaded regions mirrors the number of samples at a given concentration.
We can also examine the regional variability in the unregulated market. The table below expands on the quantitative data presented above. It focuses only on fentanyl, fluorofentanyl, carfentanil, bromazolam, and xylazine quantified within expected opioid-down samples, separated by collection location/model. Weight percentage is reported; “IQR” is the interquartile range: the range that contains half of the quantified samples.

Want to be notified when we release these reports? Join our mailing list to receive updates about when our reports are out. You can subscribe and unsubscribe yourself from this list at any time.
As always, send us feedback at substance@uvic.ca on how we can continue to offer our drug checking results in a useful way.