2025 Annual Report


Highlighted Findings
- 55.8% (4183/7502) of samples checked were confirmed to contain their expected active only with no other notable compounds detected.
- Samples expected to be benzodiazepines showed the highest level of misrepresentation, with 46.3% (199/430) of benzo samples containing an unexpected active. The least misrepresented samples were cocaine samples, with 90.5% (1021/1128) of samples containing the expected active component.
- Fentanyl continues to be the most common opioid found within the opioid–down supply, with 73.4% (1790/2407) of down samples containing fentanyl across all service locations on Vancouver Island. The median fentanyl concentration in opioid–down samples checked during 2025 was 8.7%.
- Fluorofentanyl prevalence in the opioid–down supply fluctuated between 20.1% and 66.9% between the months of January 2025 and December 2025. Throughout all of 2025, fluorofentanyl was found in 47.2% (1136/2407) of opioid–down samples with a median concentration of 5.5%.
- Ortho-Methyl fentanyl, which began appearing in opioid–down samples during 2024, waned in prevalence during 2025. This fentanyl analogues monthly prevalence fluctuated between 1.0% and 25%. Overall, ortho-methyl fentanyl was found in 11.1% (267/2407) of opioid–down samples with a median concentration of 1.6%.
- Benzodiazepines were detected in 41.5% (1000/2407) of opioid–down samples checked in 2025. Bromazolam remained the most common benzodiazepine adulterant detected in 2025, comprising 63.6% (636/1000) of benzodiazepines detected in opioid–down samples.
- “Tranq,” referring to the substances xylazine and medetomidine, was found in 10.5% (253/2407) of opioid–down samples during 2025. Medetomidine was found in 161 samples at a median concentration of 1.0%. Xylazine was found in 103 samples at a median concentration of 0.6%.
- Outside of opioid–down samples, unexpected opioids were found most frequently in samples expected to be opioid–other (17.7%), benzodiazepines (7.2%), and methamphetamine (5.8%).
- Unexpected opioids were detected in 17 (1.5%) cocaine samples, 3 (0.3%) MDMA samples, and 11 (2.0%) other samples. No unexpected opioids were found in samples expected to be dissociatives or psychedelics.
Land Acknowledgement
Our project works on Indigenous land. We provide drug checking, harm reduction education and support across many territories on what is colonially known as Vancouver Island. We also act as a resource for these services across the province colonially known as British Columbia. We honour and offer respect to many Nations for their stewardship, care and leadership on these lands.
Our project originated on the territories of the lək̓ʷəŋən speaking Peoples, including the Songhees and Xwsepsum (Esquimalt) Nations, and the W̱SÁNEĆ (Saanich) Nations on whose land the University of Victoria is located. Some of the territories we are honoured to work across specifically include: Halalt, Lyackson, Meluxulh (Malahat), Puneluxutth’, Quw’utsun, Stz-uminus, and Ts’uubaa-asatx; Hupačasath and Tseshaht; K’ómoks; Laich-kwil-tach; and Gwa’Sala-’Nakwaxda’xw.
We acknowledge the inextricable links between research, colonization and racism against Indigenous Peoples, which continue to this date. Ending the violence faced by people who use drugs cannot be achieved without actively working on decolonization. We also recognize that as the majority of our staff are not Indigenous there is much more work for us to do to challenge the settler lens and colonial framework. This includes learning and growing relationships in order to take an anti-colonial and inclusive approach to the work we do.

Narrative Report
In 2025, our service offered vitally important information throughout the community of so-called Victoria, the larger geographic region of so-called Vancouver Island, and within the province of British Columbia. In the ninth year of the overdose crisis fueled by an erratic and inconsistent unregulated drug supply, drug checking remains one of many vital community defenses against further loss of life due to drug toxicity.
Our main point-of-care site located within the North Park community of Victoria continues to operate. All walks of life are welcome in this space to learn about their substances via a world-class suite of instruments. We also receive samples that arrive by mail and through outreach conducted by Substance staff and partner organizations. We also continue to receive samples for confirmatory analysis from our distributed sites on Vancouver Island and from several sites across the province in partnership with the British Columbia Centre on Substance Use (BCCSU).
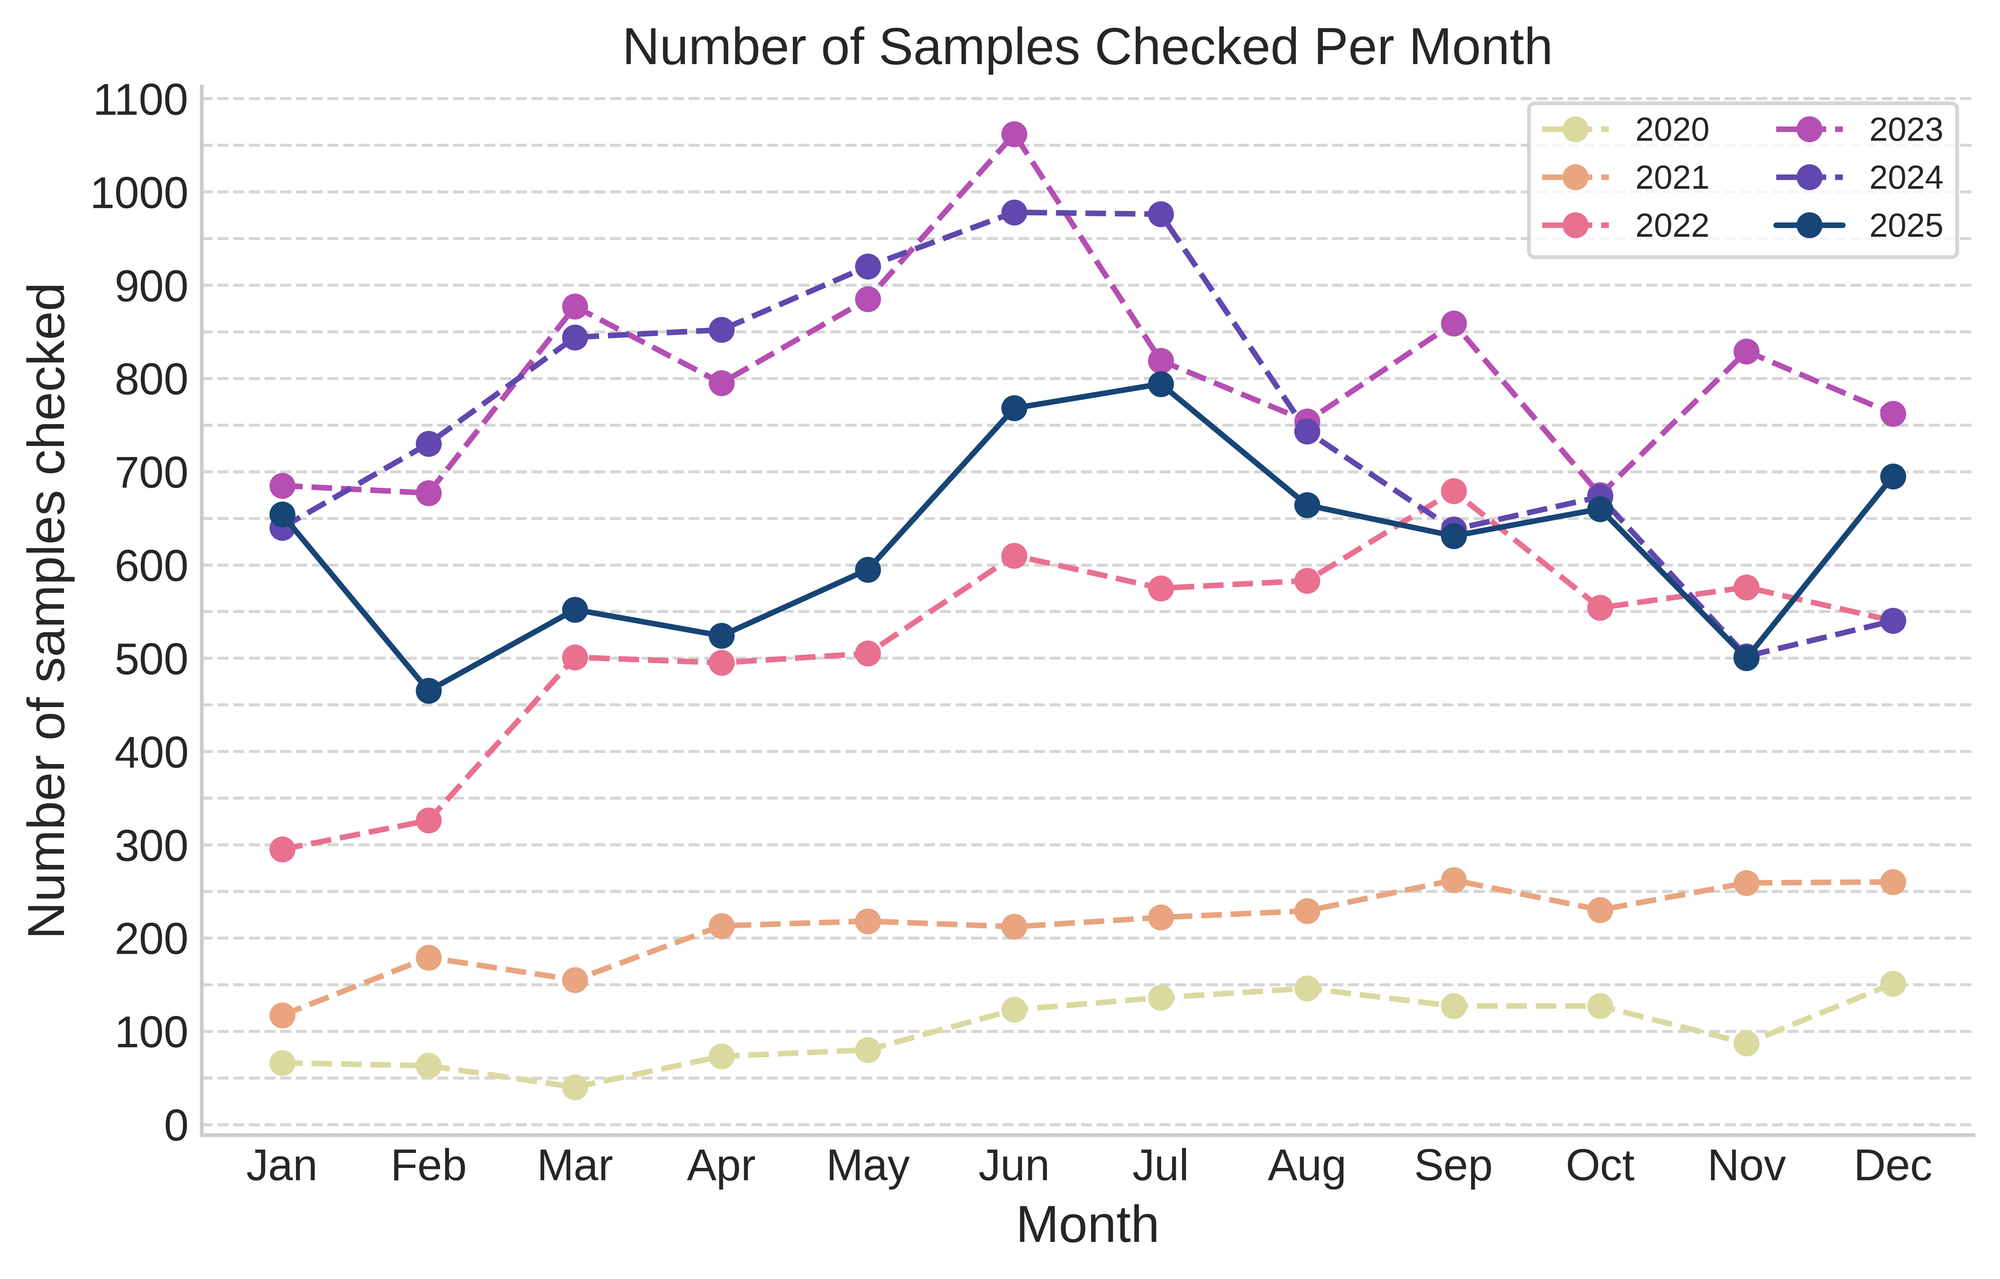
Our busiest month this year was July, where we checked 794 samples, these samples came from our point-of-care service, in addition to our distributed sites and outreach program. During each month of 2025 we not only checked samples from our own sites but also provided confirmatory analysis in partnership with the BCCSU, providing mass spectrometry for 3183 samples during this year. The figure below shows the total number of Substance samples we checked each month, with the solid blue line showing data for 2025.
Sample Volumes Per Service Location
This year we continued to provide confirmatory analysis via paper spray mass spectrometry to our distributed sites located in overdose prevention sites operated by the Port Alberni Shelter Society, the Vancouver Island Mental Health Society in Campbell River, Lookout Housing and Health Society in Duncan, Island Health Mental Health and Substance Use in Port Hardy, and AVI Health and Community Services in the Comox Valley and Campbell River. As part of a new partnership, we also provided our distributed drug checking services to the Nuu-chah-nulth Tribal Council, these samples are labelled as Port Alberni samples in the figures/tables henceforth.
A majority of service locations this year saw a decrease in sample volumes. Overall, we observed a 17% decrease in sample volumes compared to 2024. At our point-of-care site in Victoria, walk-in sample volumes decreased by 24.5%, with the largest drop in overall sample volumes being observed within the opioid–down class of samples.
The exceptions to the overall decrease in sample volumes we observed this year occurred at our services located in Port Alberni and our Outreach service. The increase in sample volumes observed within Port Alberni is likely due to our new partnership with the Nuu-chah-nulth Tribal Council, which provides another location to access drug checking within the Alberni–Clayoquot region. Here in so-called Victoria our outreach program collects samples from various housing and supervised consumption sites (SCS), additonally, samples checked at various events and festivals are also labelled as Outreach.
One goal of our outreach program is to help more people access drug checking, another goal is to create and nurture connections with community members and staff from other organizations. Housing and SCS outreach, in addition to festival drug checking, discussed on page 8 of the PDF report, help us to reach new and returning service users. While our housing and SCS outreach route maintains our connections with other organizations by sharing information about the local drug supply through our weekly reports (which were redesigned last year based on community feedback). Furthermore, our monthly reports, blog posts, and other resources made or maintained by Substance, such as drug pamphlets and benzo equivalency charts, also help harm reduction information reach all types of people.

What were people bringing to get checked?
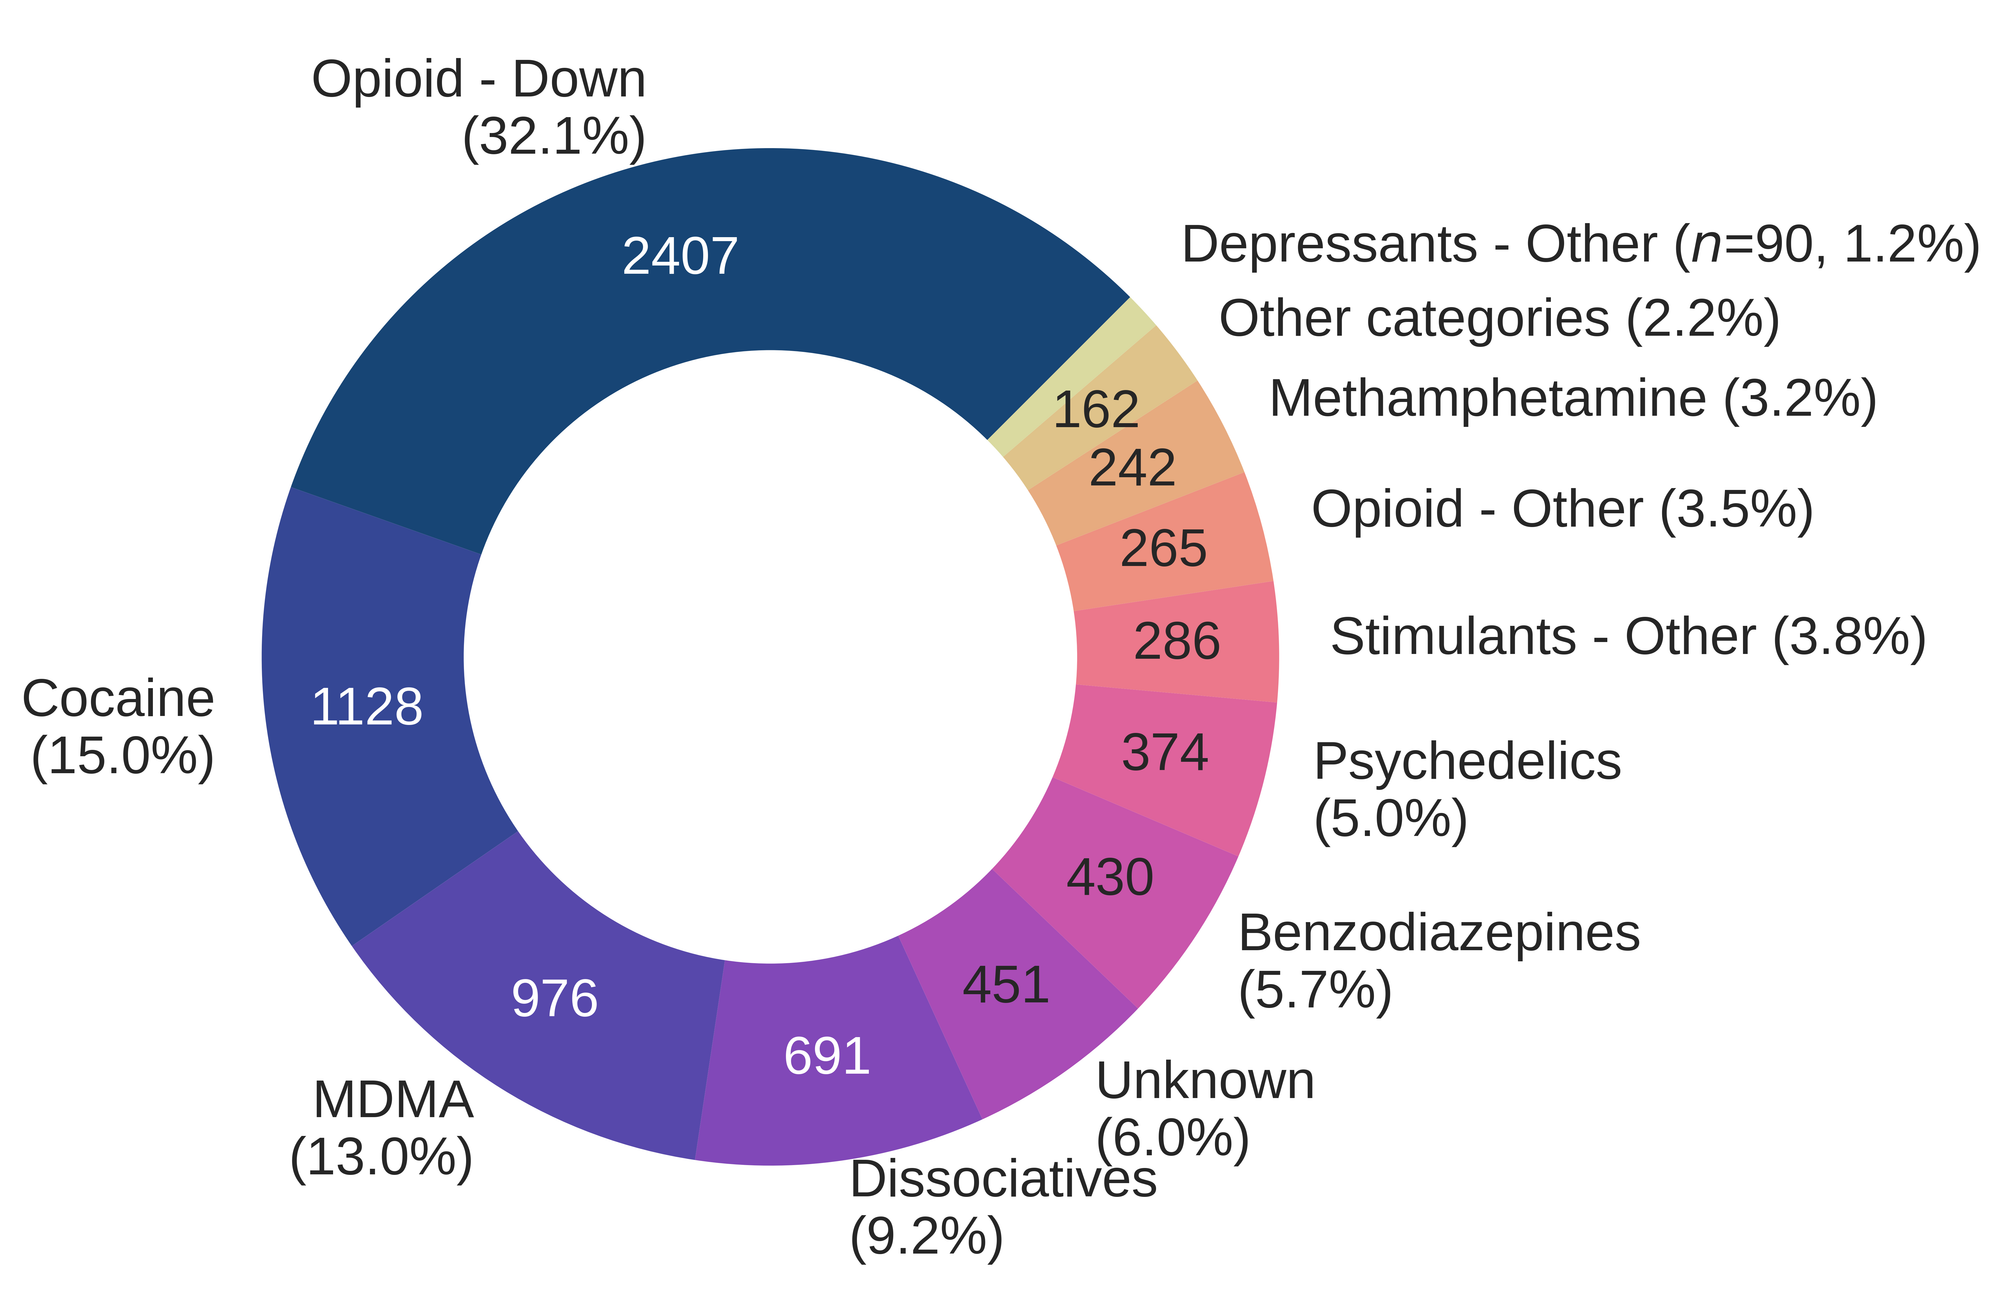
A wide variety of different people bring us a wide variety of substances, which can be grouped into different drug classes. The donut chart shown below aggregates the total number of samples we checked by their expected drug class (i.e. the drug category reported by the service user), inclusive of all service locations. The consistent use of drug checking for a diverse range of drug categories, throughout the entire year, and across the island, demonstrates the continued need for both universal and population-targeted approaches to drug checking services and the accessibility of services.
How did drug checking usage change between 2024 and 2025?
When compared to 2024, we observed changes in the number of samples we checked across many drug classes, shown in the table below. Most notably we observed a decrease in expected opioid–down samples, the class of samples which we check most often, by -33.9% when compared with 2024. A decline of this magnitude also affected expected unknown samples, which changed by a similar -35.1%. Most other drug classes also showed decreases between 2024 and 2025. However, we checked an increased number of samples expected to be dissociatives, benzodiazepines, Stimulant—other, Opioid–other, other categories.
Most notably the number of Stimulant—Other samples we checked increased by 95.9%, which can largely be attributed to a 300% increase in the number of 4-MMC (Mephedrone) samples we checked this year. Benzodiazepines were another category we checked more often in 2025, showing an increase of +19.8%. Within the benzodiazepine class, we noted a +100% increase in the number of unique expected compounds. In other words, we checked a broader range of drugs categorized as benzodiazepines.

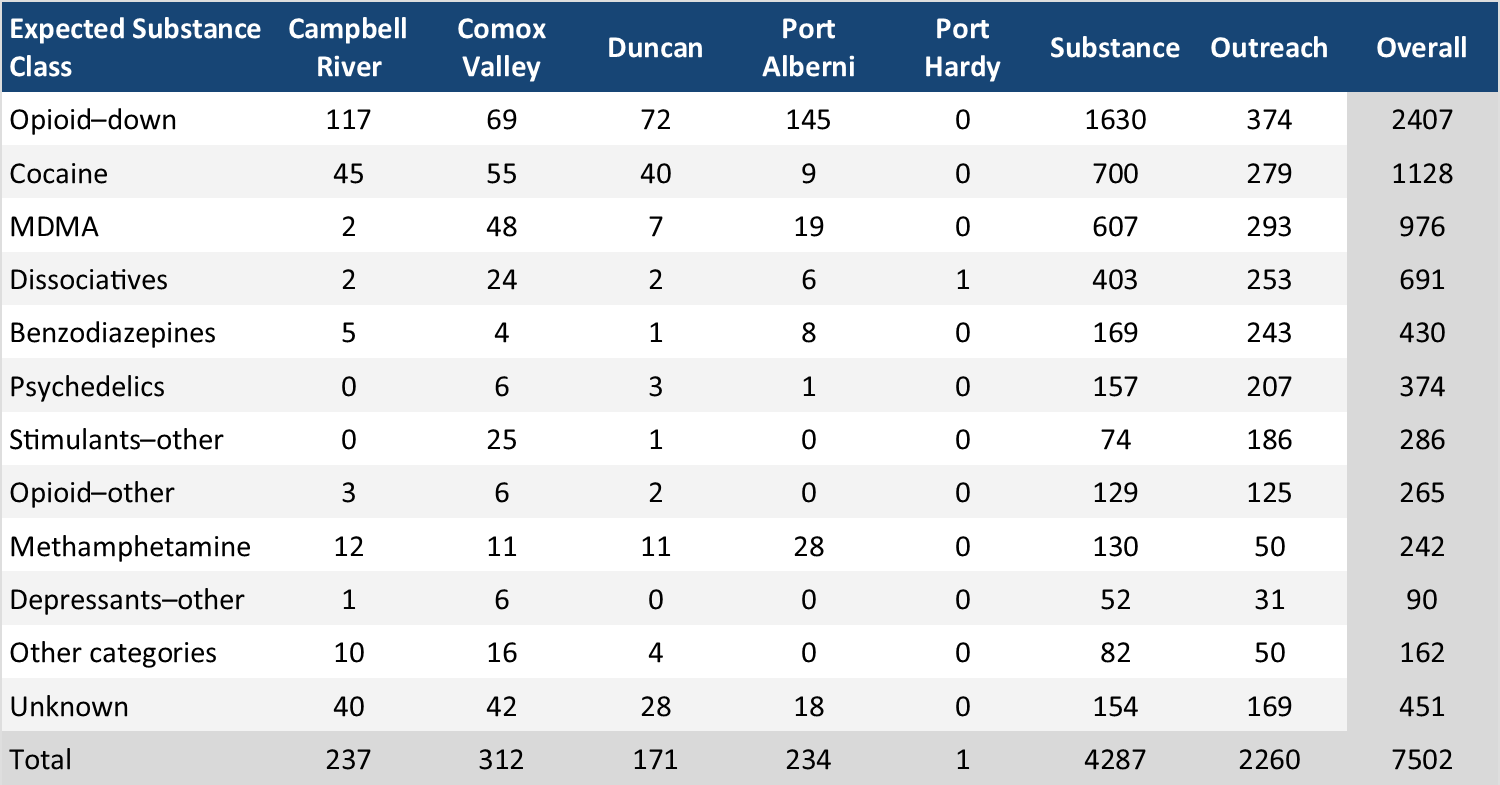
What were people getting checked by location?
The expected substance data presented in the previous sections can be separated by sample collection location/method. Each site shows its own unique proportion of the types of samples checked, and these differences are based partially on the type of site that is offering drug checking (OPS vs. storefront), on community engagement with the service, and on the regional markets overall. Regardless of the type of service offering drug checking, all classes of drugs are checked on Vancouver Island. The following figure shows the proportion of samples checked at each location by their expected drug class, while the following table on shows the total number of samples checked at each location by drug class.

Results
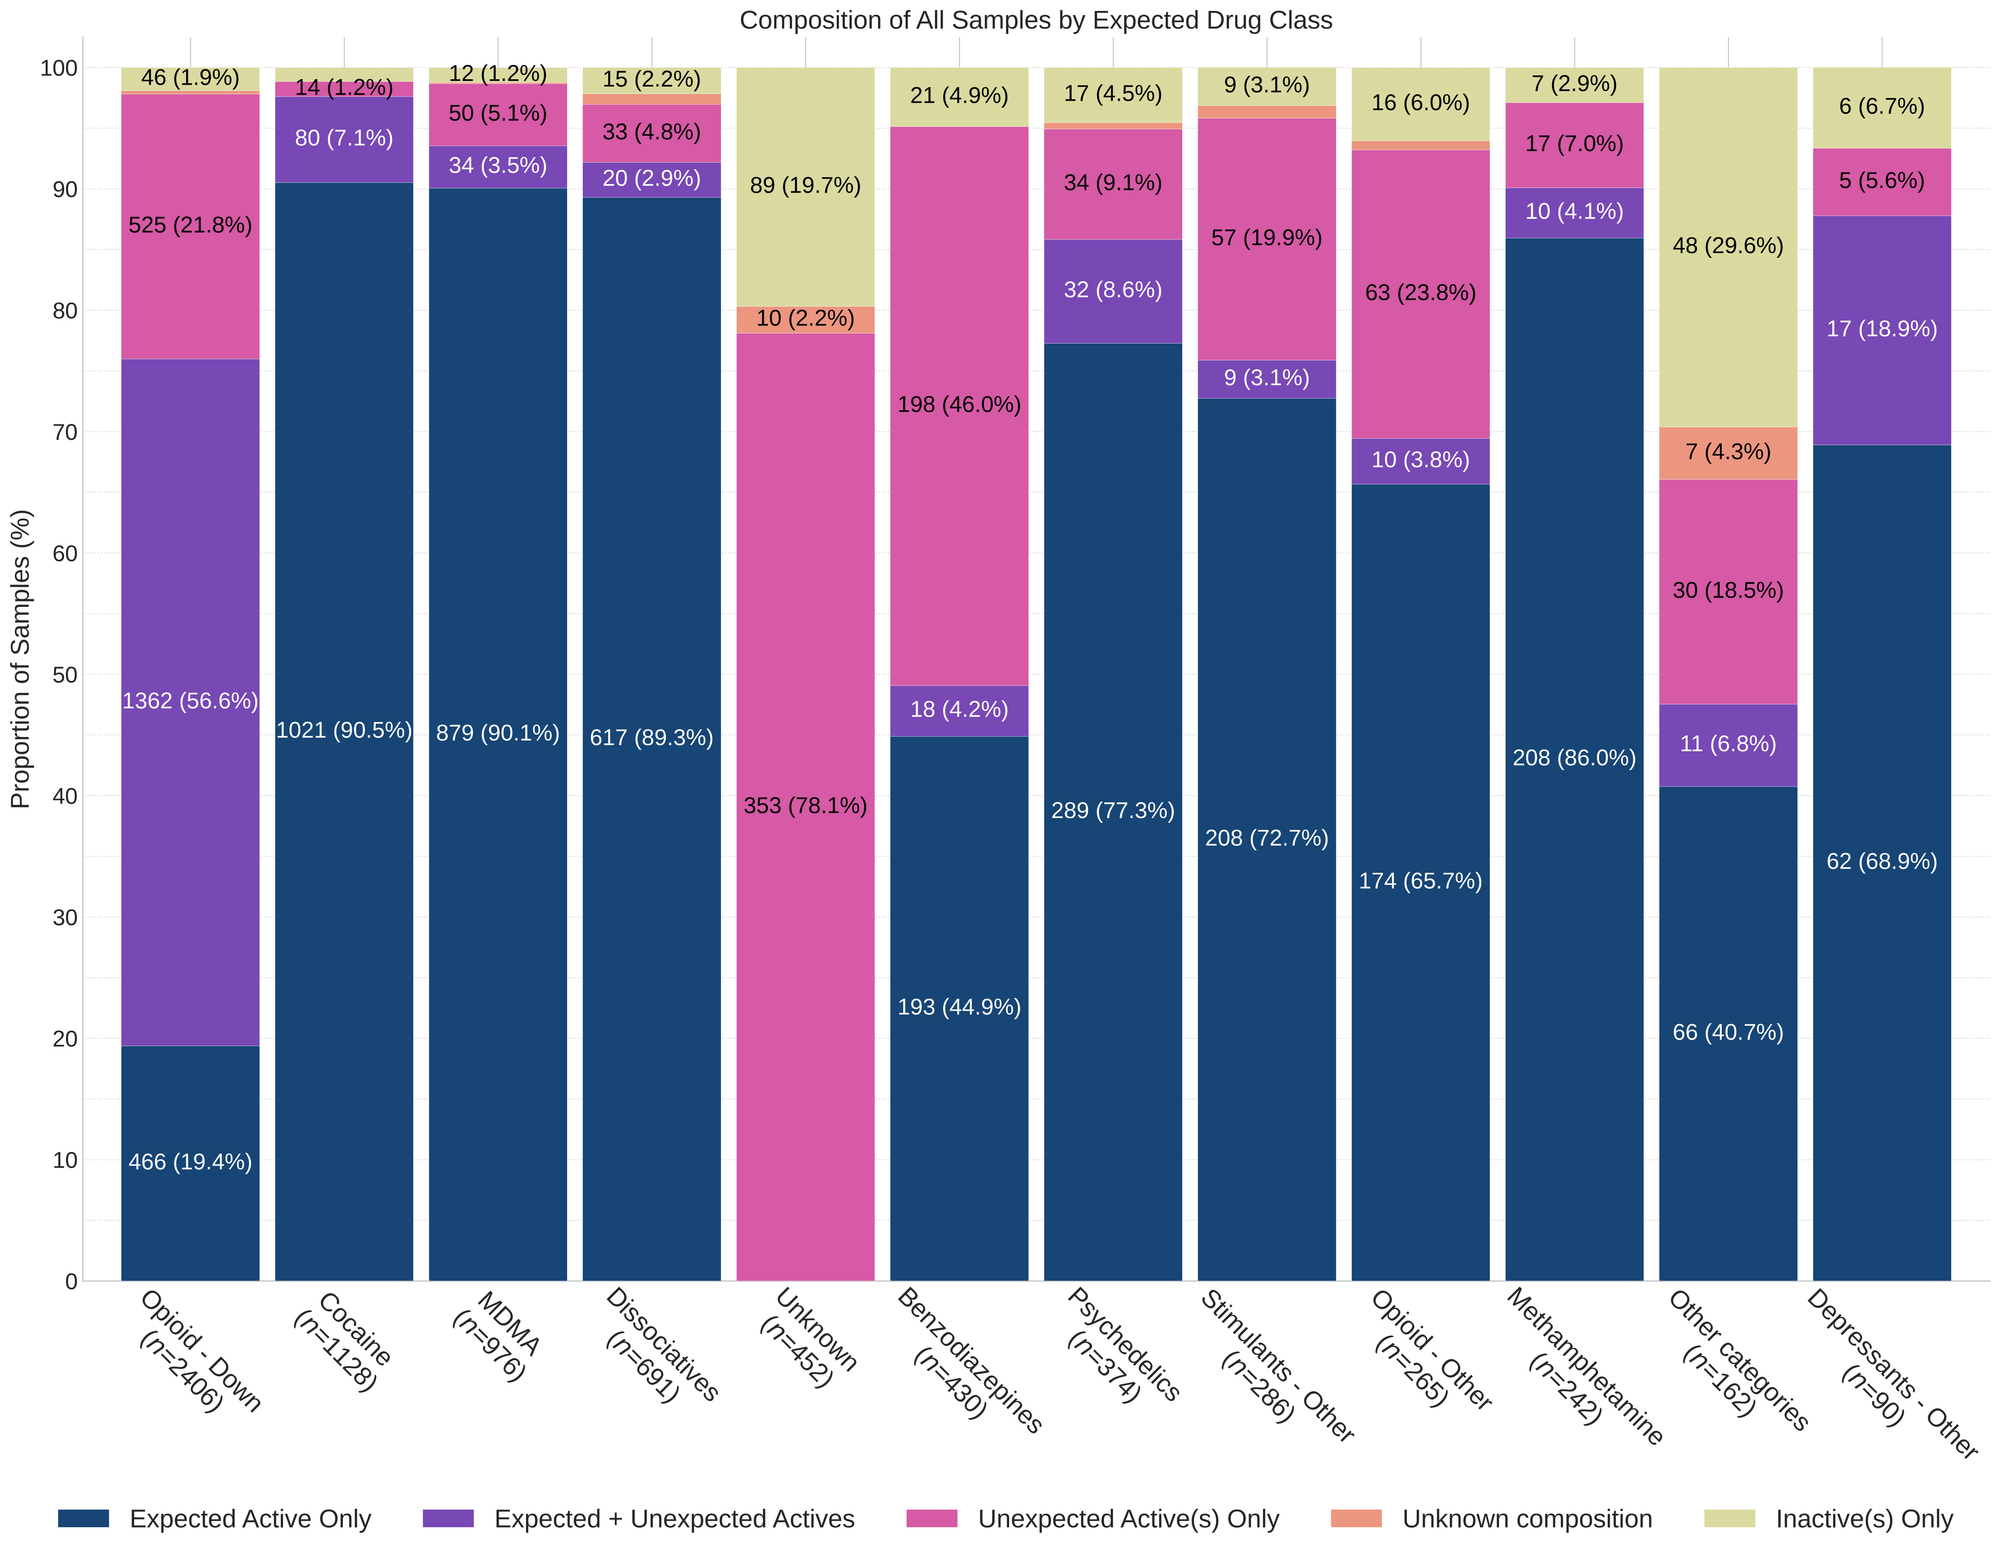
For the majority of samples checked, we confirm the presence of the expected drug with no additional active compounds detected above the limitations of the drug check. The figure below highlights all drug classes, differentiating samples where only the expected active component was detected—from situations when other unexpected active components were detected, when the sample was of unknown composition, and when no active components were detected.
Examining the figure below, we can see that a majority of the samples checked within each drug class, contain the expected active only. The main exceptions to this are expected opioid–down samples, expected benzodiazepines, and expected unknown samples. In the PDF report at the end of this blog post we break down each of the drug classes, taking a look at their composition across locations, breaking down which substances and cutting agents we found, and quantifying actives when possible.
Want to be notified when we release these reports? Join our mailing list by clicking the button below. You'll receive updates about when our reports are available directly in your inbox. You can subscribe and unsubscribe from this list at any time.