March 2022 Monthly Report

In this blog post we discuss our March 2022 report and provide more information on how to interpret the results. The PDF report can be found at the end.
Key findings:
- Carfentanil was found in one expected opioid-down sample
- 96% of expected opioid-down samples contained fentanyl
- The median fentanyl concentration found, in all expected drug categories, was 10.7%, with a maximum of over 80%
- Benzodiazepines and/or etizolam were found in 54.4% of expected opioid-down samples
- The maximum concentration of etizolam found was >25%, in an expected opioid-down sample
Insight for the March 2022 Monthly Report
March 2022 marked the 1 year anniversary of service at our storefront location in North Park and what a year it was! Between expanded outreach services, extended hours, in house confirmatory testing with the PS-MS, distributed drug checking, a new online model, six peer-reviewed publications, and a casual 2556 samples checked in 2021 (a 98% increase from 2020!), we are invigorated by our growth and are delighted to have found such a welcoming and supportive home in North Park (with an immense amount of gratitude to SOLID Outreach, AVI Health and Community Services, and the North Park Community Association). As we march into the second year at our storefront, we embrace the continual increase in service uptake, strive to be a sympathetic and inclusive fixture in our vibrant neighbourhood, and promise to keep the pixie stick sugar flowing.
Maintaining maximum momentum into March, we smashed our previous monthly record with 501 samples checked. As before, we breakdown our sample counts into two categories:
-
samples received through direct service provision, where service users are bringing samples into our storefront. These samples are labelled as “Substance” samples in the figures/tables of this blog post.
-
samples received through indirect service provision, where samples are being collected through no contact drop-off envelopes, mail-in envelopes, or are being collected by harm reduction workers and/or other community members at supported housing sites, at overdose prevention sites, and supervised consumption locations. These samples are labelled as “Outreach” samples in the figures/tables herein.
Drug types
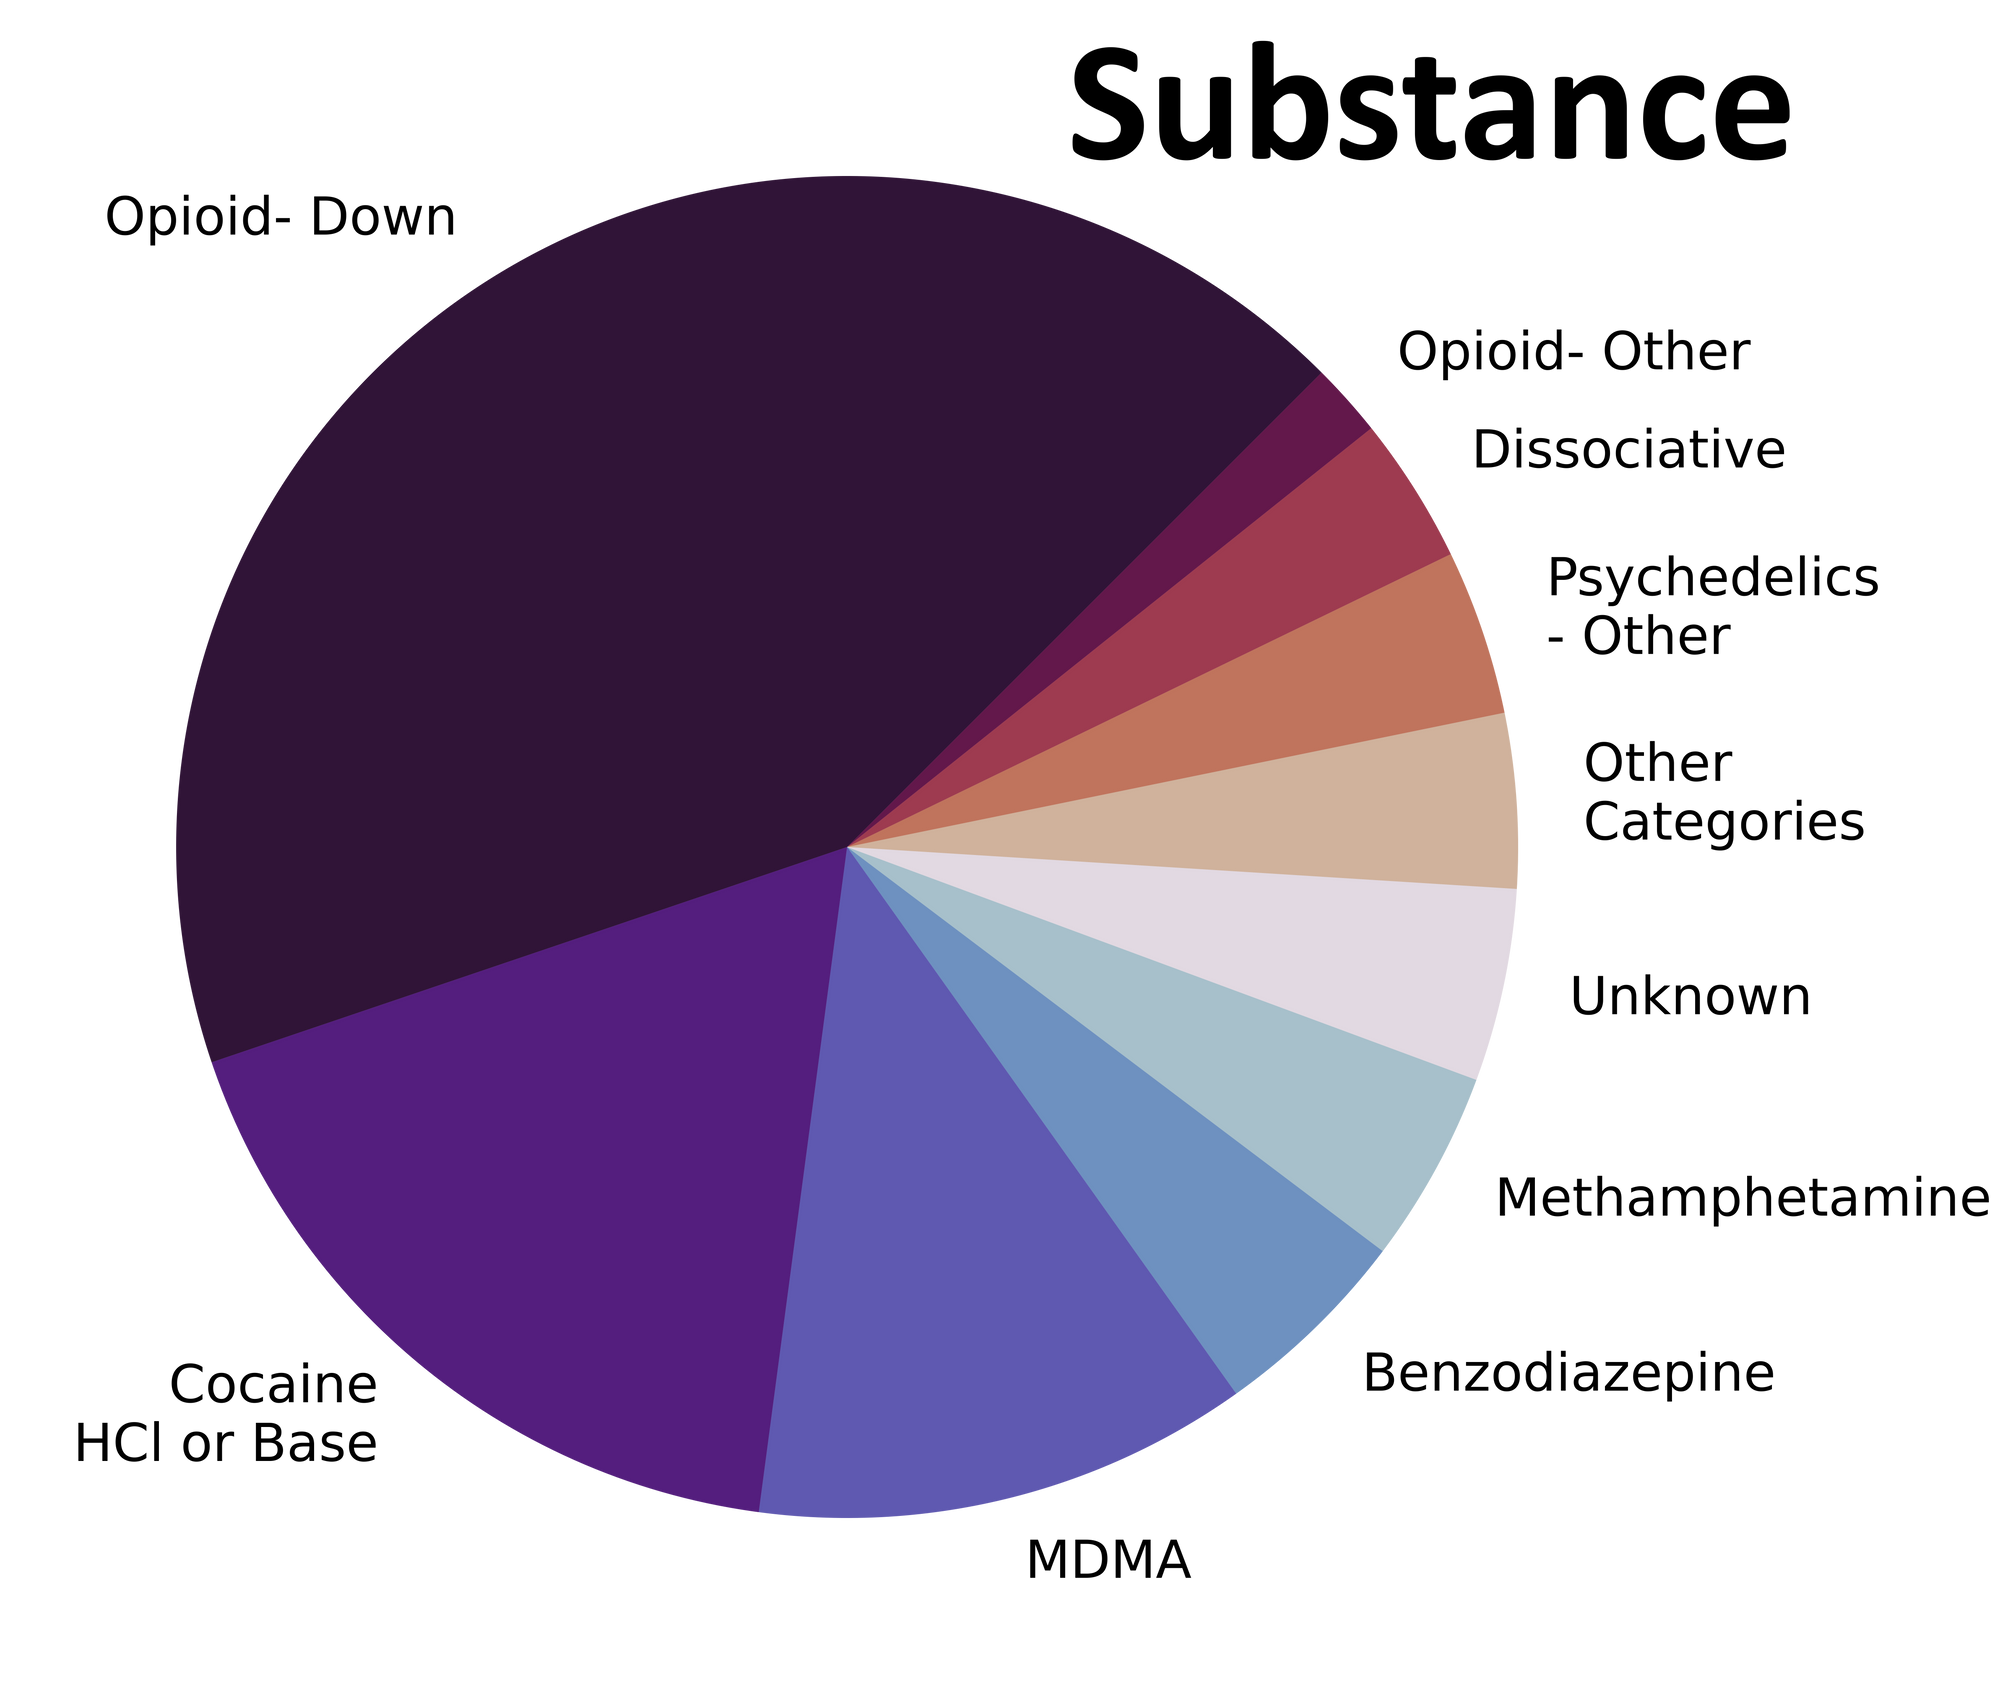
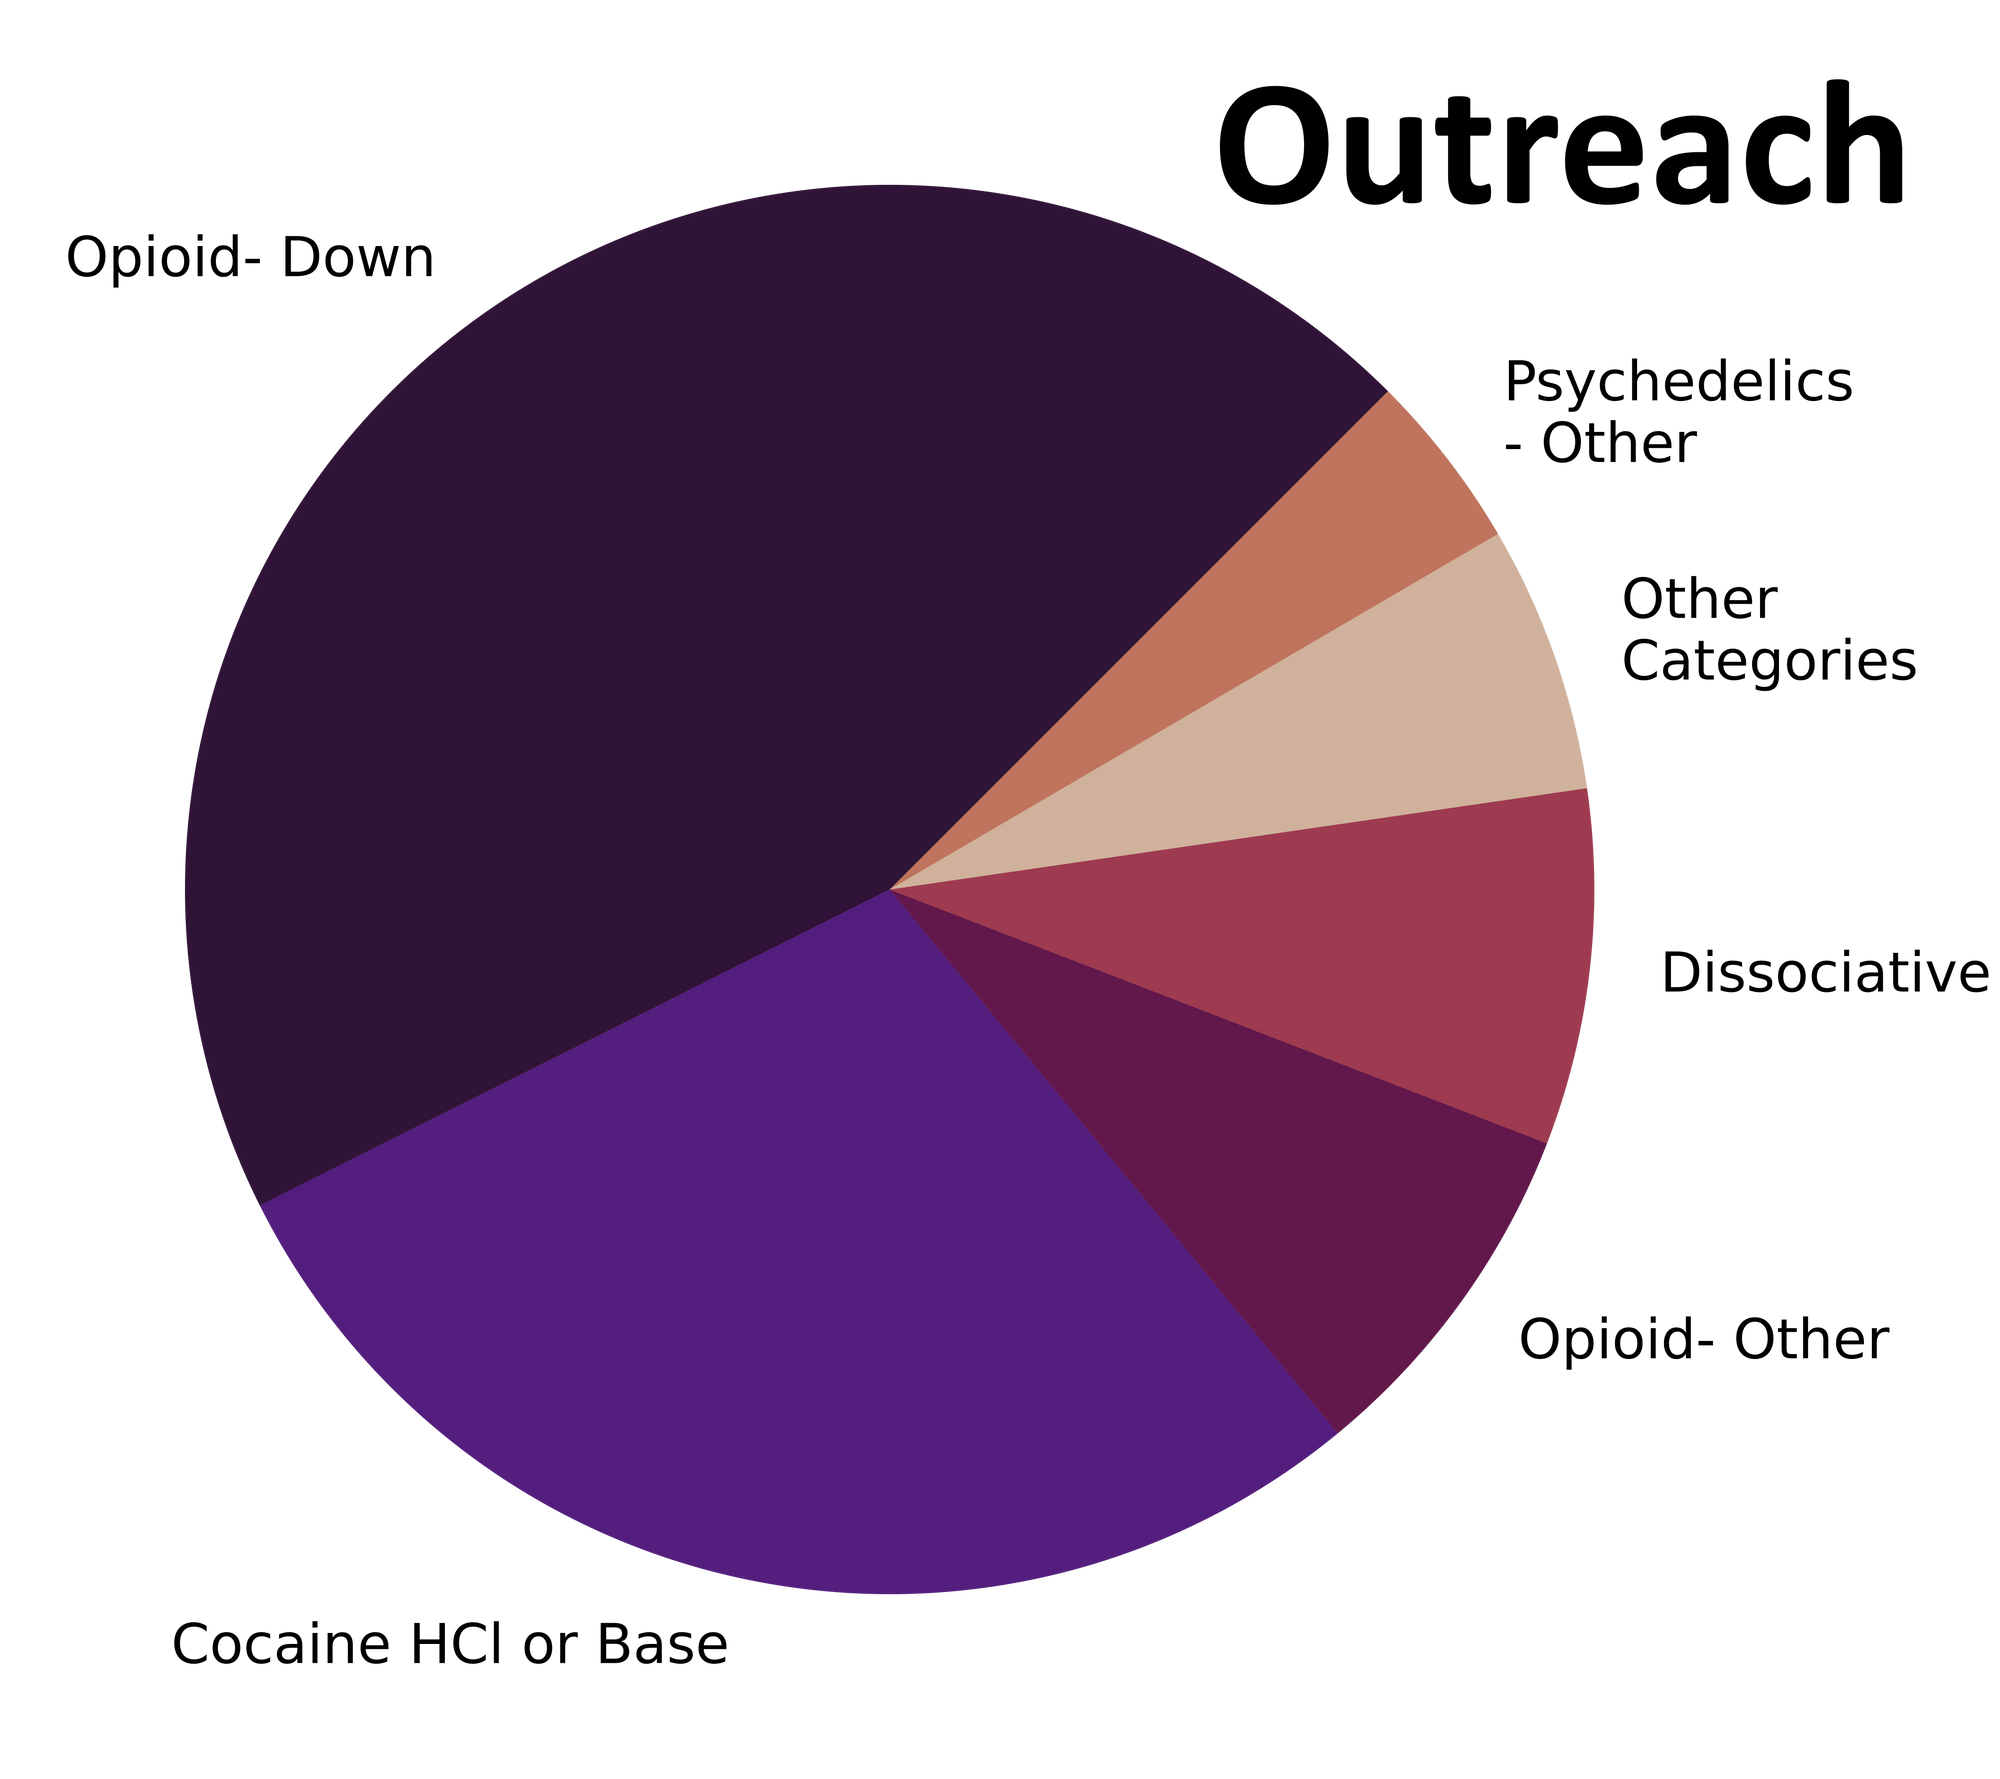
A myriad of molecules ranging from morphine to MDMA to mannitol meandered into our storefront in March. Fig. 1 shows the prevalence of each expected drug category checked, split by sample collection location/method.

Mysterious mixtures or merely methamphetamine?
For a majority of samples checked, we confirm that the expected drug was indeed the only active and that no additional active compounds were present. The bar charts below highlight a few classes of drugs, differentiating samples when only the expected active was found from situations when other unexpected components were detected.
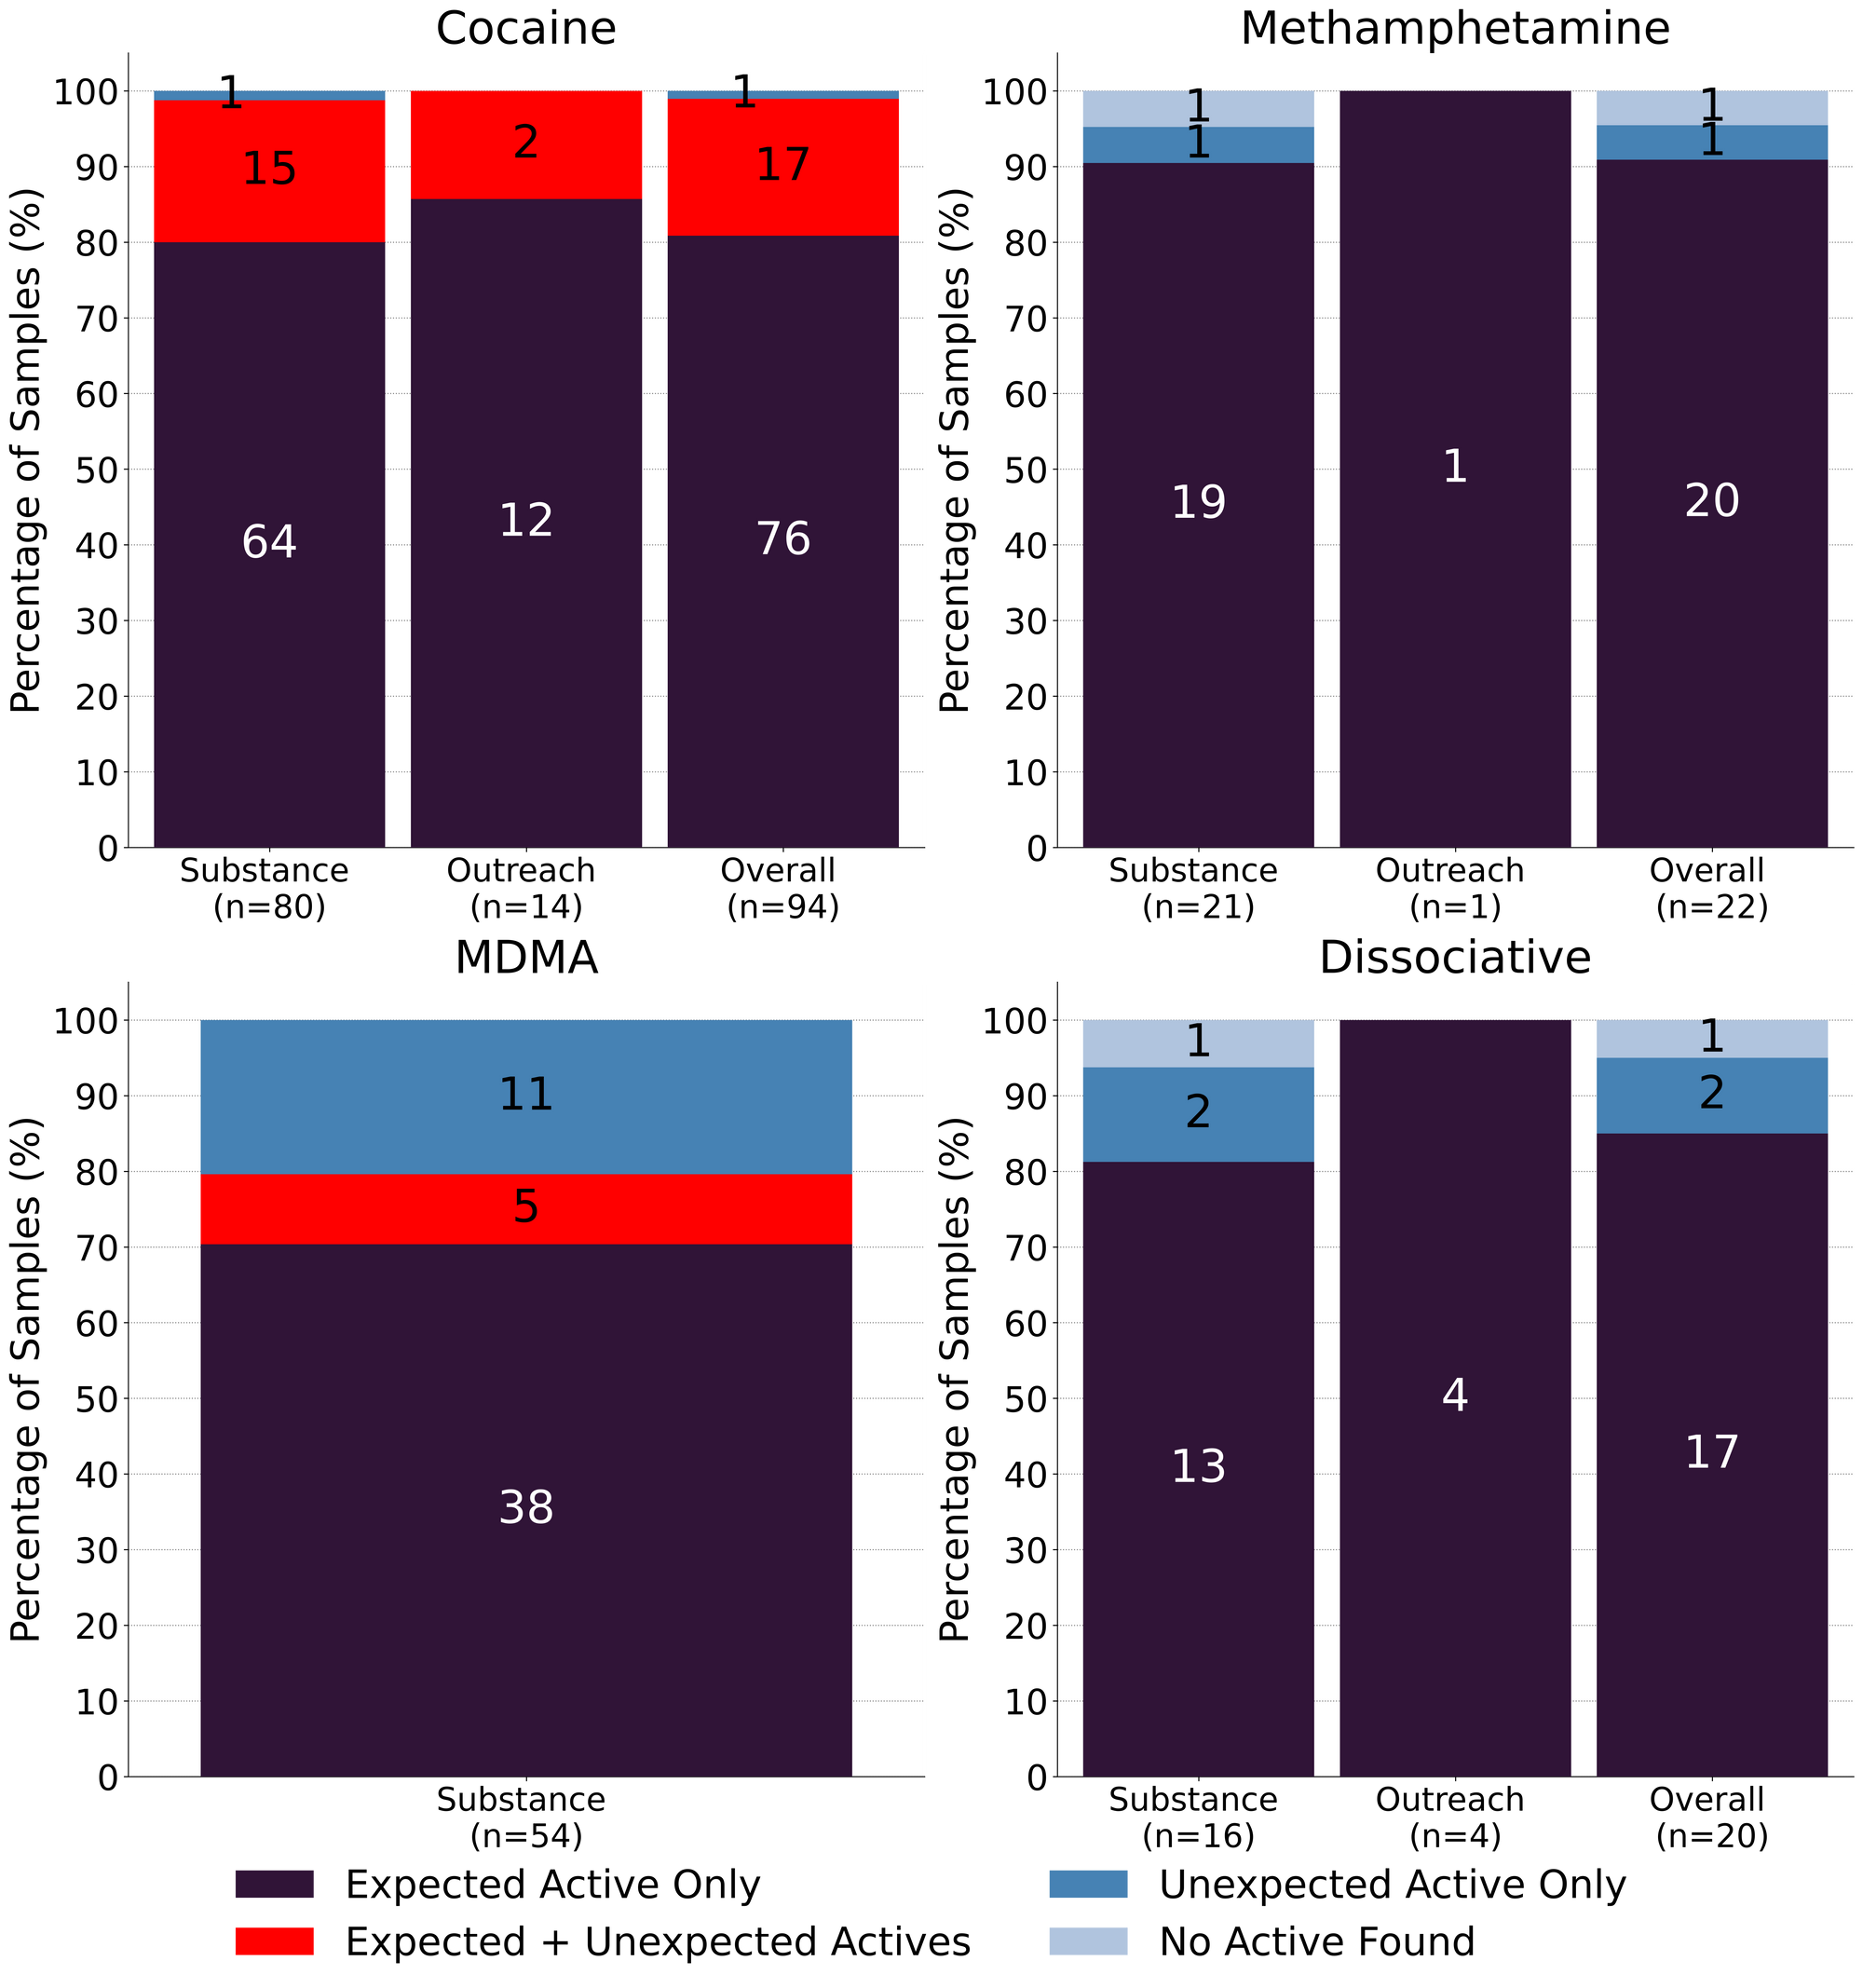
94 expected cocaine samples were checked in March. 81% (76/94) were found to only contain cocaine (or cocaine base) as a single ingredient. 17 samples contained an active component in addition to cocaine, with the additional actives representing a suite of different drug categories:
- Levamisole - 10 samples; an antihelminthic drug used to treat parasitic worm infections, commonly seen as a cut in cocaine
- Fentanyl - 3 samples. All three samples contained fentanyl at concentrations below 0.3% and were likely due to cross contamination. A rare occurrence here in Victoria!
- One sample also contained trace amounts of etizolam, a benzo-like drug, further characteric of cross contamination from a down sample.
- Phenacetin - 3 samples; an acetaminophen (Tylenol)-like drug, colloquially referred to as “superbuff”
- Procaine - 2 samples; a local anaesthetic
- Benzocaine - 1 samples; a topical local anaesthetic
- MDA - 1 sample, an entactogen similar to MDMA
- Methamphetamine - 1 sample
1 expected cocaine sample was found to contain no cocaine and appeared to be a down sample instead (fentanyl, etizolam, and caffeine) and the remaining 1 expected cocaine sample checked did not contain cocaine or any other active compounds.
Maybe they’re born with it; maybe it’s methamphetamine - 91% (20/22) of expected methamphetamine samples checked in March were found to be meth as a single component, no cuts or adulterants detected. The remaining two samples, contained no meth and were instead found to be:
- 7% fentanyl with acetaminophen and caffeine as cutting agents - a clearly mislabeled down sample
- Sugar - sweet and simple
18 samples were expected to be ketamine and 94% (17/18) were found to be ketamine as a single component. The remaining sample contained no ketamine and was found to contain MDA instead.
The remaining two dissociatives checked were expected to contain the novel compounds 3-HO-PCP and deschloroketamine (O-PCM/DXE/DCK). We were not able to detect any active compounds in the 3-HO-PCP sample and the deschloroketamine sample was found to contain fluorodeschloroketamine (2-FDCK) instead. 2-FDCK is around twice as strong as deschloroketamine, though very limited data exists for these compounds.
73% (38/52) of expected MDMA samples checked were confirmed to just be MDMA. Within the remaining 14 expected MDMA samples:
- 5 samples were found to be both MDMA and MDA
- 8 samples were found to just be MDA
- 1 sample was cannabidiol (CBD) as a single component
None of the expected MDA samples (2) checked were confirmed to be MDA. Instead, one was found to be MDMA as a single component, and the other was found to be cannabidiol (CBD). Why partake in flaming hot festivities fueled by MDMA/MDA when you could instead enjoy an inflammation free chill early bedtime facilitated by CBD?
Benzodiazepines (n=22)
A majority of the benzodiazepines checked in March came to our service in the form of pressed pills, though two samples came in as powders. One pressed pill expected to be lorazepam (Ativan) was confirmed to be lorazepam, and a powder sample expected to be nitrazolam was confirmed as nitrazolam. The remaining 19 pressed pills were expected to be alprazolam (Xanax) though only a single sample was confirmed to be alprazolam while the remaining 95% (18/19) of pressed pills were found to contain a different benzo or benzo-related drug:
- Etizolam - 8 samples. Etizolam is ~2x weaker than alprazolam, though the concentration of each pill may be quite variable
- One pill additionally contained MDA
- Flualprazolam - 7 samples. Flualprazolam is ~2x stronger than alprazolam, though with the same concentration caveat as above
- Flubromazolam - 2 samples. Flubromazolam is a very potent and long lasting benzo with dosages around 0.1mg and effects lasting up to 18 hours.
- Zolpidem - 1 sample. A hypnotic sedative also known as Ambien
The remaining sample was a white powder expected to be a benzo with an unknown identity. Instead we found it to be acetaminophen and 0.3% fentanyl; no benzos were detected in this sample. As benzos continue to be inextricably entwined with the opioid-down supply, unfortunately it does not come as a surprise to find opioids in expected benzodiazepine samples. With that said, we have yet to find fentanyl in any pressed pills expected to be benzos, and as we have reported before, these results were not unexpected to the majority of the service users who brought in these samples.
Opioid-Down (n=215)
In this section we present results specific to the opioid-down supply, therefore they may differ from the highlighted findings above that are inclusive of all expected drug categories.
- 96% of expected opioid-down samples contained fentanyl (207/215)
- Heroin was the primary active found in six samples, with a median concentration over 80%
- Fentanyl was additionally detected in two of these samples, at concentrations of 0.4% and 3%
- One sample contained carfentanil at 0.1%. This sample also contained 1% fentanyl and trace <0.1% flualprazolam
- 54% of expected opioid-down samples contained a benzo and/or etizolam (117/215)
- Xylazine was detected in 15 opioid-down samples, with a median concentration of 0.2% and a wide range of 0.1% to 20.8%
This March, 76% of all opioid-down samples checked contained an additional active to the expected fentanyl and/or heroin. Despite all the changes we saw in 2021, the down supply has remained consistently inconsistent (Fig. 3).
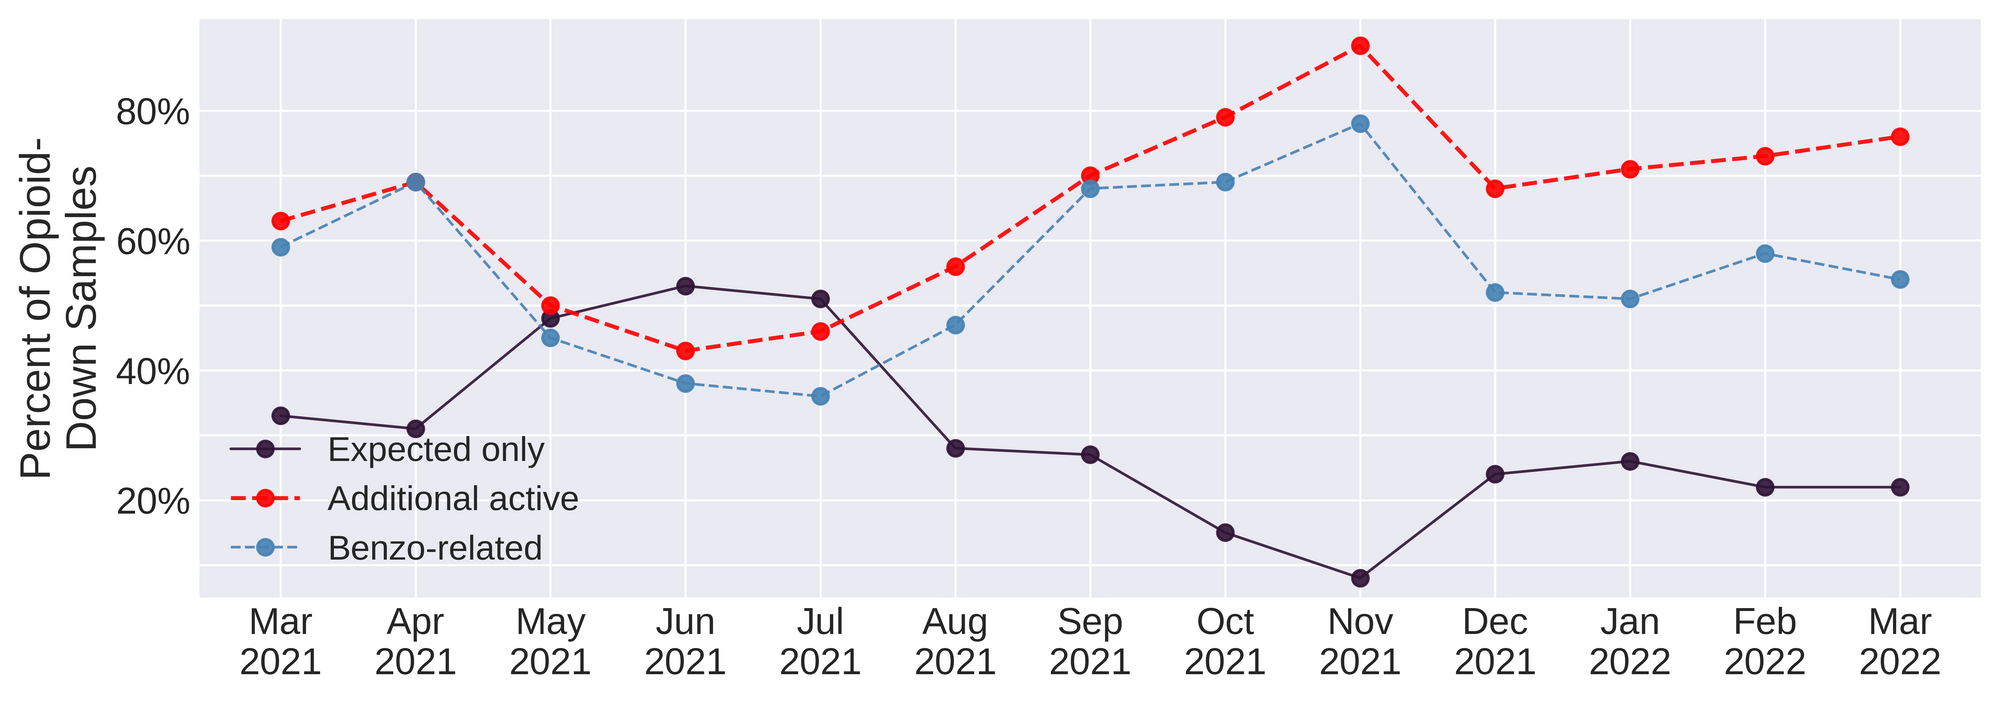
Benzo-related drugs remain the primary contributor to the additional actives found in expected opioid-down samples with (117/215) of the total expected opioid-down samples checked containing a benzo-related drug.
Every month we report on high potency fentanyl analogues, benzodiazepines, xylazine, nitazenes, and the profusion of countless other compounds detected in the down supply and it is utterly repulsive and devastating to revisit these findings time and time again when we know that safer supply of all drugs and decriminalisation are effective interventions in the unregulated market. As always, it is long past time we listen to the people who use drugs who have been pointing to remedies to these challenges.
Quantification for Expected Opioid-Down[1]
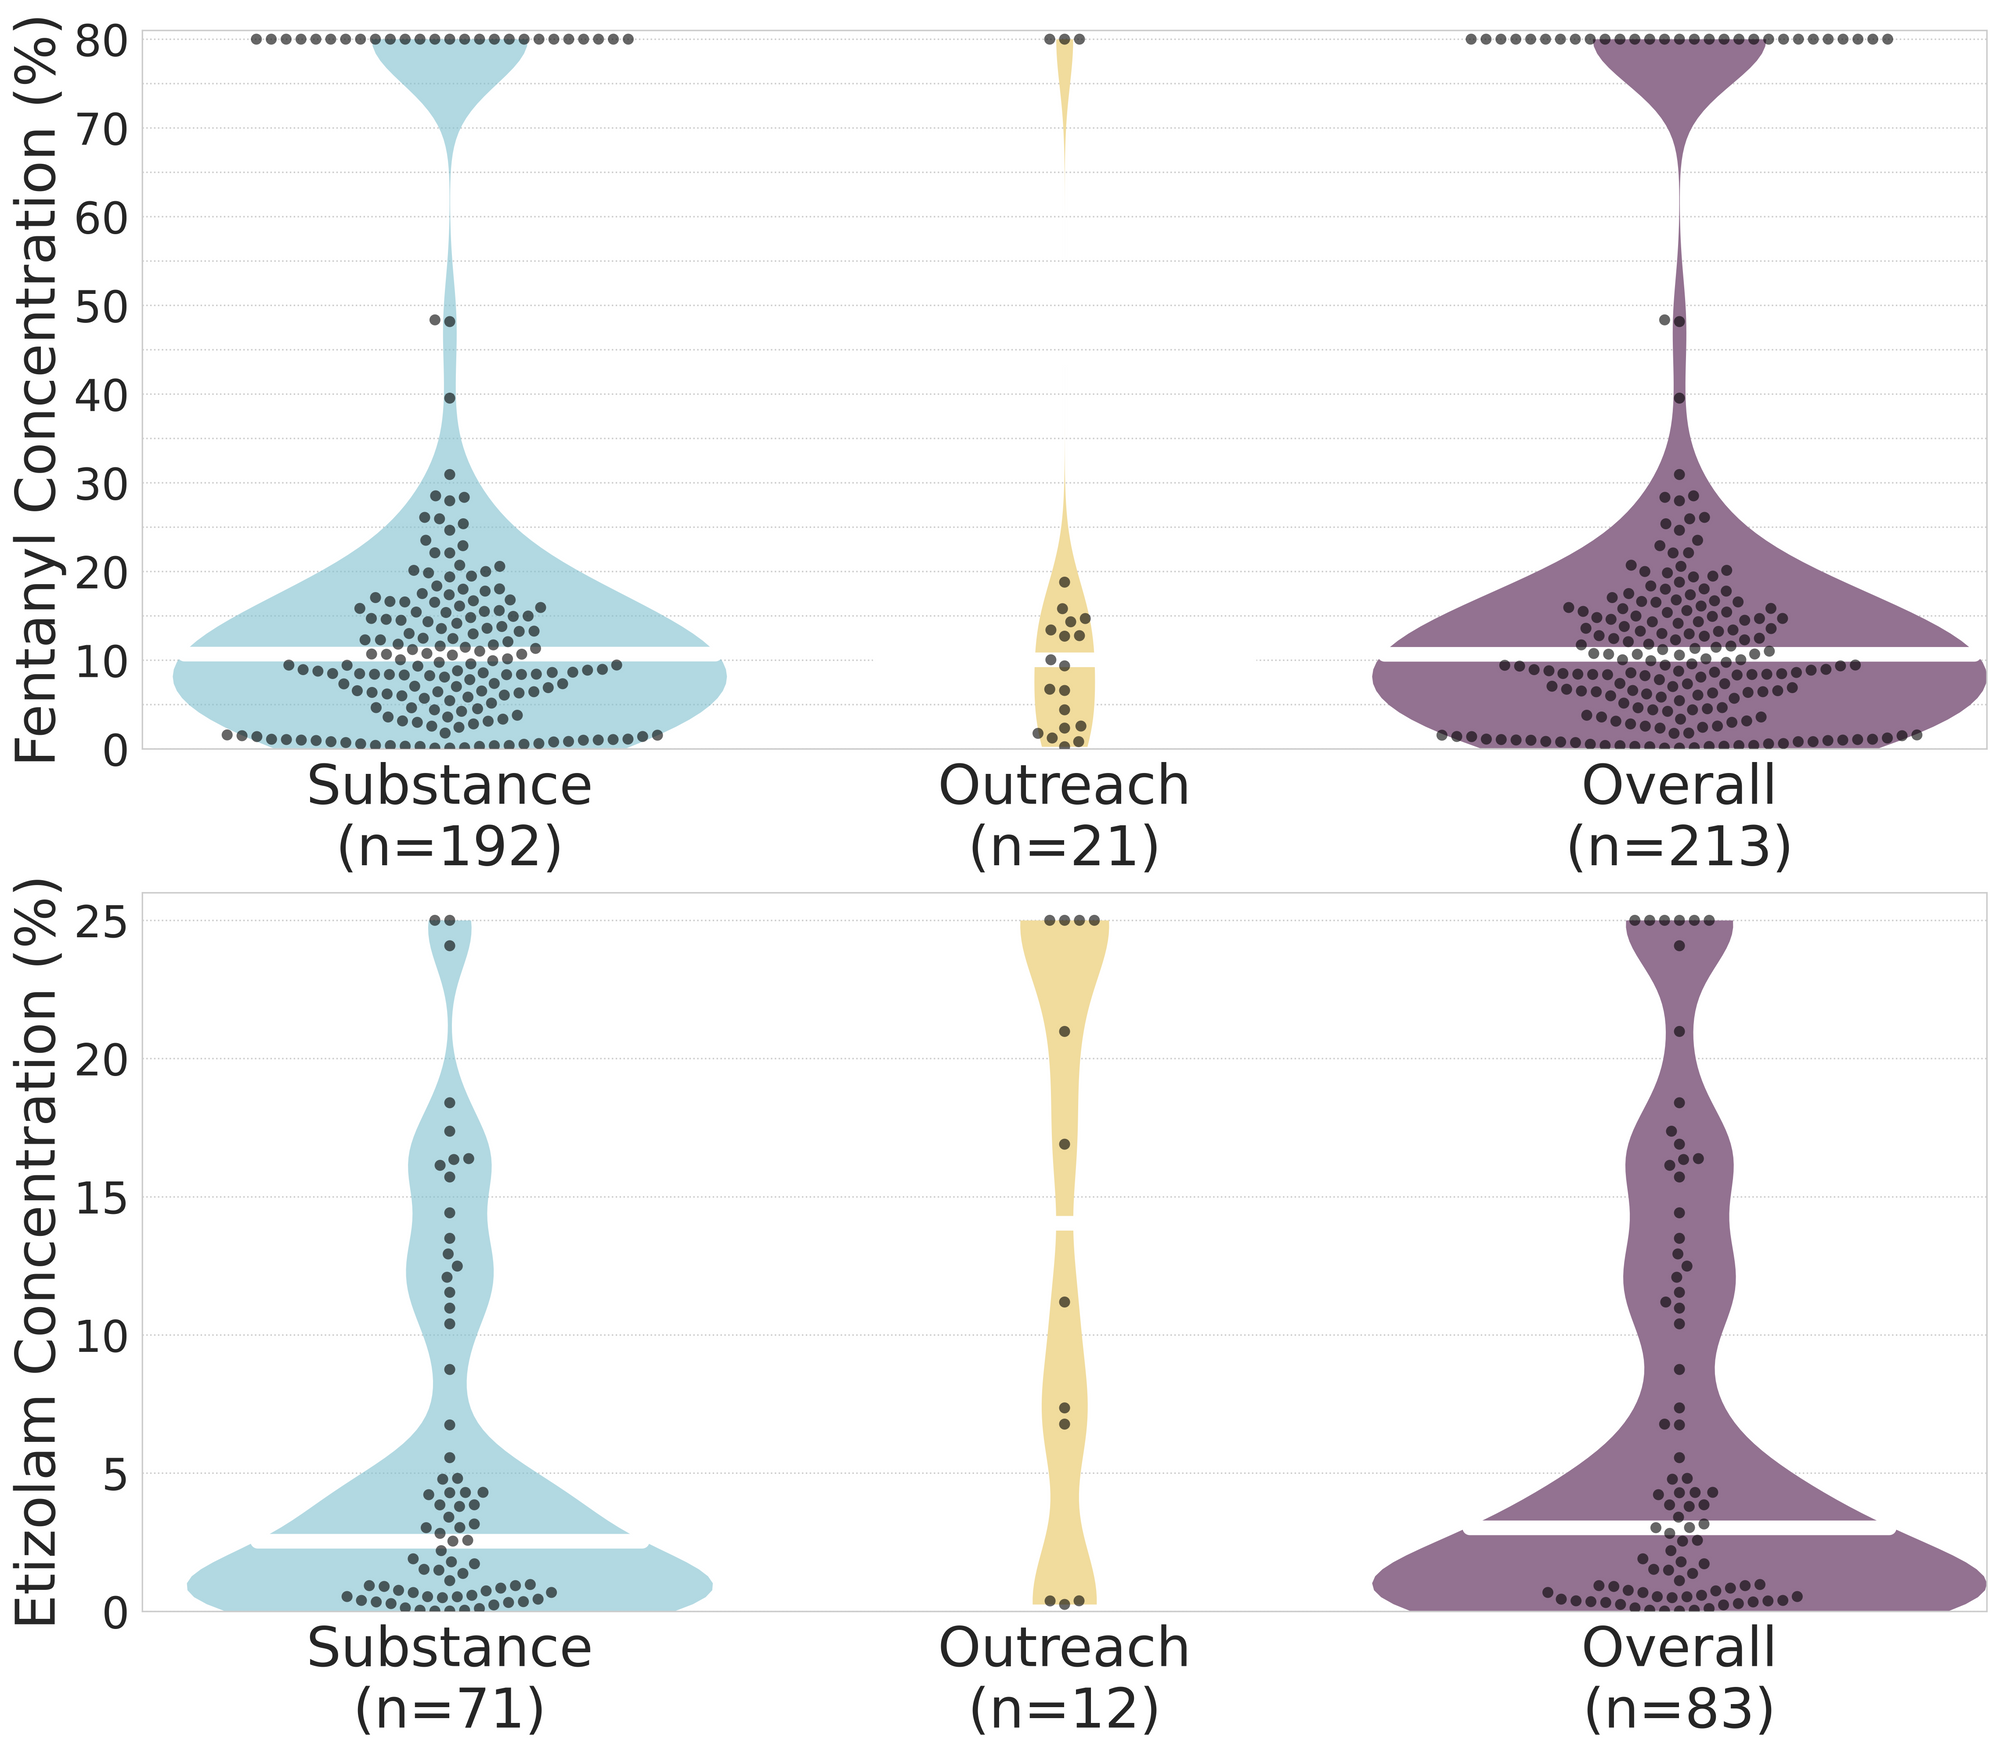
In March, we quantified fentanyl for 205 of the expected opioid-down samples containing fentanyl and found the median concentration to be 11.2% with the average strength of fentanyl we normally see being around 10% as well. Though the median is a useful indicator, it doesn’t capture the volatility of fentanyl concentrations present in the opioid supply, as any one sample might be the lowest strength (0.1%) or the strongest (>80%[2]). Similarly, the concentration of etizolam was across the board in expected opioid down samples, ranging from 0.1% to >25%[2:1], with a median of 3.9%.
Not all opioid down samples brought to our service can be quantified. This is primarily due to too limited sample collected for our instruments to report a reliable mass percentage. Nevertheless, qualitative detection is still possible. ↩︎
For samples that contain more than 80% fenanyl, or more than 25% etizolam by weight, our mass spectrometer is presently unable to reproducibly assign a concentration due to the upper limits of the calibration methods currently adopted. ↩︎ ↩︎

The fentanyl and etizolam concentrations that we quantified in down samples checked in March are presented in Fig. 4. Black dots are individual opioid-down samples, Horizontal white bars show the median concentrations of fentanyl and etizolam quantified, the width of the shaded regions mirrors the number of samples at a given concentration.
Want to be notified when we release these reports? Join our mailing list to receive updates about when our reports are out. You can subscribe and unsubscribe yourself from this list at any time.
Check back next month for the April report!
As always, send us feedback at substance@uvic.ca for how we can continue to offer our drug checking results in a useful way.