April 2022 Monthly Report

In this blog post we discuss our April 2022 report and provide more information on how to interpret the results. The PDF report can be found at the end.
Key findings:
- Carfentanil was found in seven expected opioid-down samples, with a maximum concentration of 2.95%
- 93% of expected opioid-down samples contained fentanyl
- The median fentanyl concentration found was 11.0%, with a maximum of over 80%
- Benzodiazepines and/or etizolam were found in 46.1% of expected opioid-down samples
- The median concentration of etizolam found in expected opioid-down samples was 2.9%, with a maximum concentration >25%
- Xylazine was found in eight expected opioid-down samples, with a median concentration of 21%
Insight for the April 2022 Monthly Report
In previous months, we introduced the roll out of our pop-up drug checking services at various sites across Vancouver Island, facilitated by the governments’ Urgent Public Health Needs Sites (UPHNS) sanctioning. In April, we returned to Port Alberni for a day of staff training and distributed drug checking at the Port Alberni Shelter Society’s Overdose Prevention Site, and additionally offered pop-up drug checking services during the Weekend at Lampress festival. Despite the varying classes of drugs represented at the different venues and whether we are helping folks identify ground scores, or helping quantify low concentration actives for dosing purposes, a similar message was shared between the service users at both locations: drug checking benefits all people who use drugs. As more sites are approved for UPHNS sanctioning, we eagerly look forward to expanded services and increased opportunities for collaboration across Vancouver Island. Expect to see distributed drug checking sites in Campbell River and Courtenay/Comox soon!
As before, this blog, and the associated pdf report, breakdown our sample counts into two categories:
-
samples received through direct service provision, where service users are bringing samples into our storefront. These samples are labelled as “Substance” samples in the figures/tables of this blog post.
-
samples received through indirect service provision, where samples are being collected though distributed drug checking (Port Alberni Shelter Society and Weekend at Lampress festival), through no contact drop-off envelopes, mail-in envelopes, or are being collected by harm reduction workers and/or other community members at supported housing sites, at overdose prevention sites, and supervised consumption locations. These samples are labelled as “Outreach” samples in the figures/tables herein.
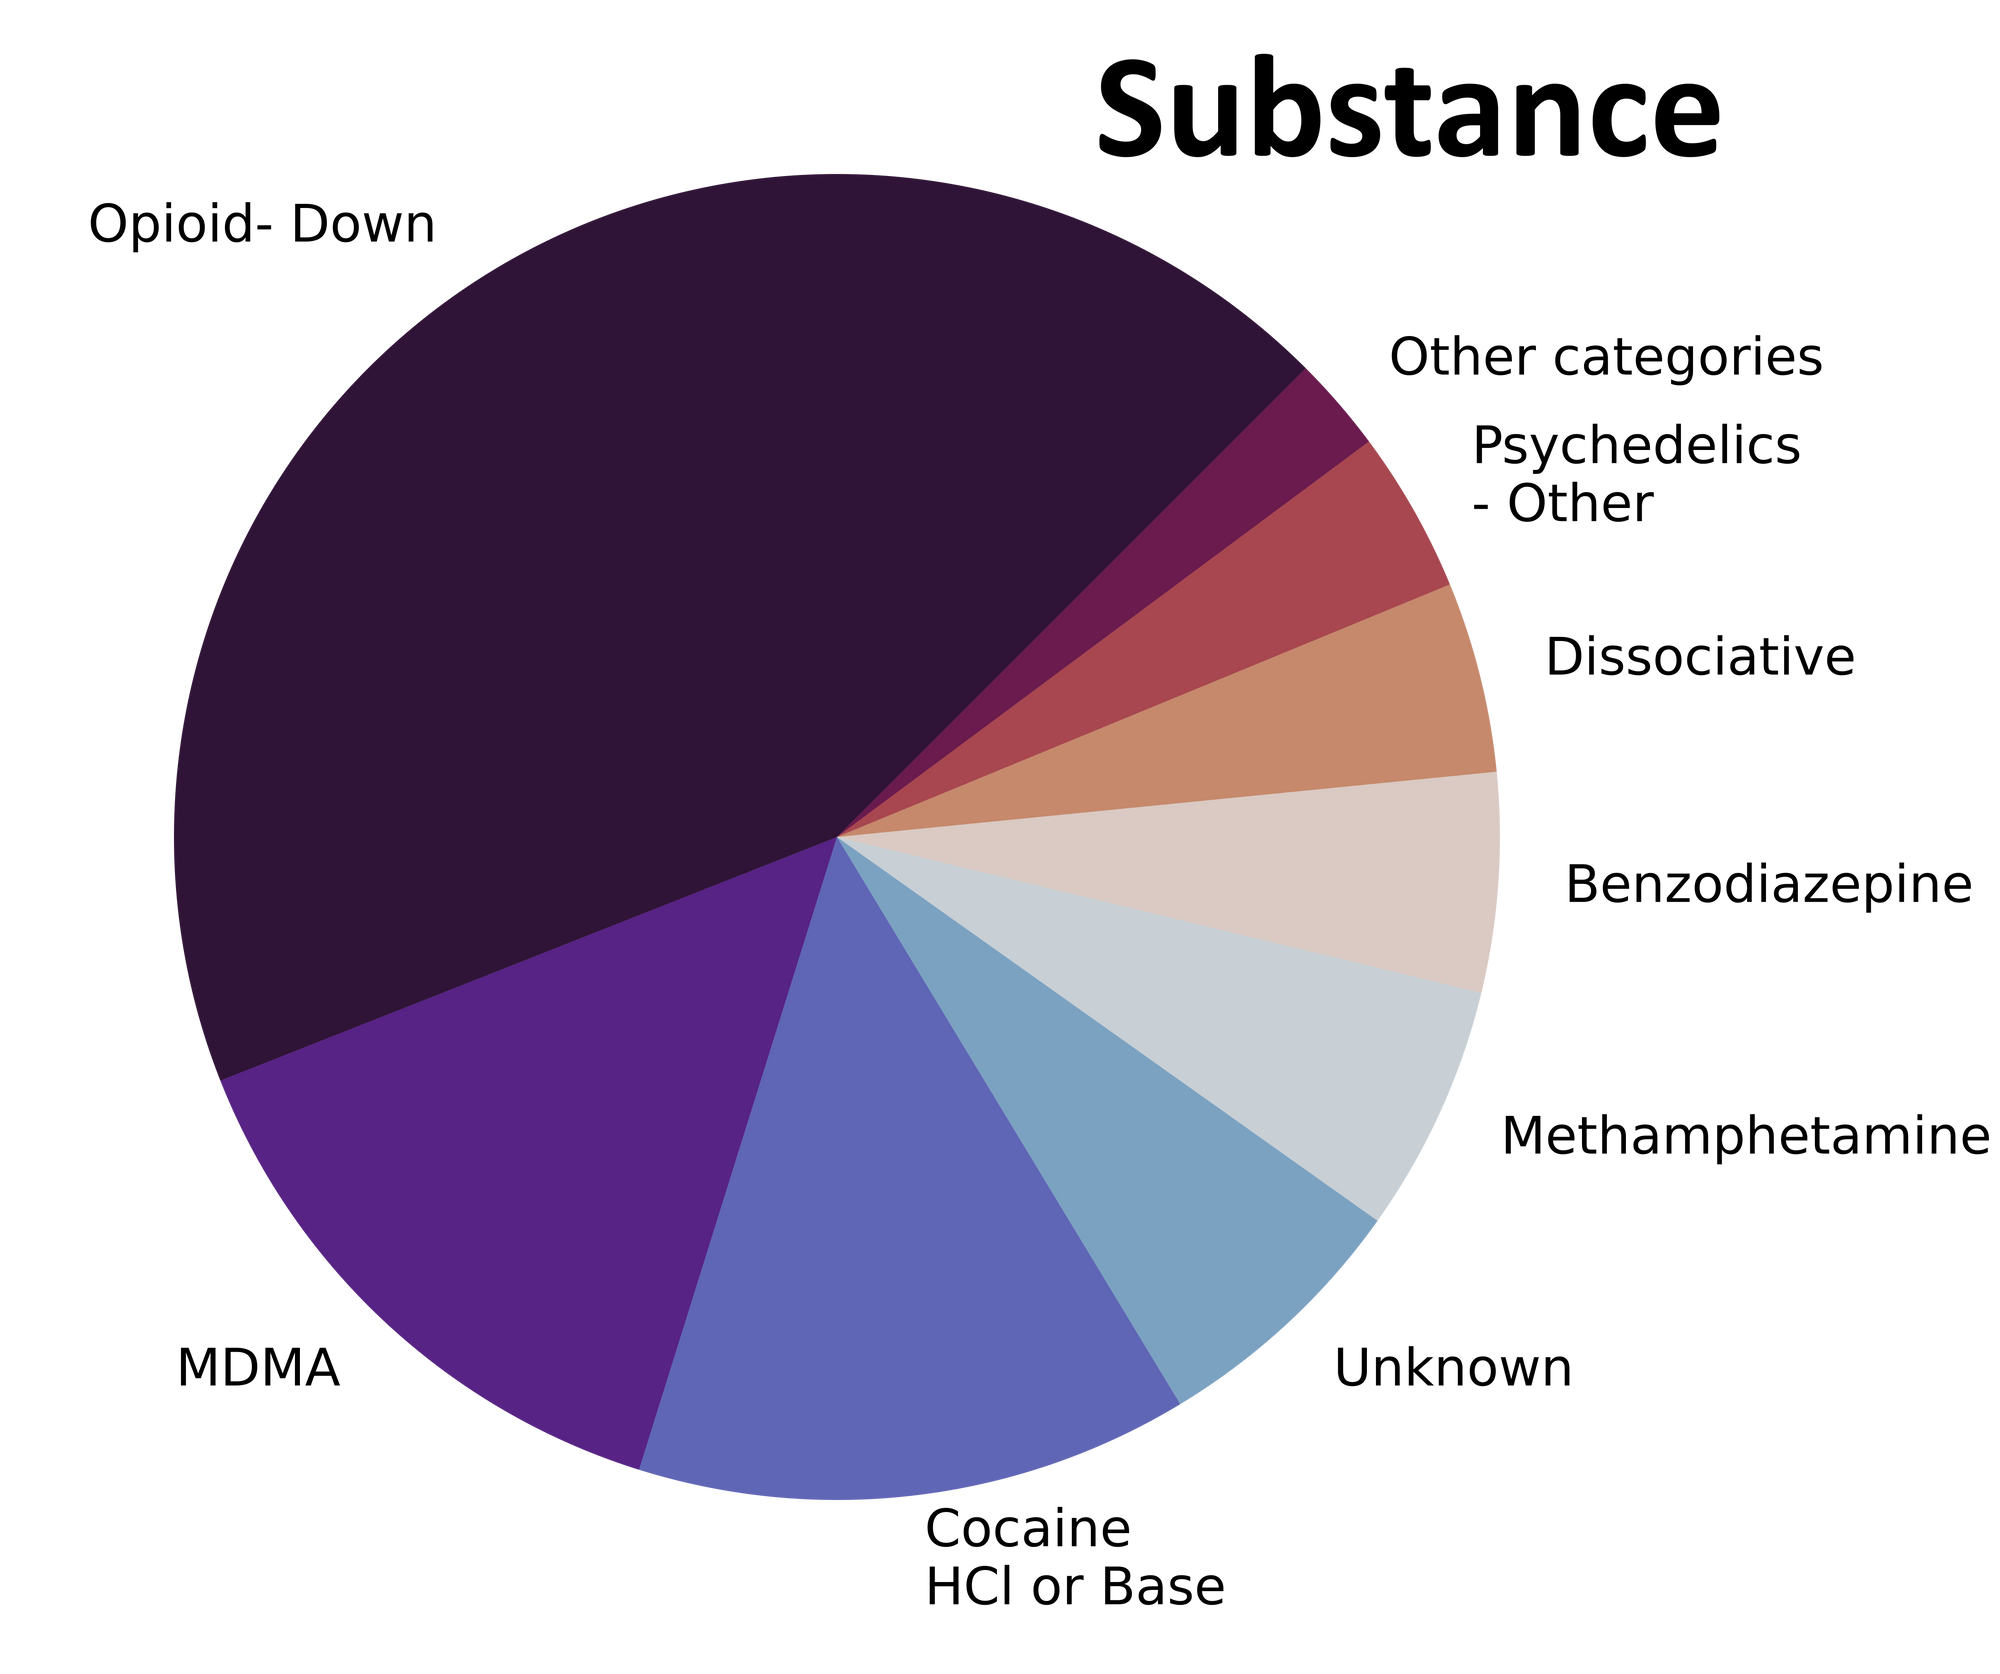
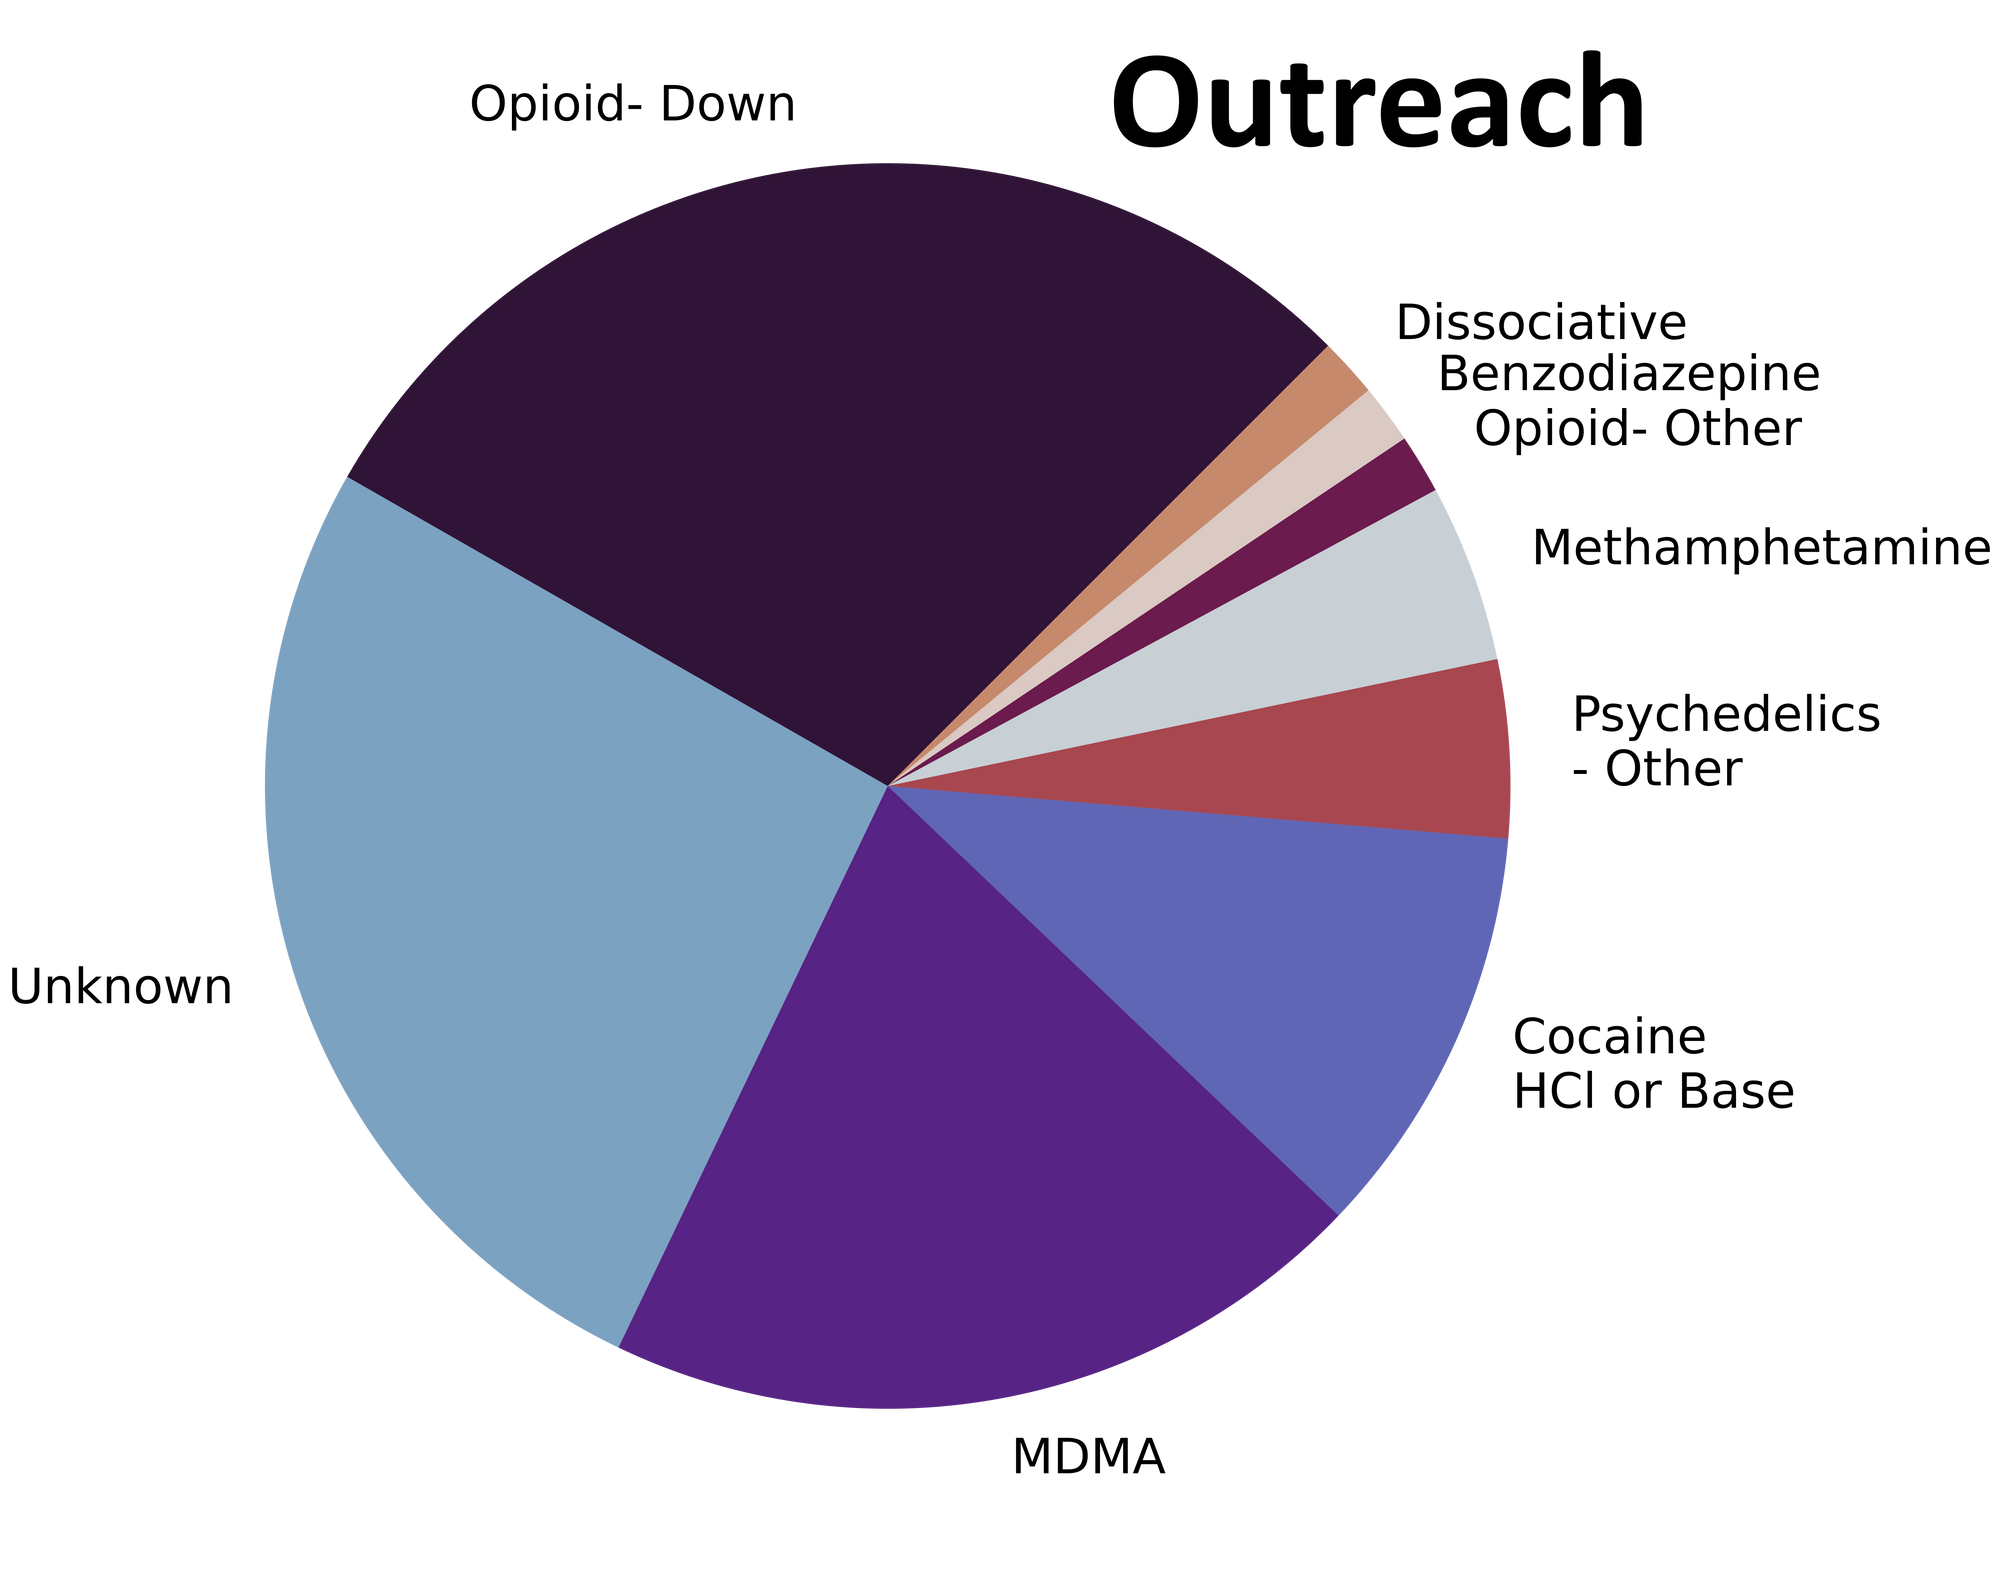
Drug types
From alprazolam to acetylmorphine to acetaminophen, an assortment of alluring atomic admixtures ambled onto our analytical apparatuses in April. Fig. 1 shows the prevalence of each expected drug category checked, split by sample collection location/method.

Are drugs assuredly as anticipated or actually ambiguous and adulterated?
For a majority of samples checked, we confirm that the expected drug was indeed the only active and that no additional active compounds were present. The bar charts below highlight a few classes of drugs, differentiating samples when only the expected active was found from situations when other unexpected components were detected.
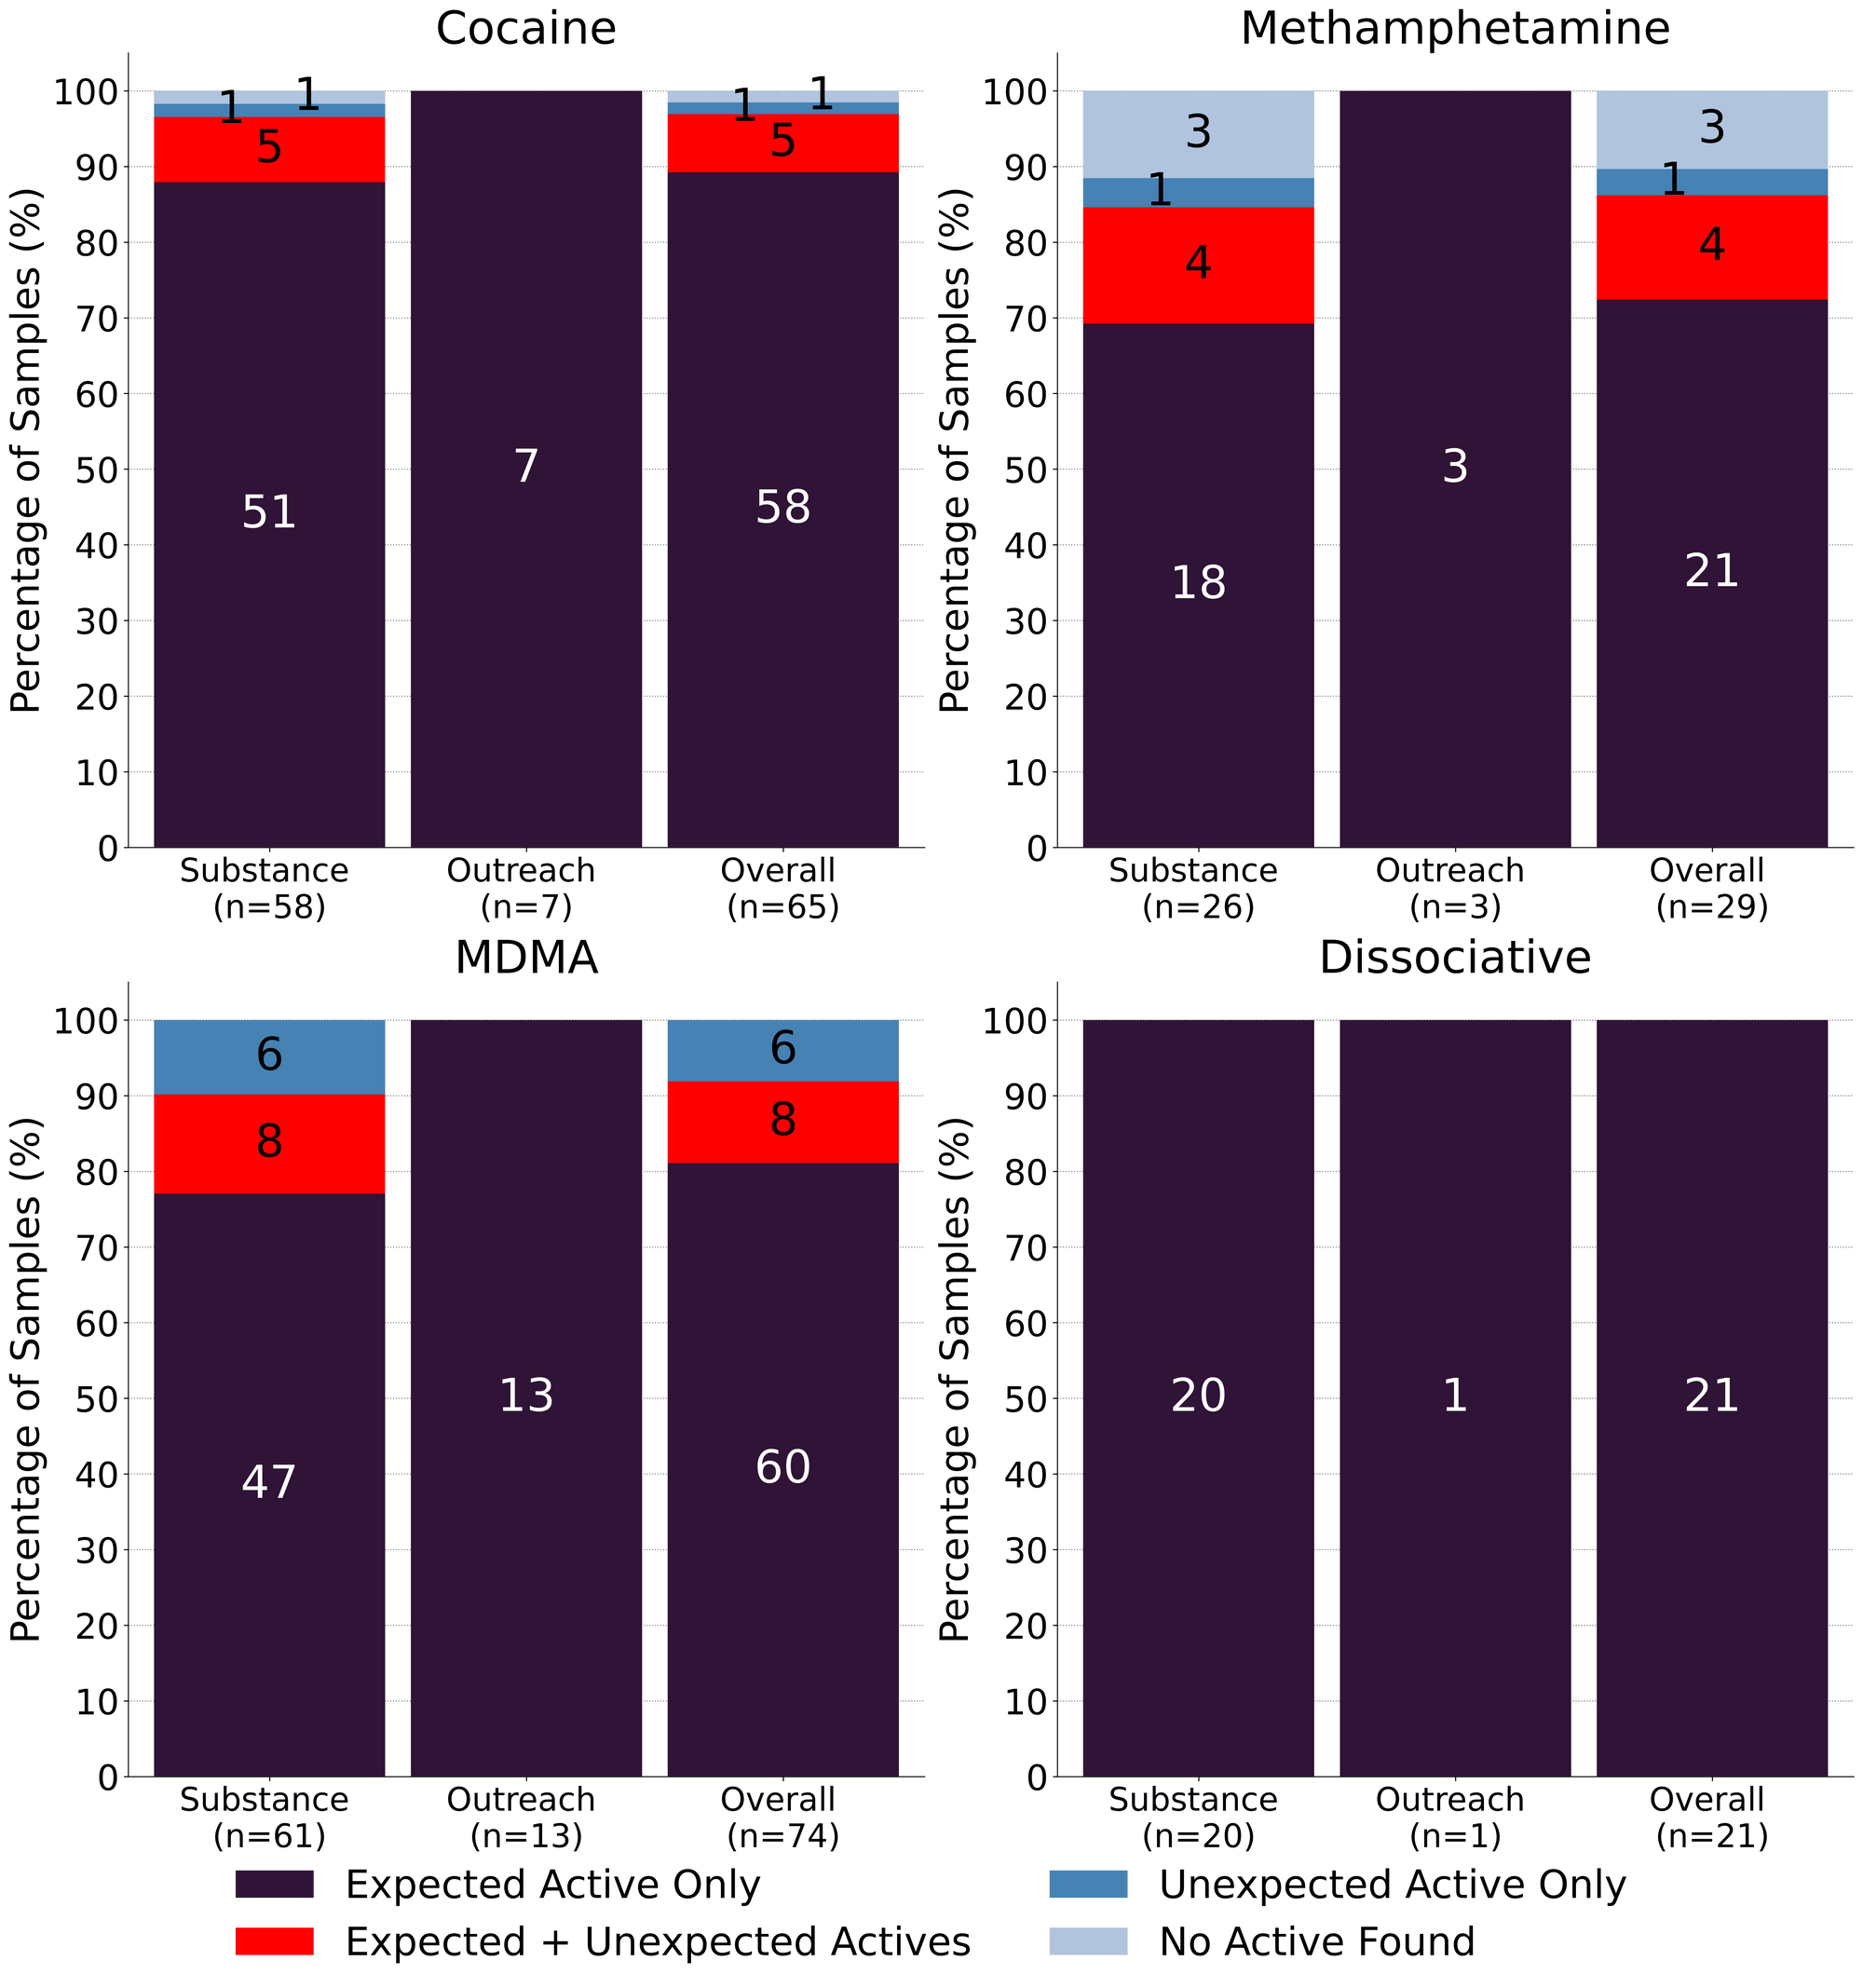
Meth is meth…except when it is not. 72% (21/29) of expected methamphetamine samples were found to be meth as a single component, no cuts or adulterants detected. One sample was found to just be cocaine, with no methamphetamine detected, and three expected meth samples contained no meth, or any other actives, and were found to be caffeine instead. In the remaining four samples, fentanyl was detected in addition to methamphetamine, with fentanyl concentrations ranging from <0.1% to 0.6%. In all four samples, we suspect cross contamination during sample transport introduced trace levels of fentanyl into the methamphetamine samples. With that said, these concentrations would still be pharmacologically active: assuming a well mixed sample, 0.6% fentanyl, in a 10mg dose of methamphetamine, translates to 60 micrograms of fentanyl per dose; comparable to higher dosages of fentanyl used in palliative care for pain management
65 expected cocaine samples were checked in April, between all collection locations/methods. 89% (58/65) were found to only contain cocaine (or cocaine base) as a single ingredient. 5 samples contained an active component in addition to cocaine:
- Levamisole - 4 samples; an antihelminthic drug used to treat parasitic worm infections, commonly seen as a cut in cocaine
- Benzocaine - 1 sample; a topical local anaesthetic
1 expected cocaine sample was found to contain no cocaine and instead was found to be MDA and the remaining 1 expected cocaine sample checked did not contain cocaine or any other active compounds.
81% (60/74) of expected MDA/MDMA samples checked were confirmed to just be MDA/MDMA. Within the remaining 14 samples:
- 7 samples were found to contain both MDMA and MDA
- 3 expected MDMA samples were found to just be MDA
- 1 expected MDA sample was found to be MDMA instead
- 1 expected MDA sample contained both MDA and cocaine
- 1 expected MDA sample was instead found to be cocaine, levamisole, and procaine
- 1 expected MDA sample was found to just contain 3-MMC
Okay, but K is K, eh? Yay! 21 expected ketamine samples were checked in April and all were found to simply be ketamine as a single component. No sugars, no cuts, just ketamine.
Benzodiazepines (n=24)
All benzodiazepine samples checked in April came to our service in the form of pressed pills, a majority of which were expected to be alprazolam (Xanax). 54% (13/24) of samples were confirmed to contain alprazolam as the single active component, while 38% (9/24) were found to contain a different benzo or benzo-related drug:
- Etizolam - 8 samples. Etizolam is ~2x weaker than alprazolam, though the concentration of each pill may be quite variable
- One pill additionally contained fentanyl at 0.5% and benzocaine at 28%
- Lorazepam (Ativan) - 1 sample. Lorazepam and alprazolam have comparable dosage and duration of effect
One sample was found to be a pressed pill containing just MDA with no benzos detected, and the remaining sample contained no active compounds and was found to just be a sugar pill.
Opioid-Down (n=206)
In this section we present results specific to the opioid-down supply, therefore they may differ from the highlighted findings above that are inclusive of all expected drug categories.
- 93% of expected opioid-down samples contained fentanyl (192/206)
- Heroin was the primary active found in 12 samples, with a median concentration of 52% and a range of 10% to greater than 80%
- Fentanyl was additionally detected in seven of these samples, with concentrations ranging from 0.3% to 14%
- Carfentanil was detected alongside heroin in four samples, at concentrations of 0.06%, 0.08% (x2), and 0.14%
- Seven samples contained carfentanil, with a median concentration of 0.11% and a range of 0.06% to 2.95% (the highest concentration of carfentanil that we have seen to date)
- One sample was expected to be, and was found to be etodesnitazene, a novel benzimidazole opioid, as a single component. Etodesnitazene is slightly less potent than fentanyl, in terms of morphine equivalency, with etodesnitazene being ~70x stronger than morphine, compared to ~80x for fentanyl.
- 46% of expected opioid-down samples contained a benzo and/or etizolam (95/206)
- Xylazine was detected in eight opioid-down samples, with a median concentration of 21.1% and a wide range of 0.1% to 26.6%
This April, 67% of all opioid-down samples checked contained an additional active to the expected fentanyl and/or heroin. While this is a small improvement over the past few months, examining Fig 3. we can see that the down supply has remained consistently inconsistent.
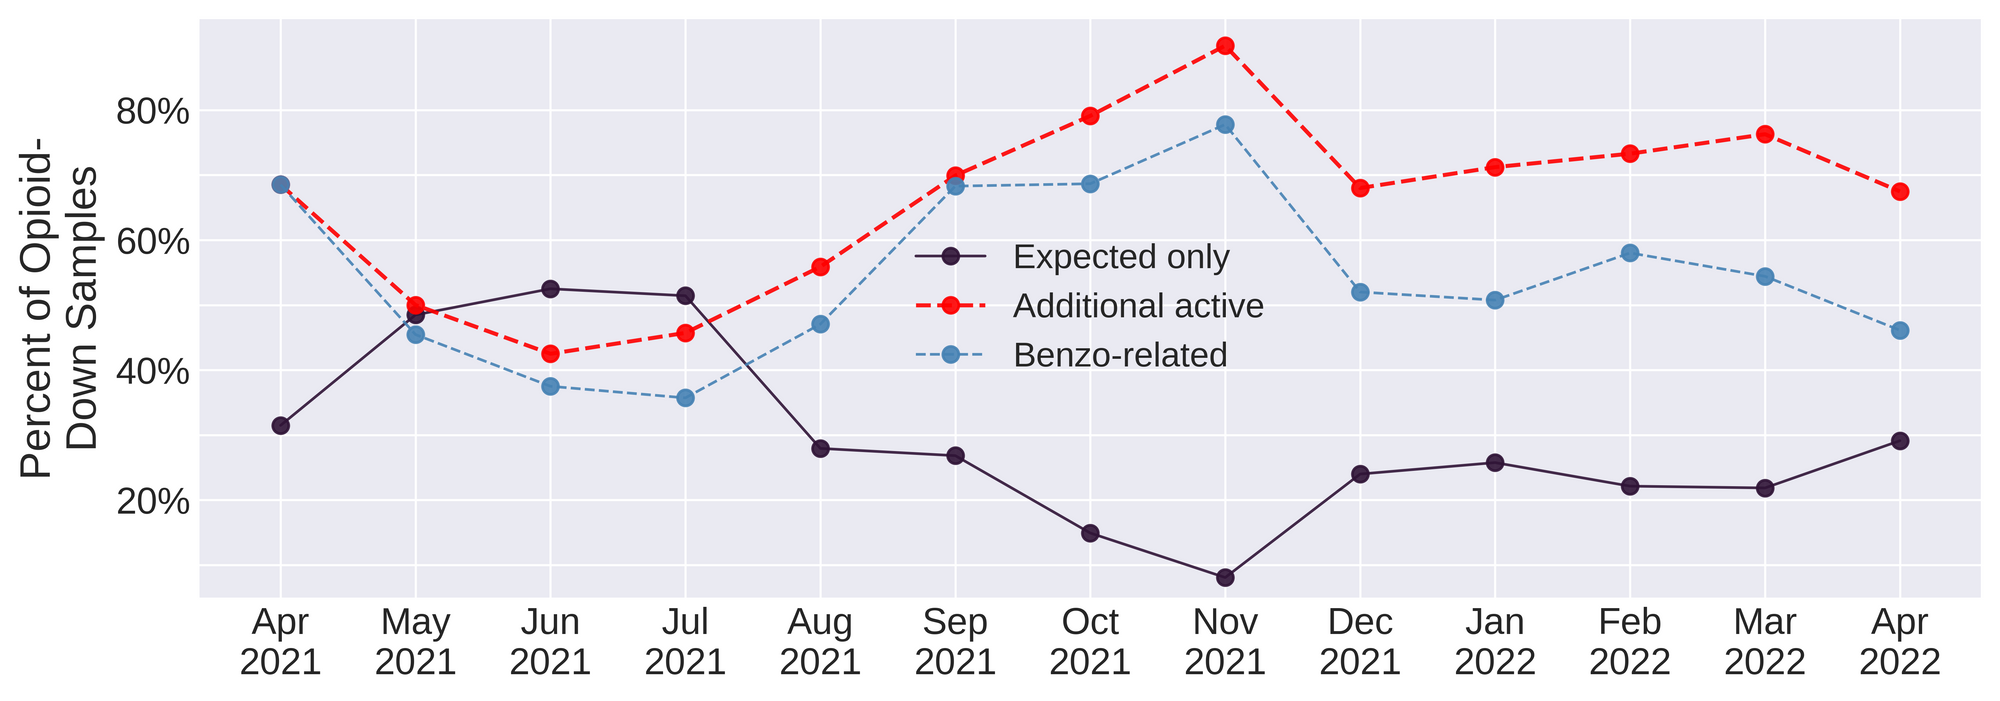
Benzo-related drugs remain the primary contributor to the additional actives found in expected opioid-down samples with 46% (95/206) of the total expected opioid-down samples checked containing a benzo-related drug. Unexpected fentanyl analogues (e.g. fluorofentanyl and carfentanil), other unexpected additional opioids (e.g. acetylcodeine and acetylmorphine), and xylazine represent a majority of the remaining adulterants, though scattered detections of other drugs are still found and can be reviewed in the pdf report at the end of this blog.
Every month we report on high potency fentanyl analogues, benzodiazepines, xylazine, nitazenes, and the profusion of countless other compounds detected in the down supply and it is utterly repulsive and devastating to revisit these findings time and time again when we know that safer supply of all drugs and decriminalisation are effective interventions in the unregulated market. As always, it is long past time we listen to the people who use drugs who have been pointing to remedies to these challenges.
Quantification for Expected Opioid-Down[1]
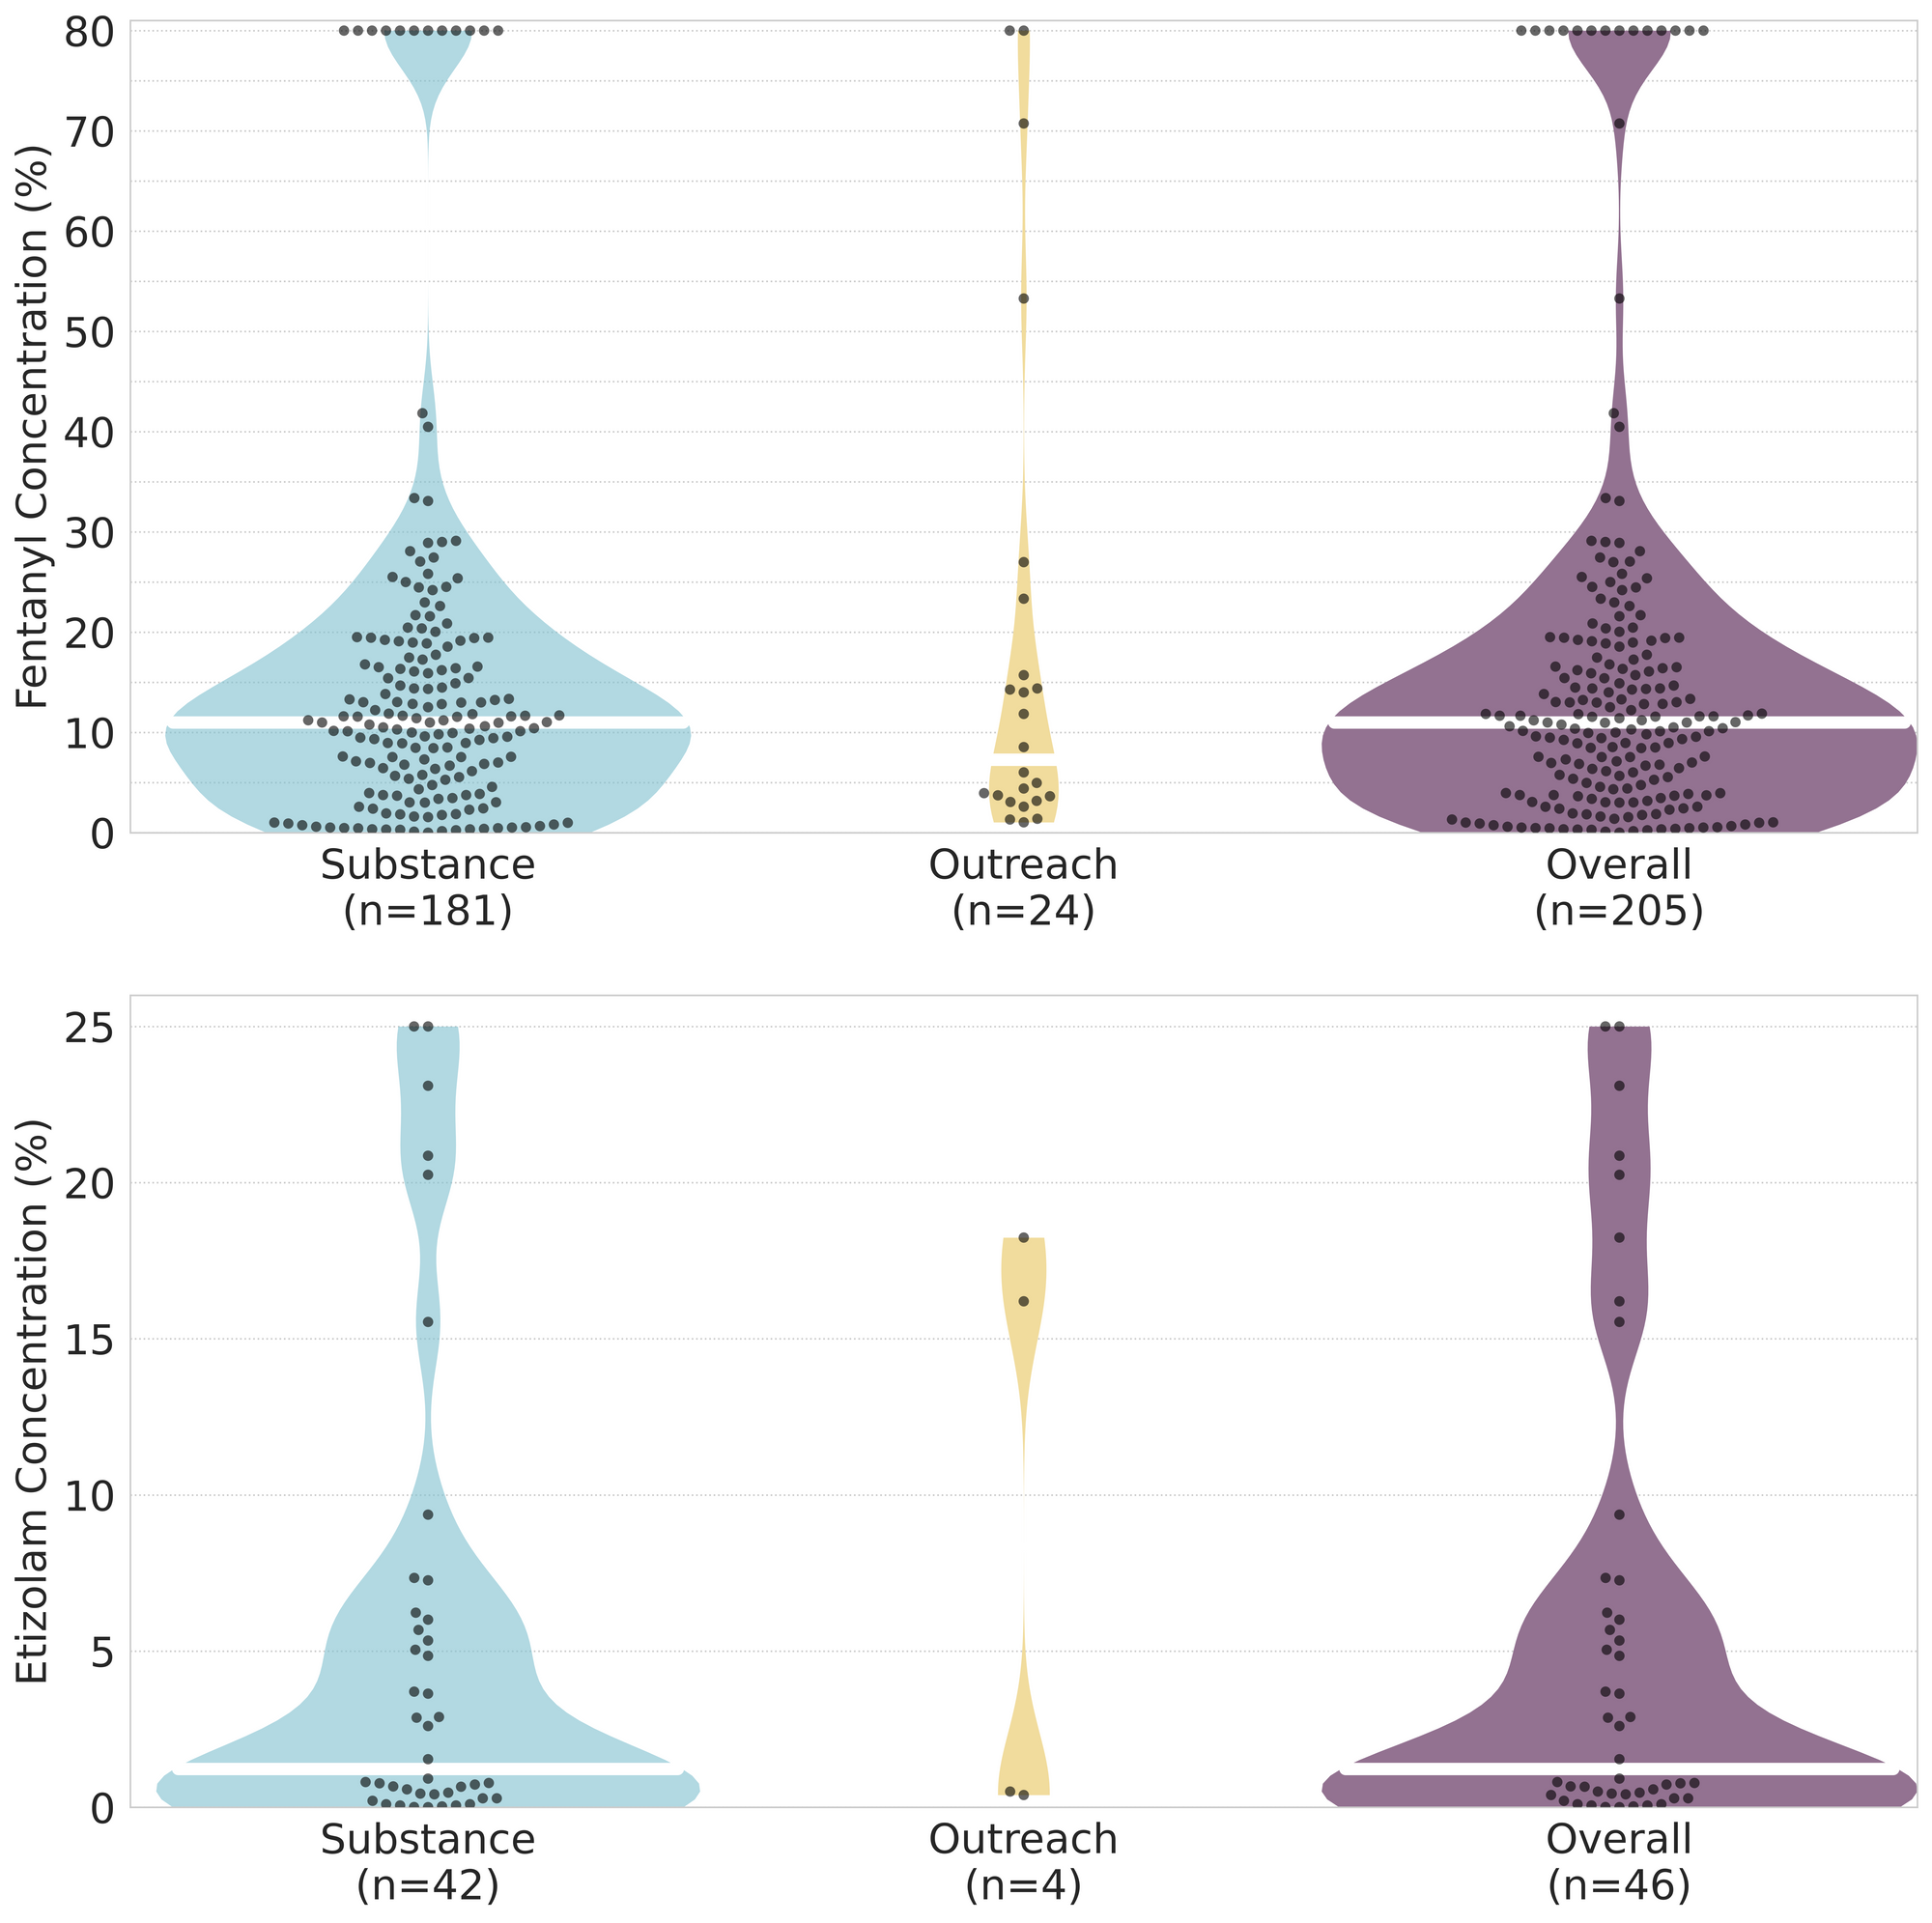
In April, we quantified fentanyl for 180 of the expected opioid-down samples containing fentanyl and found the median concentration to be 11.1% with the average strength of fentanyl we normally see being around 10% as well. Though the median is a useful indicator, it doesn’t capture the volatility of fentanyl concentrations present in the opioid supply, as any one sample might be the lowest strength (0.1%) or the strongest (>80%[2]). Similarly, the concentration of etizolam was across the board in expected opioid down samples, ranging from 0.1% to >25%[2:1], with a median of 2.9%.
Not all opioid down samples brought to our service can be quantified. This is primarily due to too limited sample collected for our instruments to report a reliable mass percentage. Nevertheless, qualitative detection is still possible. ↩︎
For samples that contain more than 80% fenanyl, or more than 25% etizolam by weight, our mass spectrometer is presently unable to reproducibly assign a concentration due to the upper limits of the calibration methods currently adopted. ↩︎ ↩︎

The fentanyl and etizolam concentrations that we quantified in down samples checked in April are presented in Fig. 4. Black dots are individual opioid-down samples, Horizontal white bars show the median concentrations of fentanyl and etizolam quantified, the width of the shaded regions mirrors the number of samples at a given concentration.
Want to be notified when we release these reports? Join our mailing list to receive updates about when our reports are out. You can subscribe and unsubscribe yourself from this list at any time.
Check back next month for the May report!
As always, send us feedback at substance@uvic.ca for how we can continue to offer our drug checking results in a useful way.